Zip Codes with the Highest Percentage of Population Employed in Health Diagnosing & Treating in Edmonds, WA
RELATED REPORTS & OPTIONS
Health Diagnosing & Treating
Edmonds
Compare Zip Codes
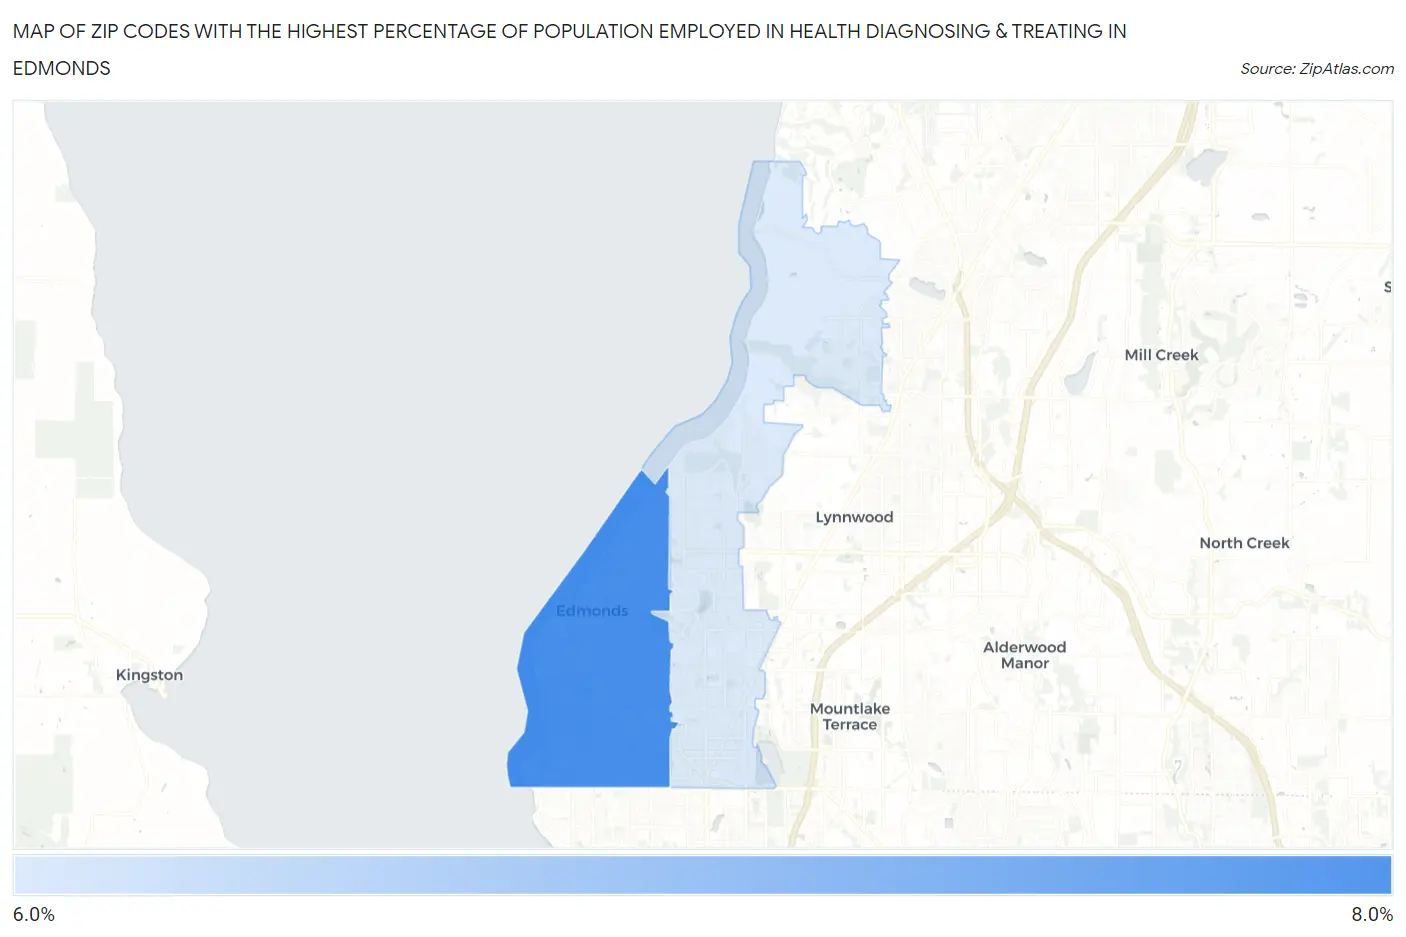
Map of Zip Codes with the Highest Percentage of Population Employed in Health Diagnosing & Treating in Edmonds
6.2%
7.8%
Zip Codes with the Highest Percentage of Population Employed in Health Diagnosing & Treating in Edmonds, WA
| Zip Code | % Employed | vs State | vs National | |
| 1. | 98020 | 7.8% | 5.6%(+2.26)#79 | 6.2%(+1.57)#7,962 |
| 2. | 98026 | 6.2% | 5.6%(+0.610)#165 | 6.2%(-0.081)#13,295 |
1
Common Questions
What are the Top Zip Codes with the Highest Percentage of Population Employed in Health Diagnosing & Treating in Edmonds, WA?
Top Zip Codes with the Highest Percentage of Population Employed in Health Diagnosing & Treating in Edmonds, WA are:
What zip code has the Highest Percentage of Population Employed in Health Diagnosing & Treating in Edmonds, WA?
98020 has the Highest Percentage of Population Employed in Health Diagnosing & Treating in Edmonds, WA with 7.8%.
What is the Percentage of Population Employed in Health Diagnosing & Treating in Edmonds, WA?
Percentage of Population Employed in Health Diagnosing & Treating in Edmonds is 6.0%.
What is the Percentage of Population Employed in Health Diagnosing & Treating in Washington?
Percentage of Population Employed in Health Diagnosing & Treating in Washington is 5.6%.
What is the Percentage of Population Employed in Health Diagnosing & Treating in the United States?
Percentage of Population Employed in Health Diagnosing & Treating in the United States is 6.2%.