Zip Codes with the Highest Percentage of Population Employed in Health Diagnosing & Treating in Bellevue, WA
RELATED REPORTS & OPTIONS
Health Diagnosing & Treating
Bellevue
Compare Zip Codes
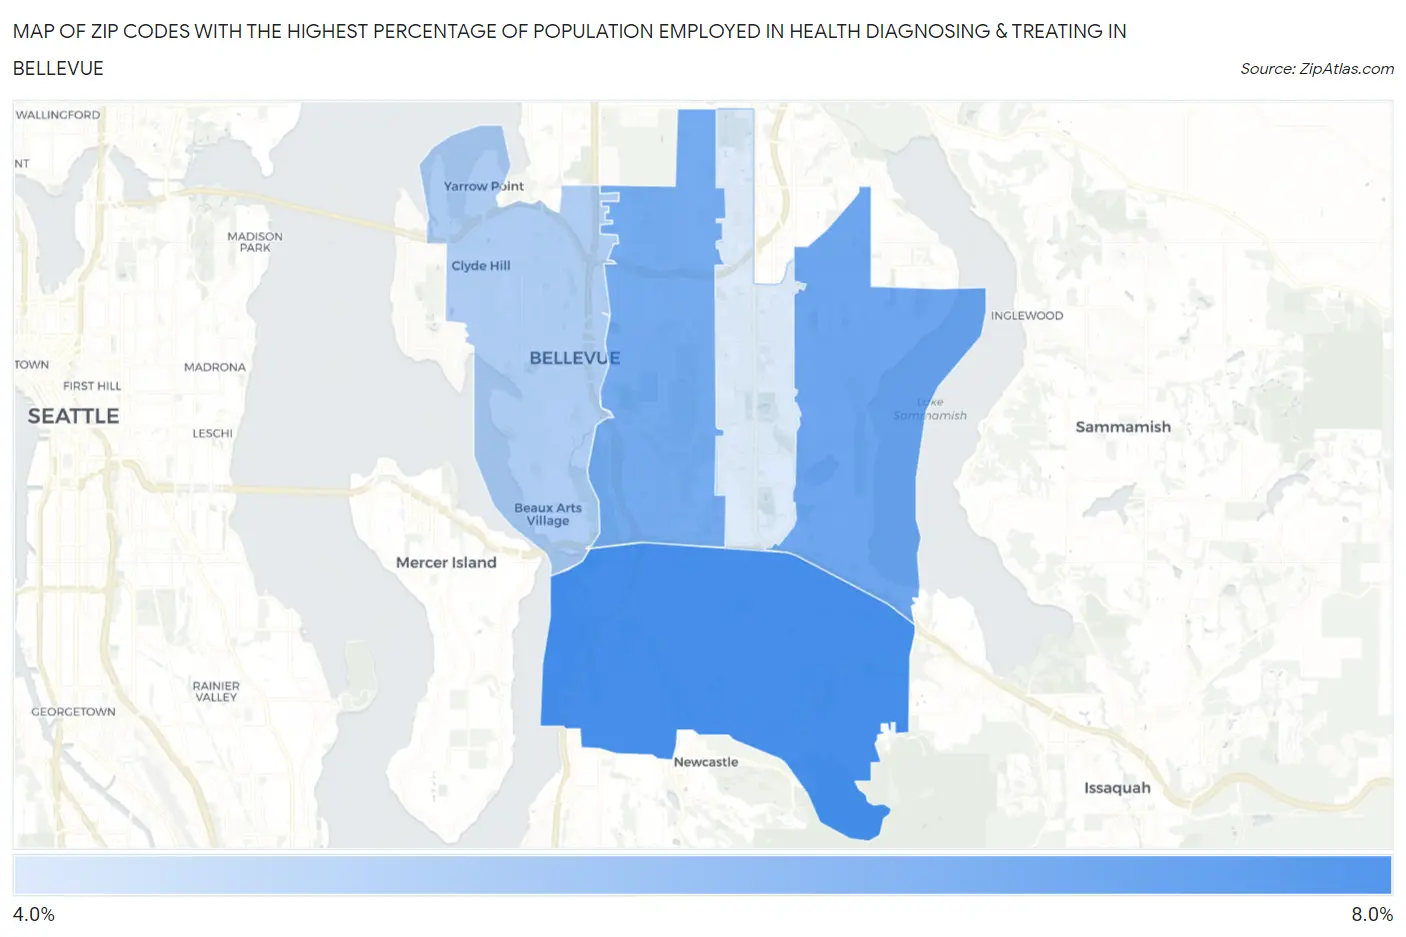
Map of Zip Codes with the Highest Percentage of Population Employed in Health Diagnosing & Treating in Bellevue
4.8%
6.8%
Zip Codes with the Highest Percentage of Population Employed in Health Diagnosing & Treating in Bellevue, WA
| Zip Code | % Employed | vs State | vs National | |
| 1. | 98006 | 6.8% | 5.6%(+1.22)#130 | 6.2%(+0.526)#11,091 |
| 2. | 98008 | 6.3% | 5.6%(+0.706)#161 | 6.2%(+0.015)#12,898 |
| 3. | 98005 | 6.2% | 5.6%(+0.624)#163 | 6.2%(-0.067)#13,240 |
| 4. | 98004 | 5.4% | 5.6%(-0.134)#228 | 6.2%(-0.825)#16,100 |
| 5. | 98007 | 4.8% | 5.6%(-0.738)#289 | 6.2%(-1.43)#18,443 |
1
Common Questions
What are the Top 3 Zip Codes with the Highest Percentage of Population Employed in Health Diagnosing & Treating in Bellevue, WA?
Top 3 Zip Codes with the Highest Percentage of Population Employed in Health Diagnosing & Treating in Bellevue, WA are:
What zip code has the Highest Percentage of Population Employed in Health Diagnosing & Treating in Bellevue, WA?
98006 has the Highest Percentage of Population Employed in Health Diagnosing & Treating in Bellevue, WA with 6.8%.
What is the Percentage of Population Employed in Health Diagnosing & Treating in Bellevue, WA?
Percentage of Population Employed in Health Diagnosing & Treating in Bellevue is 5.7%.
What is the Percentage of Population Employed in Health Diagnosing & Treating in Washington?
Percentage of Population Employed in Health Diagnosing & Treating in Washington is 5.6%.
What is the Percentage of Population Employed in Health Diagnosing & Treating in the United States?
Percentage of Population Employed in Health Diagnosing & Treating in the United States is 6.2%.