Venersborg, WA Map & Demographics
Venersborg Map
Venersborg Overview
$47,805
PER CAPITA INCOME
$130,651
AVG FAMILY INCOME
$126,642
AVG HOUSEHOLD INCOME
46.1%
WAGE / INCOME GAP [ % ]
53.9¢/ $1
WAGE / INCOME GAP [ $ ]
0.33
INEQUALITY / GINI INDEX
4,212
TOTAL POPULATION
1,997
MALE POPULATION
2,215
FEMALE POPULATION
90.16
MALES / 100 FEMALES
110.92
FEMALES / 100 MALES
41.5
MEDIAN AGE
3.3
AVG FAMILY SIZE
3.1
AVG HOUSEHOLD SIZE
1,931
LABOR FORCE [ PEOPLE ]
58.6%
PERCENT IN LABOR FORCE
5.1%
UNEMPLOYMENT RATE
Income in Venersborg
Income Overview in Venersborg
Per Capita Income in Venersborg is $47,805, while median incomes of families and households are $130,651 and $126,642 respectively.
| Characteristic | Number | Measure |
| Per Capita Income | 4,212 | $47,805 |
| Median Family Income | 1,176 | $130,651 |
| Mean Family Income | 1,176 | $151,647 |
| Median Household Income | 1,349 | $126,642 |
| Mean Household Income | 1,349 | $145,010 |
| Income Deficit | 1,176 | $0 |
| Wage / Income Gap (%) | 4,212 | 46.06% |
| Wage / Income Gap ($) | 4,212 | 53.94¢ per $1 |
| Gini / Inequality Index | 4,212 | 0.33 |
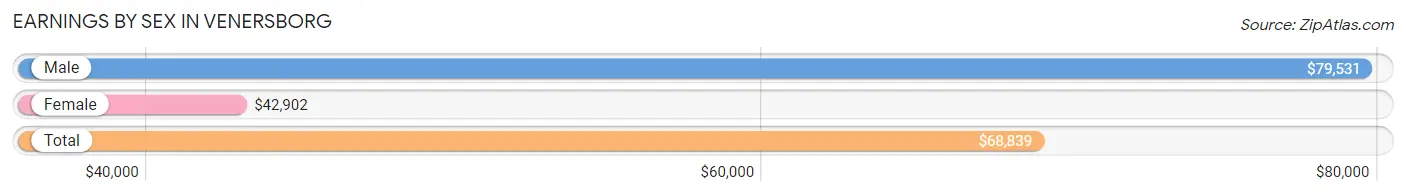
Earnings by Sex in Venersborg
Average Earnings in Venersborg are $68,839, $79,531 for men and $42,902 for women, a difference of 46.1%.
| Sex | Number | Average Earnings |
| Male | 1,071 (51.4%) | $79,531 |
| Female | 1,013 (48.6%) | $42,902 |
| Total | 2,084 (100.0%) | $68,839 |
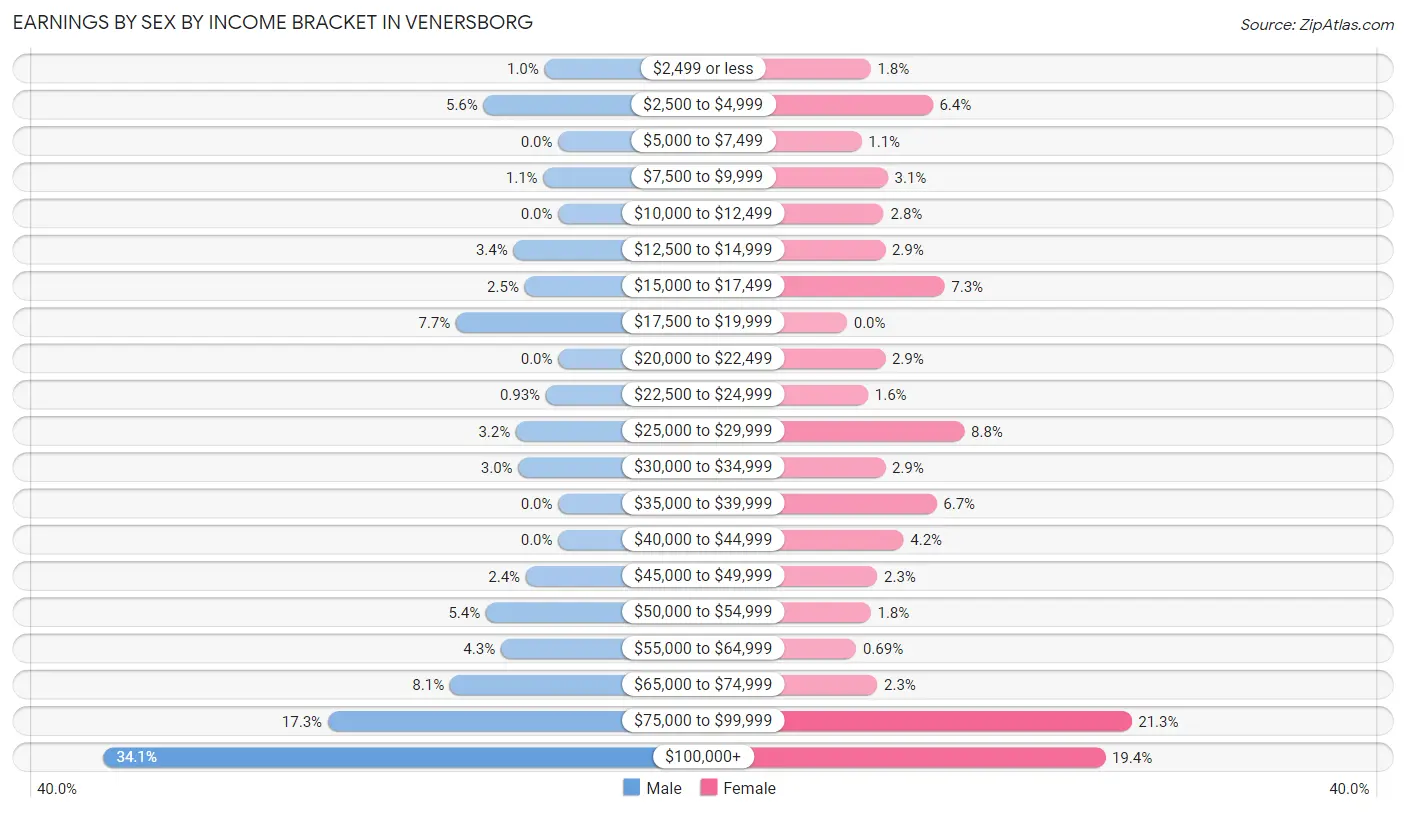
Earnings by Sex by Income Bracket in Venersborg
The most common earnings brackets in Venersborg are $100,000+ for men (365 | 34.1%) and $75,000 to $99,999 for women (216 | 21.3%).
| Income | Male | Female |
| $2,499 or less | 11 (1.0%) | 18 (1.8%) |
| $2,500 to $4,999 | 60 (5.6%) | 65 (6.4%) |
| $5,000 to $7,499 | 0 (0.0%) | 11 (1.1%) |
| $7,500 to $9,999 | 12 (1.1%) | 31 (3.1%) |
| $10,000 to $12,499 | 0 (0.0%) | 28 (2.8%) |
| $12,500 to $14,999 | 36 (3.4%) | 29 (2.9%) |
| $15,000 to $17,499 | 27 (2.5%) | 74 (7.3%) |
| $17,500 to $19,999 | 82 (7.7%) | 0 (0.0%) |
| $20,000 to $22,499 | 0 (0.0%) | 29 (2.9%) |
| $22,500 to $24,999 | 10 (0.9%) | 16 (1.6%) |
| $25,000 to $29,999 | 34 (3.2%) | 89 (8.8%) |
| $30,000 to $34,999 | 32 (3.0%) | 29 (2.9%) |
| $35,000 to $39,999 | 0 (0.0%) | 68 (6.7%) |
| $40,000 to $44,999 | 0 (0.0%) | 43 (4.2%) |
| $45,000 to $49,999 | 26 (2.4%) | 23 (2.3%) |
| $50,000 to $54,999 | 58 (5.4%) | 18 (1.8%) |
| $55,000 to $64,999 | 46 (4.3%) | 7 (0.7%) |
| $65,000 to $74,999 | 87 (8.1%) | 23 (2.3%) |
| $75,000 to $99,999 | 185 (17.3%) | 216 (21.3%) |
| $100,000+ | 365 (34.1%) | 196 (19.4%) |
| Total | 1,071 (100.0%) | 1,013 (100.0%) |
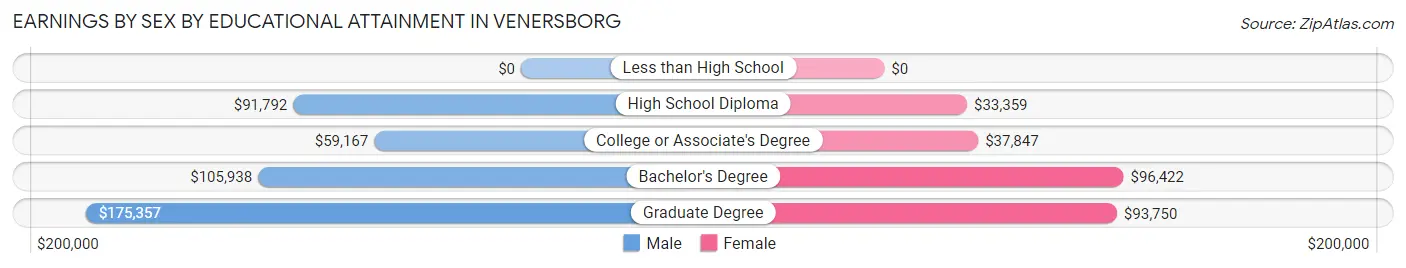
Earnings by Sex by Educational Attainment in Venersborg
Average earnings in Venersborg are $90,219 for men and $54,653 for women, a difference of 39.4%. Men with an educational attainment of graduate degree enjoy the highest average annual earnings of $175,357, while those with college or associate's degree education earn the least with $59,167. Women with an educational attainment of bachelor's degree earn the most with the average annual earnings of $96,422, while those with high school diploma education have the smallest earnings of $33,359.
| Educational Attainment | Male Income | Female Income |
| Less than High School | - | - |
| High School Diploma | $91,792 | $33,359 |
| College or Associate's Degree | $59,167 | $37,847 |
| Bachelor's Degree | $105,938 | $96,422 |
| Graduate Degree | $175,357 | $93,750 |
| Total | $90,219 | $54,653 |
Family Income in Venersborg
Family Income Brackets in Venersborg
According to the Venersborg family income data, there are 368 families falling into the $100,000 to $149,999 income range, which is the most common income bracket and makes up 31.3% of all families.
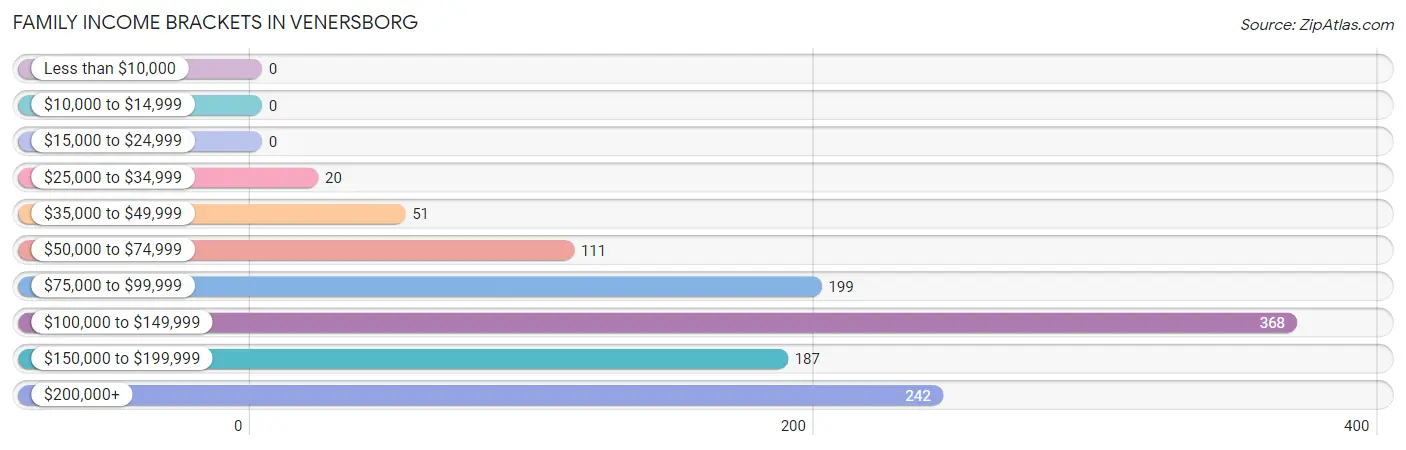
| Income Bracket | # Families | % Families |
| Less than $10,000 | 0 | 0.0% |
| $10,000 to $14,999 | 0 | 0.0% |
| $15,000 to $24,999 | 0 | 0.0% |
| $25,000 to $34,999 | 20 | 1.7% |
| $35,000 to $49,999 | 51 | 4.3% |
| $50,000 to $74,999 | 111 | 9.4% |
| $75,000 to $99,999 | 199 | 16.9% |
| $100,000 to $149,999 | 368 | 31.3% |
| $150,000 to $199,999 | 187 | 15.9% |
| $200,000+ | 242 | 20.6% |
Family Income by Famaliy Size in Venersborg
6-person families (87 | 7.4%) account for the highest median family income in Venersborg with $139,650 per family, while 2-person families (488 | 41.5%) have the highest median income of $65,445 per family member.
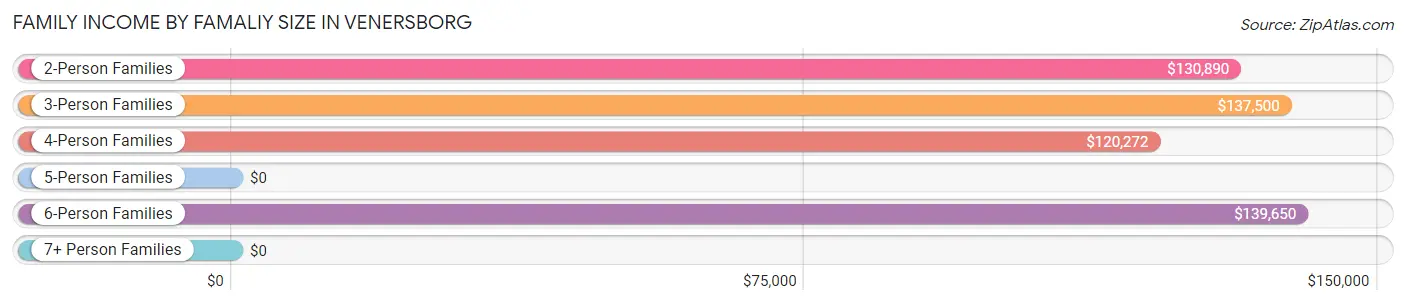
| Income Bracket | # Families | Median Income |
| 2-Person Families | 488 (41.5%) | $130,890 |
| 3-Person Families | 224 (19.1%) | $137,500 |
| 4-Person Families | 284 (24.1%) | $120,272 |
| 5-Person Families | 59 (5.0%) | $0 |
| 6-Person Families | 87 (7.4%) | $139,650 |
| 7+ Person Families | 34 (2.9%) | $0 |
| Total | 1,176 (100.0%) | $130,651 |
Family Income by Number of Earners in Venersborg
The median family income in Venersborg is $130,651, with families comprising 3+ earners (141) having the highest median family income of $202,583, while families with no earners (151) have the lowest median family income of $81,336, accounting for 12.0% and 12.8% of families, respectively.
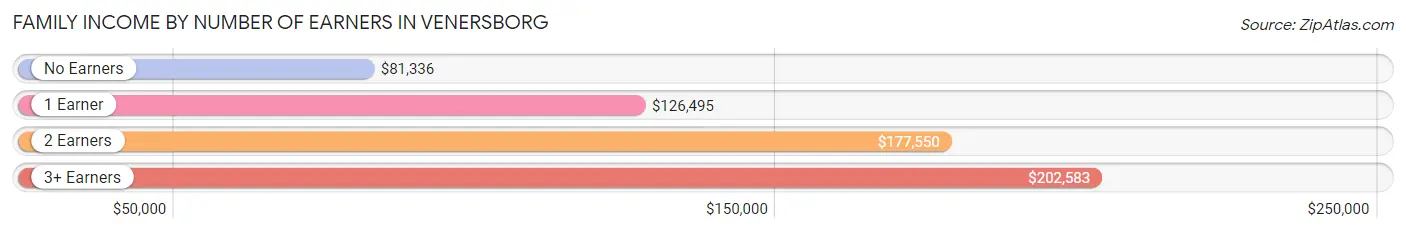
| Number of Earners | # Families | Median Income |
| No Earners | 151 (12.8%) | $81,336 |
| 1 Earner | 495 (42.1%) | $126,495 |
| 2 Earners | 389 (33.1%) | $177,550 |
| 3+ Earners | 141 (12.0%) | $202,583 |
| Total | 1,176 (100.0%) | $130,651 |
Household Income in Venersborg
Household Income Brackets in Venersborg
With 393 households falling in the category, the $100,000 to $149,999 income range is the most frequent in Venersborg, accounting for 29.1% of all households.
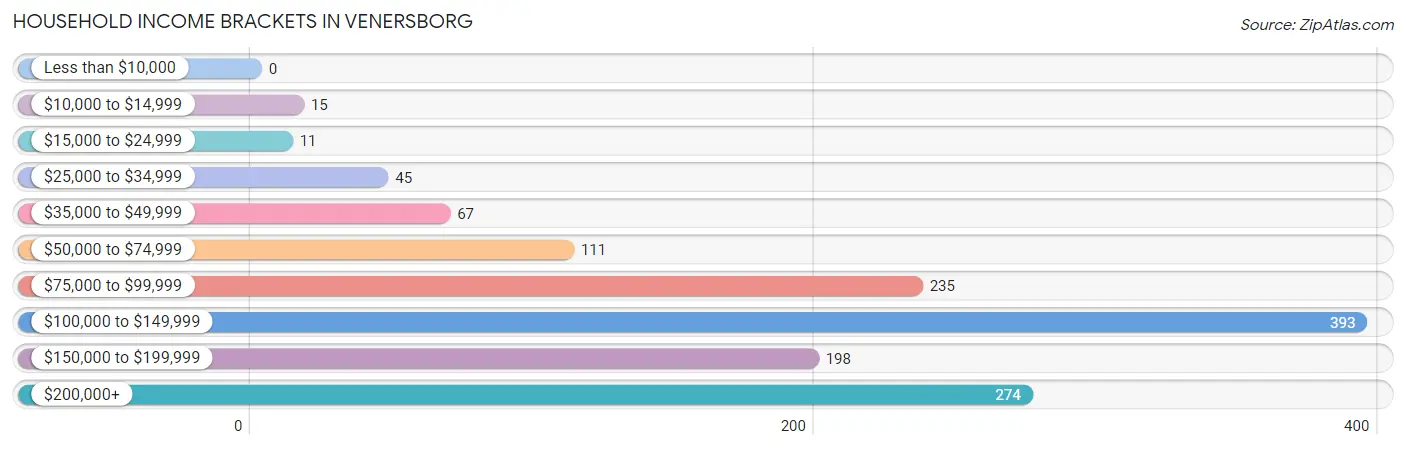
| Income Bracket | # Households | % Households |
| Less than $10,000 | 0 | 0.0% |
| $10,000 to $14,999 | 15 | 1.1% |
| $15,000 to $24,999 | 11 | 0.8% |
| $25,000 to $34,999 | 45 | 3.3% |
| $35,000 to $49,999 | 67 | 5.0% |
| $50,000 to $74,999 | 111 | 8.2% |
| $75,000 to $99,999 | 235 | 17.4% |
| $100,000 to $149,999 | 393 | 29.1% |
| $150,000 to $199,999 | 198 | 14.7% |
| $200,000+ | 274 | 20.3% |
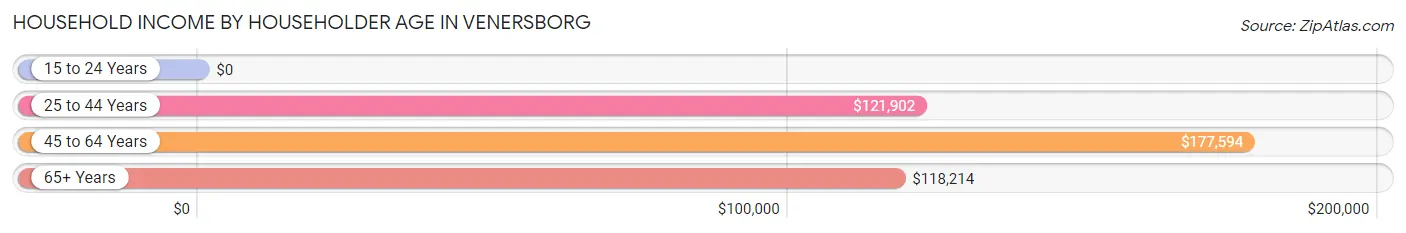
Household Income by Householder Age in Venersborg
The median household income in Venersborg is $126,642, with the highest median household income of $177,594 found in the 45 to 64 years age bracket for the primary householder. A total of 601 households (44.6%) fall into this category. Meanwhile, the 15 to 24 years age bracket for the primary householder has the lowest median household income of $0, with 32 households (2.4%) in this group.
| Income Bracket | # Households | Median Income |
| 15 to 24 Years | 32 (2.4%) | $0 |
| 25 to 44 Years | 290 (21.5%) | $121,902 |
| 45 to 64 Years | 601 (44.6%) | $177,594 |
| 65+ Years | 426 (31.6%) | $118,214 |
| Total | 1,349 (100.0%) | $126,642 |
Poverty in Venersborg
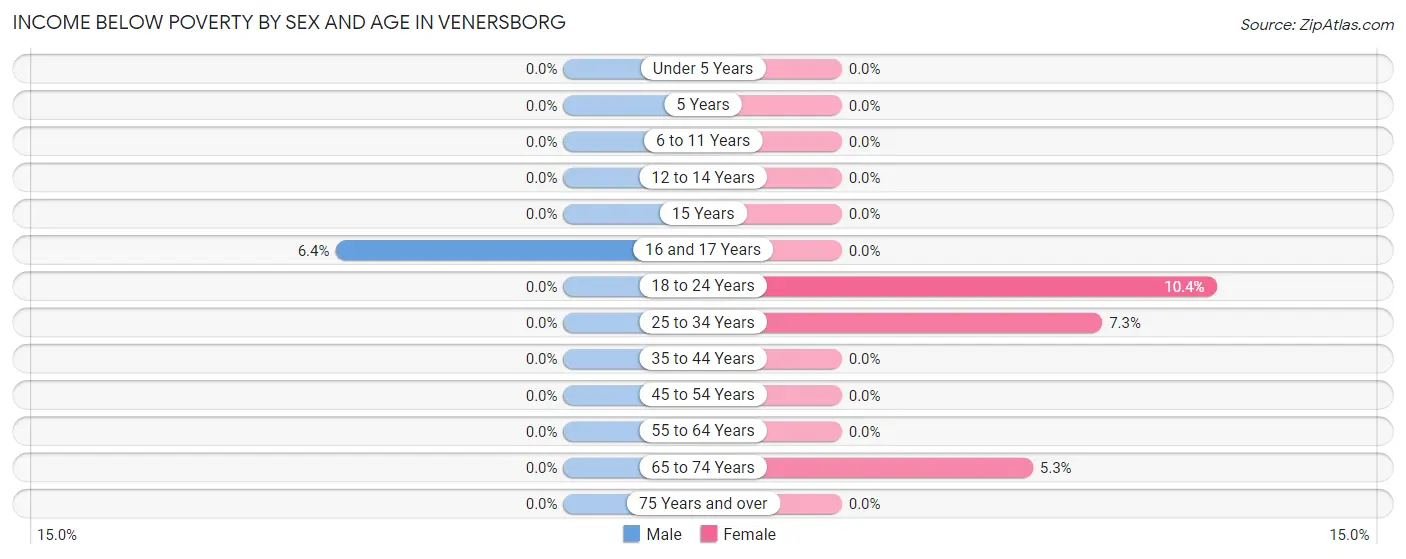
Income Below Poverty by Sex and Age in Venersborg
With 0.4% poverty level for males and 2.4% for females among the residents of Venersborg, 16 and 17 year old males and 18 to 24 year old females are the most vulnerable to poverty, with 8 males (6.4%) and 17 females (10.4%) in their respective age groups living below the poverty level.
| Age Bracket | Male | Female |
| Under 5 Years | 0 (0.0%) | 0 (0.0%) |
| 5 Years | 0 (0.0%) | 0 (0.0%) |
| 6 to 11 Years | 0 (0.0%) | 0 (0.0%) |
| 12 to 14 Years | 0 (0.0%) | 0 (0.0%) |
| 15 Years | 0 (0.0%) | 0 (0.0%) |
| 16 and 17 Years | 8 (6.4%) | 0 (0.0%) |
| 18 to 24 Years | 0 (0.0%) | 17 (10.4%) |
| 25 to 34 Years | 0 (0.0%) | 20 (7.2%) |
| 35 to 44 Years | 0 (0.0%) | 0 (0.0%) |
| 45 to 54 Years | 0 (0.0%) | 0 (0.0%) |
| 55 to 64 Years | 0 (0.0%) | 0 (0.0%) |
| 65 to 74 Years | 0 (0.0%) | 15 (5.3%) |
| 75 Years and over | 0 (0.0%) | 0 (0.0%) |
| Total | 8 (0.4%) | 52 (2.4%) |
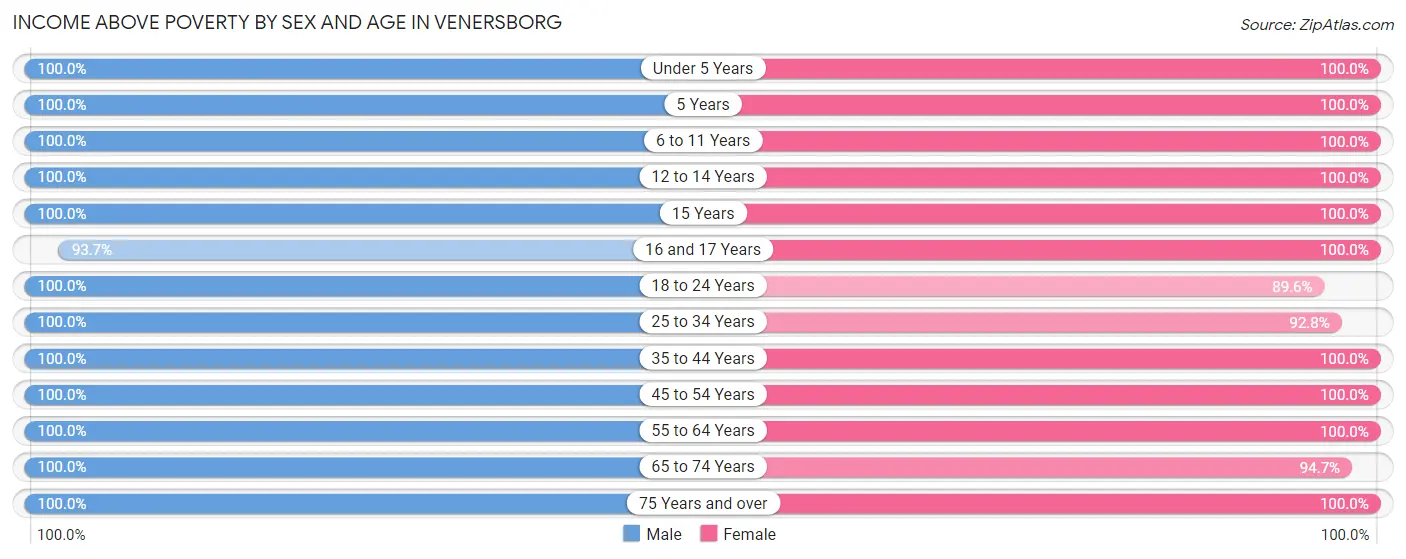
Income Above Poverty by Sex and Age in Venersborg
According to the poverty statistics in Venersborg, males aged under 5 years and females aged under 5 years are the age groups that are most secure financially, with 100.0% of males and 100.0% of females in these age groups living above the poverty line.
| Age Bracket | Male | Female |
| Under 5 Years | 80 (100.0%) | 120 (100.0%) |
| 5 Years | 42 (100.0%) | 50 (100.0%) |
| 6 to 11 Years | 63 (100.0%) | 190 (100.0%) |
| 12 to 14 Years | 155 (100.0%) | 161 (100.0%) |
| 15 Years | 45 (100.0%) | 10 (100.0%) |
| 16 and 17 Years | 118 (93.6%) | 44 (100.0%) |
| 18 to 24 Years | 128 (100.0%) | 146 (89.6%) |
| 25 to 34 Years | 86 (100.0%) | 256 (92.7%) |
| 35 to 44 Years | 223 (100.0%) | 215 (100.0%) |
| 45 to 54 Years | 250 (100.0%) | 279 (100.0%) |
| 55 to 64 Years | 331 (100.0%) | 295 (100.0%) |
| 65 to 74 Years | 300 (100.0%) | 267 (94.7%) |
| 75 Years and over | 168 (100.0%) | 130 (100.0%) |
| Total | 1,989 (99.6%) | 2,163 (97.7%) |
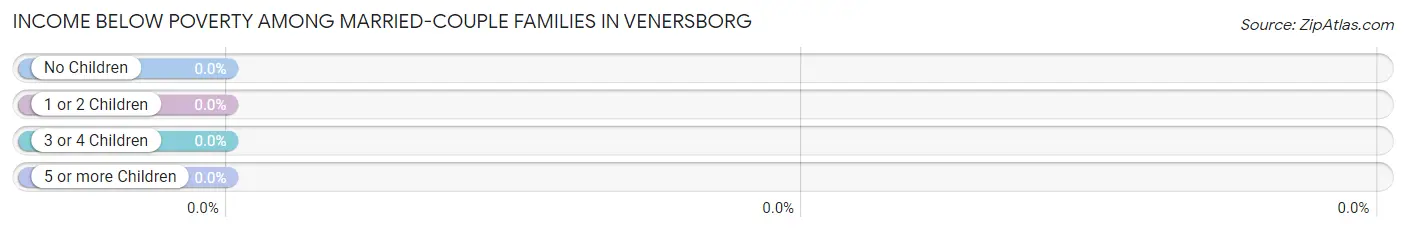
Income Below Poverty Among Married-Couple Families in Venersborg
| Children | Above Poverty | Below Poverty |
| No Children | 588 (100.0%) | 0 (0.0%) |
| 1 or 2 Children | 366 (100.0%) | 0 (0.0%) |
| 3 or 4 Children | 103 (100.0%) | 0 (0.0%) |
| 5 or more Children | 25 (100.0%) | 0 (0.0%) |
| Total | 1,082 (100.0%) | 0 (0.0%) |
Income Below Poverty Among Single-Parent Households in Venersborg
| Children | Single Father | Single Mother |
| No Children | 0 (0.0%) | 0 (0.0%) |
| 1 or 2 Children | 0 (0.0%) | 0 (0.0%) |
| 3 or 4 Children | 0 (0.0%) | 0 (0.0%) |
| 5 or more Children | 0 (0.0%) | 0 (0.0%) |
| Total | 0 (0.0%) | 0 (0.0%) |
Income Below Poverty Among Married-Couple vs Single-Parent Households in Venersborg
| Children | Married-Couple Families | Single-Parent Households |
| No Children | 0 (0.0%) | 0 (0.0%) |
| 1 or 2 Children | 0 (0.0%) | 0 (0.0%) |
| 3 or 4 Children | 0 (0.0%) | 0 (0.0%) |
| 5 or more Children | 0 (0.0%) | 0 (0.0%) |
| Total | 0 (0.0%) | 0 (0.0%) |
Race in Venersborg
The most populous races in Venersborg are White / Caucasian (3,833 | 91.0%), Two or more Races (190 | 4.5%), and Asian (121 | 2.9%).
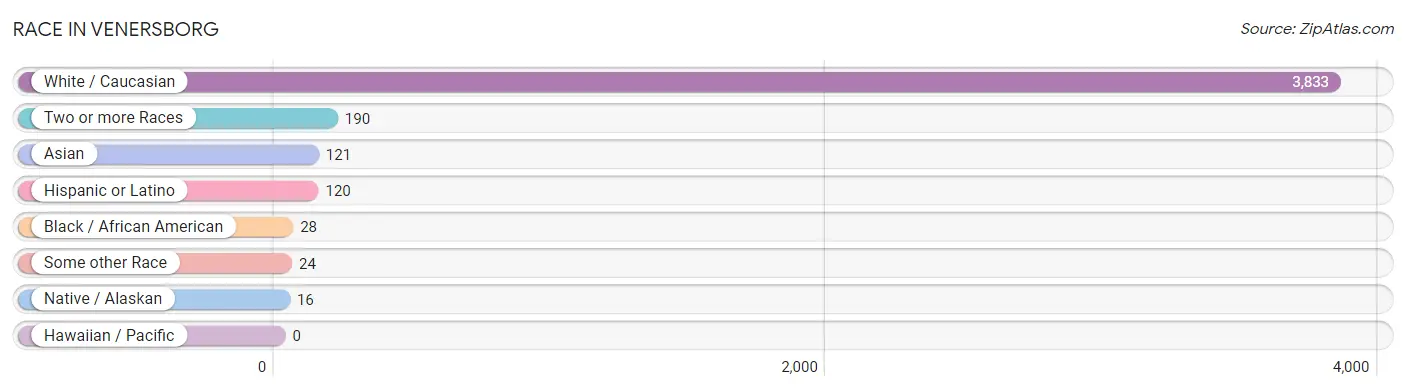
| Race | # Population | % Population |
| Asian | 121 | 2.9% |
| Black / African American | 28 | 0.7% |
| Hawaiian / Pacific | 0 | 0.0% |
| Hispanic or Latino | 120 | 2.9% |
| Native / Alaskan | 16 | 0.4% |
| White / Caucasian | 3,833 | 91.0% |
| Two or more Races | 190 | 4.5% |
| Some other Race | 24 | 0.6% |
| Total | 4,212 | 100.0% |
Ancestry in Venersborg
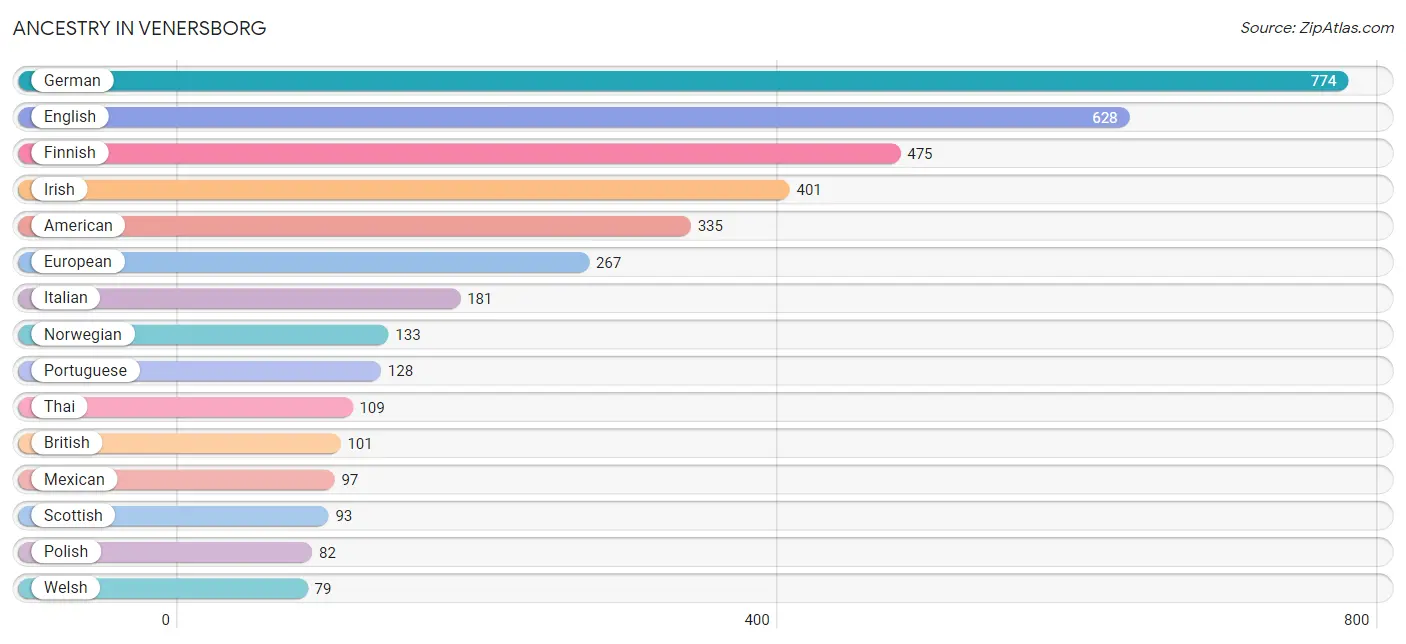
The most populous ancestries reported in Venersborg are German (774 | 18.4%), English (628 | 14.9%), Finnish (475 | 11.3%), Irish (401 | 9.5%), and American (335 | 8.0%), together accounting for 62.0% of all Venersborg residents.
| Ancestry | # Population | % Population |
| American | 335 | 8.0% |
| Arab | 38 | 0.9% |
| Belgian | 8 | 0.2% |
| British | 101 | 2.4% |
| Burmese | 50 | 1.2% |
| Canadian | 35 | 0.8% |
| Celtic | 24 | 0.6% |
| Central American | 14 | 0.3% |
| Cherokee | 20 | 0.5% |
| Cheyenne | 15 | 0.4% |
| Chickasaw | 11 | 0.3% |
| Colombian | 9 | 0.2% |
| Croatian | 27 | 0.6% |
| Czech | 49 | 1.2% |
| Danish | 73 | 1.7% |
| Dutch | 24 | 0.6% |
| English | 628 | 14.9% |
| European | 267 | 6.3% |
| Finnish | 475 | 11.3% |
| French | 10 | 0.2% |
| French Canadian | 24 | 0.6% |
| German | 774 | 18.4% |
| Guamanian / Chamorro | 7 | 0.2% |
| Hungarian | 9 | 0.2% |
| Indian (Asian) | 18 | 0.4% |
| Irish | 401 | 9.5% |
| Italian | 181 | 4.3% |
| Korean | 23 | 0.5% |
| Latvian | 8 | 0.2% |
| Lebanese | 38 | 0.9% |
| Lithuanian | 9 | 0.2% |
| Malaysian | 26 | 0.6% |
| Mexican | 97 | 2.3% |
| Northern European | 68 | 1.6% |
| Norwegian | 133 | 3.2% |
| Polish | 82 | 1.9% |
| Portuguese | 128 | 3.0% |
| Russian | 7 | 0.2% |
| Salvadoran | 14 | 0.3% |
| Scandinavian | 29 | 0.7% |
| Scotch-Irish | 36 | 0.9% |
| Scottish | 93 | 2.2% |
| South American | 9 | 0.2% |
| Swedish | 58 | 1.4% |
| Swiss | 63 | 1.5% |
| Thai | 109 | 2.6% |
| Welsh | 79 | 1.9% | View All 47 Rows |
Immigrants in Venersborg
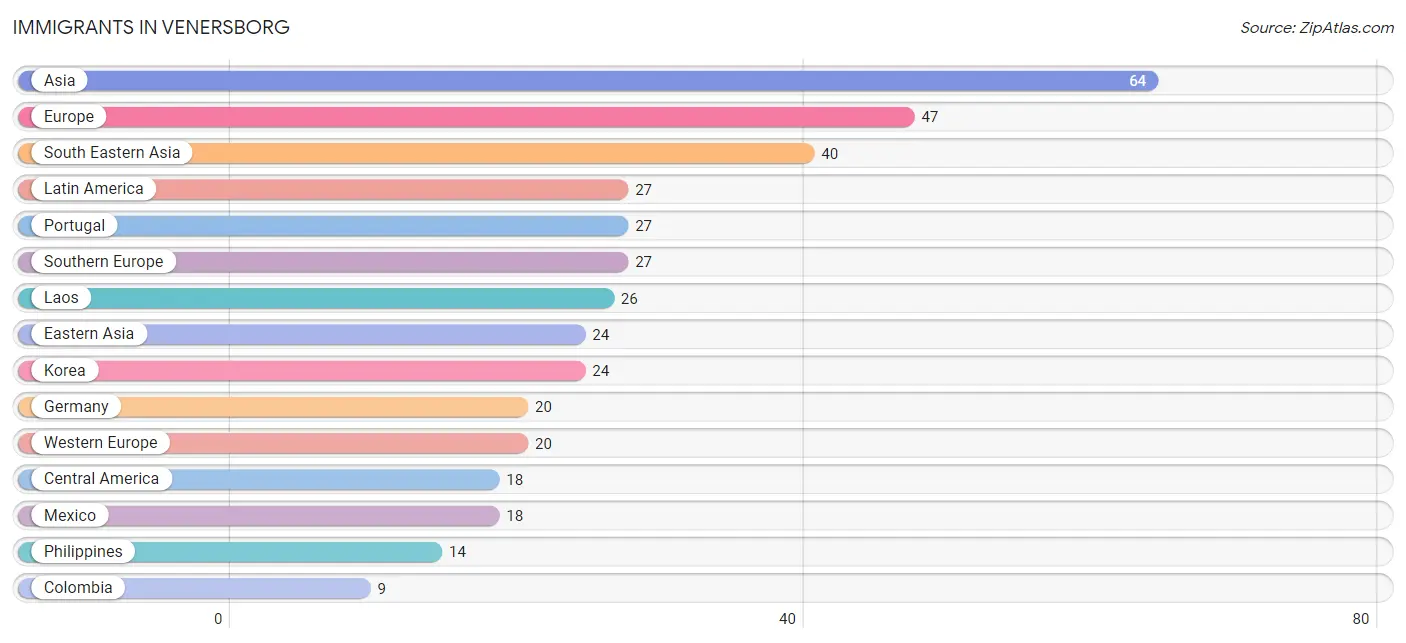
The most numerous immigrant groups reported in Venersborg came from Asia (64 | 1.5%), Europe (47 | 1.1%), South Eastern Asia (40 | 0.9%), Latin America (27 | 0.6%), and Portugal (27 | 0.6%), together accounting for 4.9% of all Venersborg residents.
| Immigration Origin | # Population | % Population |
| Asia | 64 | 1.5% |
| Central America | 18 | 0.4% |
| Colombia | 9 | 0.2% |
| Eastern Asia | 24 | 0.6% |
| Europe | 47 | 1.1% |
| Germany | 20 | 0.5% |
| Korea | 24 | 0.6% |
| Laos | 26 | 0.6% |
| Latin America | 27 | 0.6% |
| Mexico | 18 | 0.4% |
| Philippines | 14 | 0.3% |
| Portugal | 27 | 0.6% |
| South America | 9 | 0.2% |
| South Eastern Asia | 40 | 0.9% |
| Southern Europe | 27 | 0.6% |
| Western Europe | 20 | 0.5% | View All 16 Rows |
Sex and Age in Venersborg
Sex and Age in Venersborg
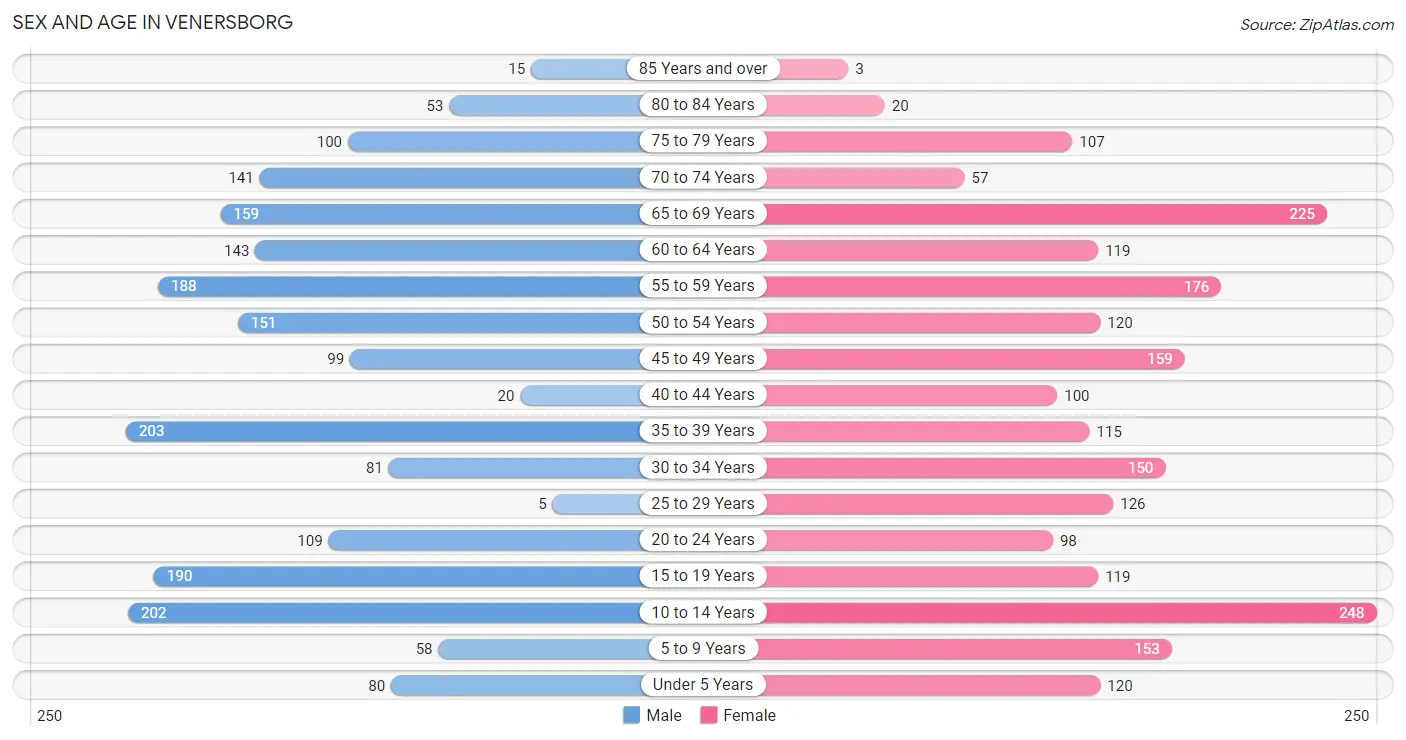
The most populous age groups in Venersborg are 35 to 39 Years (203 | 10.2%) for men and 10 to 14 Years (248 | 11.2%) for women.
| Age Bracket | Male | Female |
| Under 5 Years | 80 (4.0%) | 120 (5.4%) |
| 5 to 9 Years | 58 (2.9%) | 153 (6.9%) |
| 10 to 14 Years | 202 (10.1%) | 248 (11.2%) |
| 15 to 19 Years | 190 (9.5%) | 119 (5.4%) |
| 20 to 24 Years | 109 (5.5%) | 98 (4.4%) |
| 25 to 29 Years | 5 (0.3%) | 126 (5.7%) |
| 30 to 34 Years | 81 (4.1%) | 150 (6.8%) |
| 35 to 39 Years | 203 (10.2%) | 115 (5.2%) |
| 40 to 44 Years | 20 (1.0%) | 100 (4.5%) |
| 45 to 49 Years | 99 (5.0%) | 159 (7.2%) |
| 50 to 54 Years | 151 (7.6%) | 120 (5.4%) |
| 55 to 59 Years | 188 (9.4%) | 176 (8.0%) |
| 60 to 64 Years | 143 (7.2%) | 119 (5.4%) |
| 65 to 69 Years | 159 (8.0%) | 225 (10.2%) |
| 70 to 74 Years | 141 (7.1%) | 57 (2.6%) |
| 75 to 79 Years | 100 (5.0%) | 107 (4.8%) |
| 80 to 84 Years | 53 (2.6%) | 20 (0.9%) |
| 85 Years and over | 15 (0.7%) | 3 (0.1%) |
| Total | 1,997 (100.0%) | 2,215 (100.0%) |
Families and Households in Venersborg
Median Family Size in Venersborg
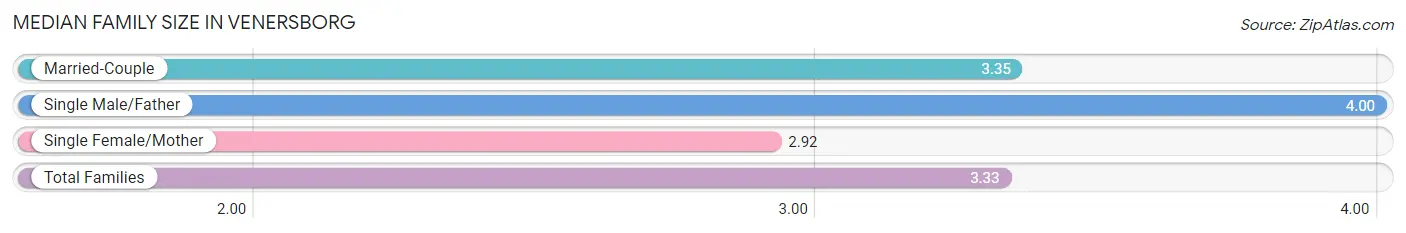
The median family size in Venersborg is 3.33 persons per family, with single male/father families (15 | 1.3%) accounting for the largest median family size of 4 persons per family. On the other hand, single female/mother families (79 | 6.7%) represent the smallest median family size with 2.92 persons per family.
| Family Type | # Families | Family Size |
| Married-Couple | 1,082 (92.0%) | 3.35 |
| Single Male/Father | 15 (1.3%) | 4.00 |
| Single Female/Mother | 79 (6.7%) | 2.92 |
| Total Families | 1,176 (100.0%) | 3.33 |
Median Household Size in Venersborg
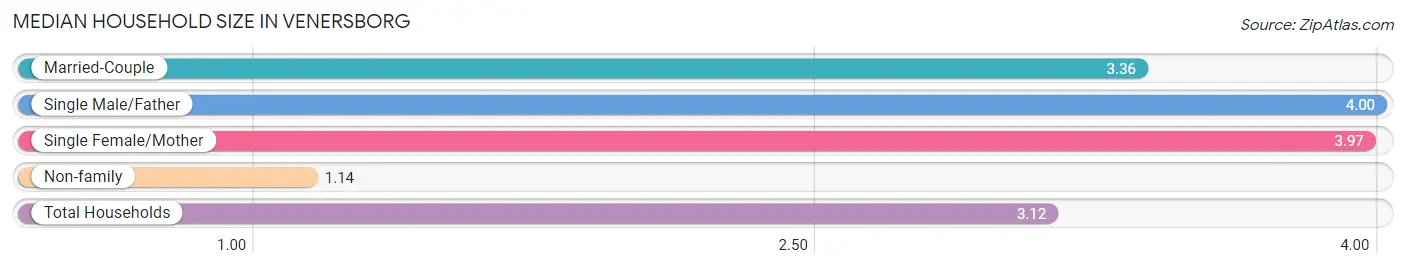
The median household size in Venersborg is 3.12 persons per household, with single male/father households (15 | 1.1%) accounting for the largest median household size of 4 persons per household. non-family households (173 | 12.8%) represent the smallest median household size with 1.14 persons per household.
| Household Type | # Households | Household Size |
| Married-Couple | 1,082 (80.2%) | 3.36 |
| Single Male/Father | 15 (1.1%) | 4.00 |
| Single Female/Mother | 79 (5.9%) | 3.97 |
| Non-family | 173 (12.8%) | 1.14 |
| Total Households | 1,349 (100.0%) | 3.12 |
Household Size by Marriage Status in Venersborg
Out of a total of 1,349 households in Venersborg, 1,176 (87.2%) are family households, while 173 (12.8%) are nonfamily households. The most numerous type of family households are 2-person households, comprising 472, and the most common type of nonfamily households are 1-person households, comprising 146.
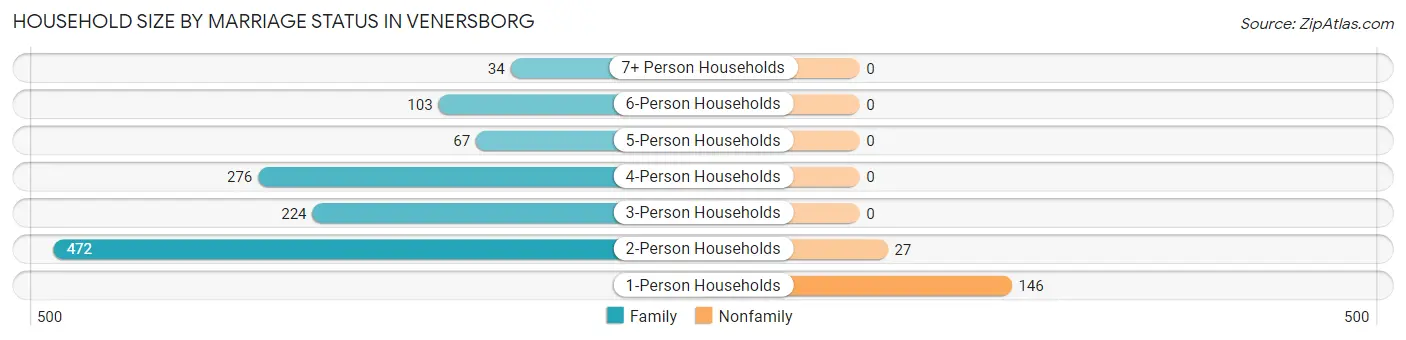
| Household Size | Family Households | Nonfamily Households |
| 1-Person Households | - | 146 (10.8%) |
| 2-Person Households | 472 (35.0%) | 27 (2.0%) |
| 3-Person Households | 224 (16.6%) | 0 (0.0%) |
| 4-Person Households | 276 (20.5%) | 0 (0.0%) |
| 5-Person Households | 67 (5.0%) | 0 (0.0%) |
| 6-Person Households | 103 (7.6%) | 0 (0.0%) |
| 7+ Person Households | 34 (2.5%) | 0 (0.0%) |
| Total | 1,176 (87.2%) | 173 (12.8%) |
Female Fertility in Venersborg
Fertility by Age in Venersborg
Average fertility rate in Venersborg is 133.0 births per 1,000 women. Women in the age bracket of 20 to 34 years have the highest fertility rate with 219.0 births per 1,000 women. Women in the age bracket of 20 to 34 years acount for 69.5% of all women with births.
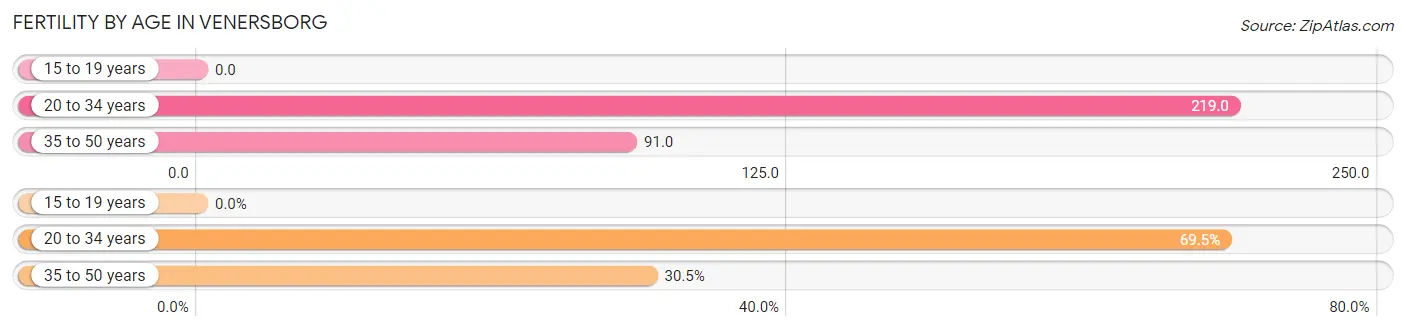
| Age Bracket | Women with Births | Births / 1,000 Women |
| 15 to 19 years | 0 (0.0%) | 0.0 |
| 20 to 34 years | 82 (69.5%) | 219.0 |
| 35 to 50 years | 36 (30.5%) | 91.0 |
| Total | 118 (100.0%) | 133.0 |
Fertility by Age by Marriage Status in Venersborg
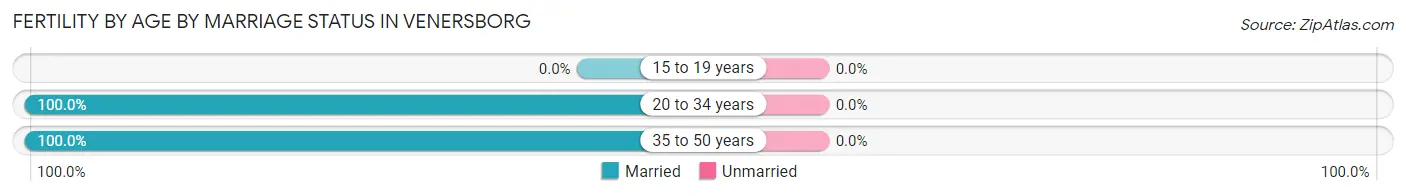
| Age Bracket | Married | Unmarried |
| 15 to 19 years | 0 (0.0%) | 0 (0.0%) |
| 20 to 34 years | 82 (100.0%) | 0 (0.0%) |
| 35 to 50 years | 36 (100.0%) | 0 (0.0%) |
| Total | 118 (100.0%) | 0 (0.0%) |
Fertility by Education in Venersborg
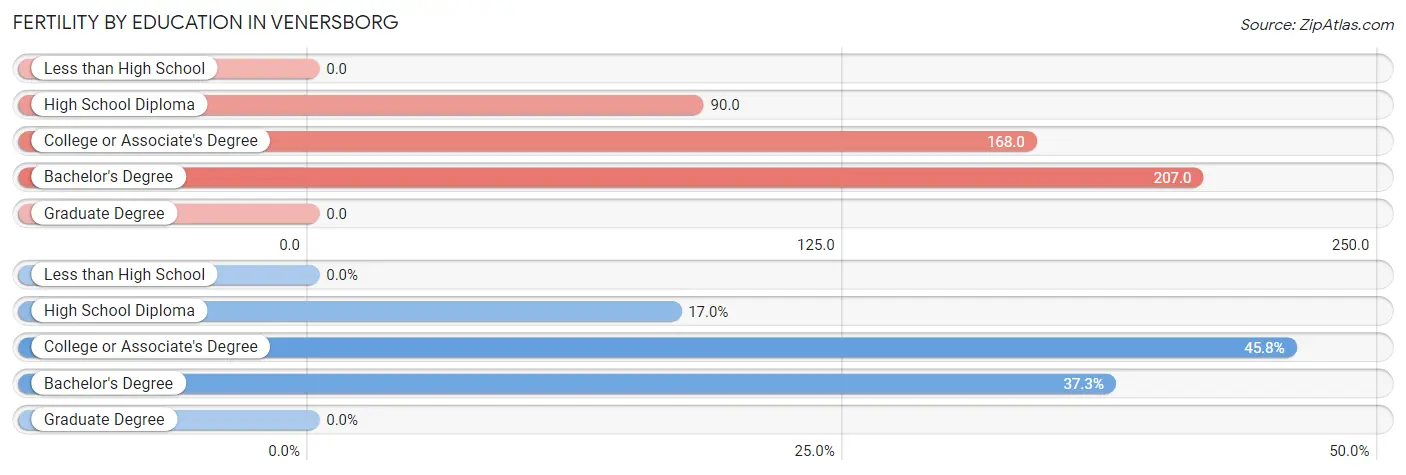
| Educational Attainment | Women with Births | Births / 1,000 Women |
| Less than High School | 0 (0.0%) | 0.0 |
| High School Diploma | 20 (17.0%) | 90.0 |
| College or Associate's Degree | 54 (45.8%) | 168.0 |
| Bachelor's Degree | 44 (37.3%) | 207.0 |
| Graduate Degree | 0 (0.0%) | 0.0 |
| Total | 118 (100.0%) | 133.0 |
Fertility by Education by Marriage Status in Venersborg
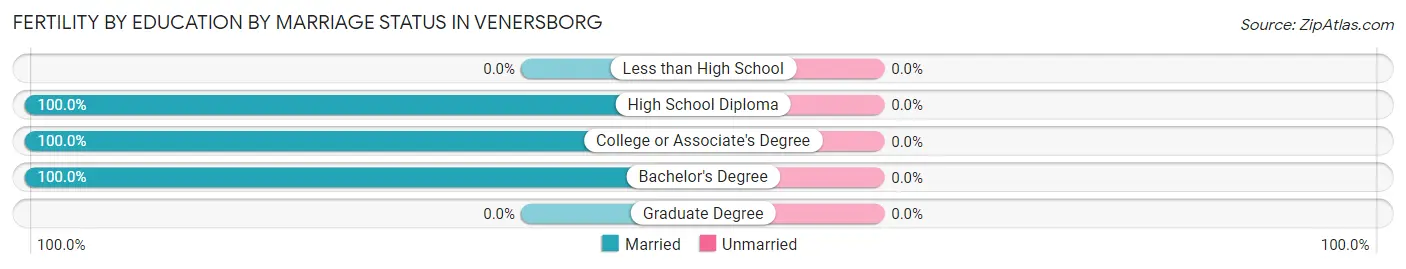
| Educational Attainment | Married | Unmarried |
| Less than High School | 0 (0.0%) | 0 (0.0%) |
| High School Diploma | 20 (100.0%) | 0 (0.0%) |
| College or Associate's Degree | 54 (100.0%) | 0 (0.0%) |
| Bachelor's Degree | 44 (100.0%) | 0 (0.0%) |
| Graduate Degree | 0 (0.0%) | 0 (0.0%) |
| Total | 118 (100.0%) | 0 (0.0%) |
Employment Characteristics in Venersborg
Employment by Class of Employer in Venersborg
Among the 1,758 employed individuals in Venersborg, private company employees (1,070 | 60.9%), local government employees (291 | 16.6%), and not-for-profit organizations (217 | 12.3%) make up the most common classes of employment.
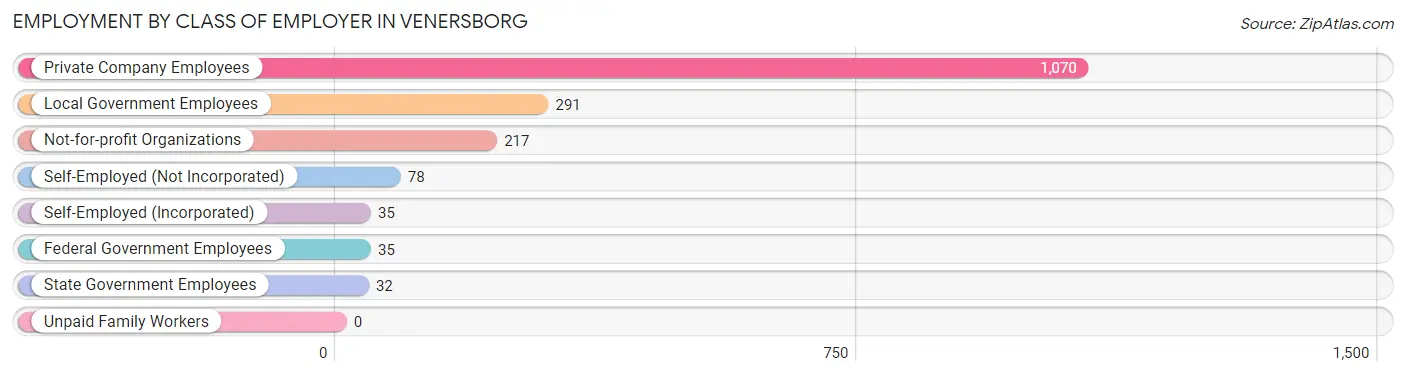
| Employer Class | # Employees | % Employees |
| Private Company Employees | 1,070 | 60.9% |
| Self-Employed (Incorporated) | 35 | 2.0% |
| Self-Employed (Not Incorporated) | 78 | 4.4% |
| Not-for-profit Organizations | 217 | 12.3% |
| Local Government Employees | 291 | 16.6% |
| State Government Employees | 32 | 1.8% |
| Federal Government Employees | 35 | 2.0% |
| Unpaid Family Workers | 0 | 0.0% |
| Total | 1,758 | 100.0% |
Employment Status by Age in Venersborg
According to the labor force statistics for Venersborg, out of the total population over 16 years of age (3,296), 58.6% or 1,931 individuals are in the labor force, with 5.1% or 98 of them unemployed. The age group with the highest labor force participation rate is 25 to 29 years, with 100.0% or 131 individuals in the labor force. Within the labor force, the 35 to 44 years age range has the highest percentage of unemployed individuals, with 14.9% or 56 of them being unemployed.
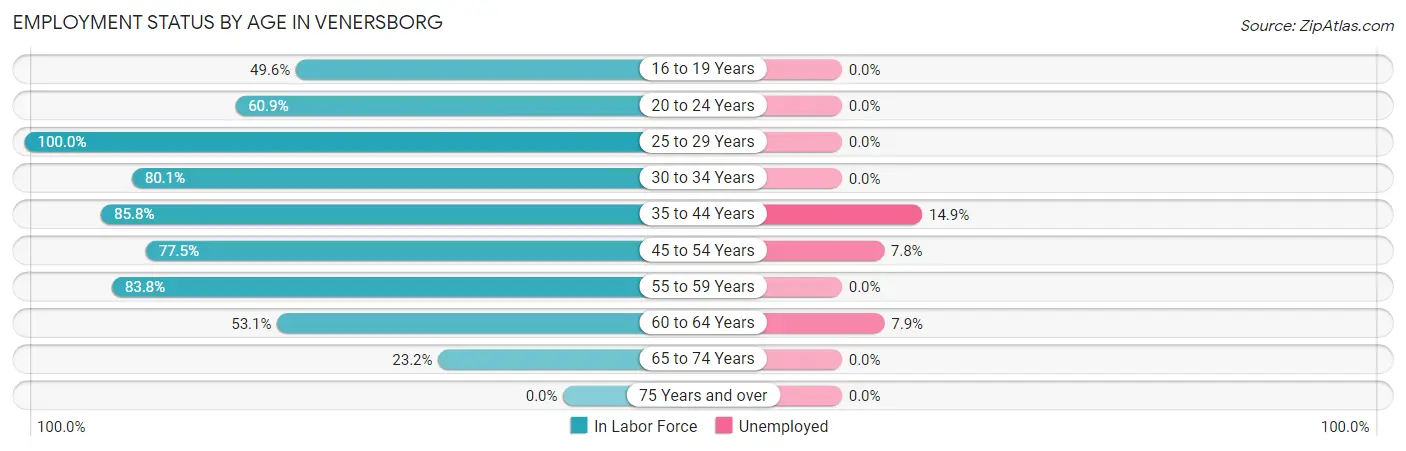
| Age Bracket | In Labor Force | Unemployed |
| 16 to 19 Years | 126 (49.6%) | 0 (0.0%) |
| 20 to 24 Years | 126 (60.9%) | 0 (0.0%) |
| 25 to 29 Years | 131 (100.0%) | 0 (0.0%) |
| 30 to 34 Years | 185 (80.1%) | 0 (0.0%) |
| 35 to 44 Years | 376 (85.8%) | 56 (14.9%) |
| 45 to 54 Years | 410 (77.5%) | 32 (7.8%) |
| 55 to 59 Years | 305 (83.8%) | 0 (0.0%) |
| 60 to 64 Years | 139 (53.1%) | 11 (7.9%) |
| 65 to 74 Years | 135 (23.2%) | 0 (0.0%) |
| 75 Years and over | 0 (0.0%) | 0 (0.0%) |
| Total | 1,931 (58.6%) | 98 (5.1%) |
Employment Status by Educational Attainment in Venersborg
According to labor force statistics for Venersborg, 79.1% of individuals (1,546) out of the total population between 25 and 64 years of age (1,955) are in the labor force, with 6.4% or 99 of them being unemployed. The group with the highest labor force participation rate are those with the educational attainment of less than high school, with 100.0% or 63 individuals in the labor force. Within the labor force, individuals with high school diploma education have the highest percentage of unemployment, with 11.6% or 33 of them being unemployed.
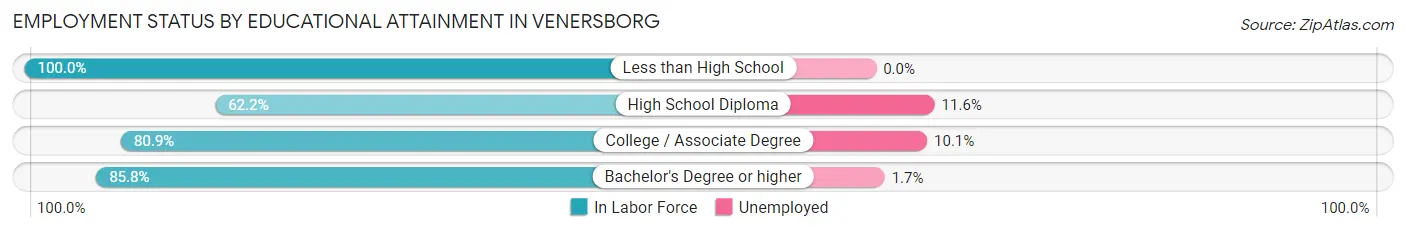
| Educational Attainment | In Labor Force | Unemployed |
| Less than High School | 63 (100.0%) | 0 (0.0%) |
| High School Diploma | 283 (62.2%) | 53 (11.6%) |
| College / Associate Degree | 552 (80.9%) | 69 (10.1%) |
| Bachelor's Degree or higher | 648 (85.8%) | 13 (1.7%) |
| Total | 1,546 (79.1%) | 125 (6.4%) |
Employment Occupations by Sex in Venersborg
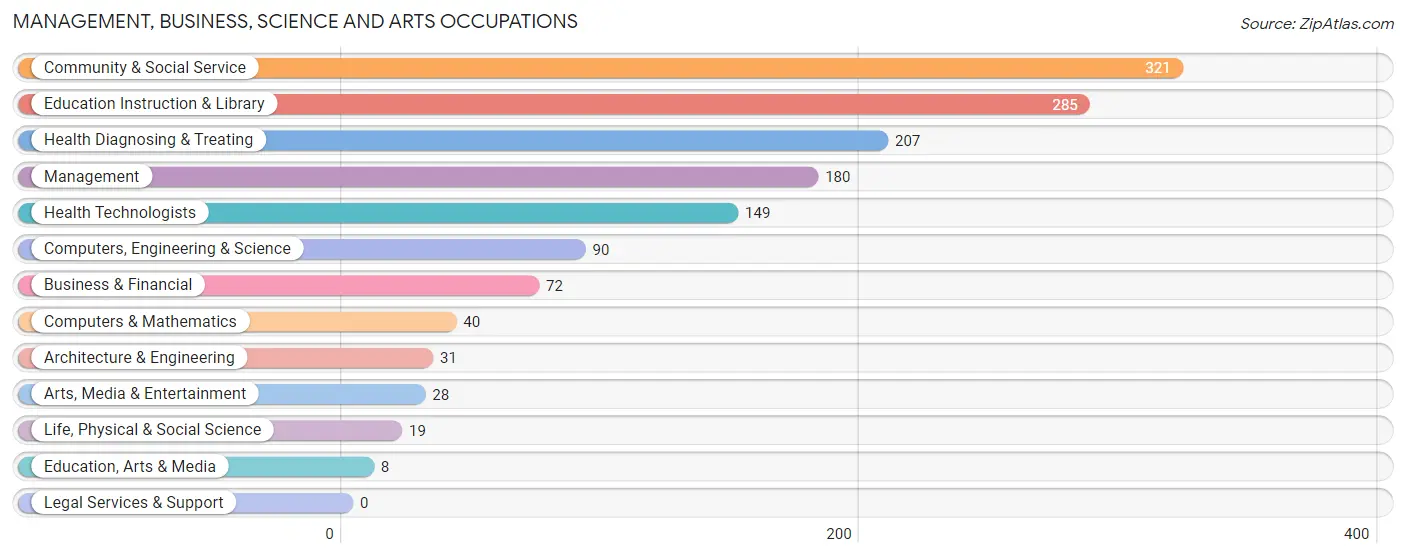
Management, Business, Science and Arts Occupations
The most common Management, Business, Science and Arts occupations in Venersborg are Community & Social Service (321 | 17.6%), Education Instruction & Library (285 | 15.6%), Health Diagnosing & Treating (207 | 11.3%), Management (180 | 9.9%), and Health Technologists (149 | 8.2%).
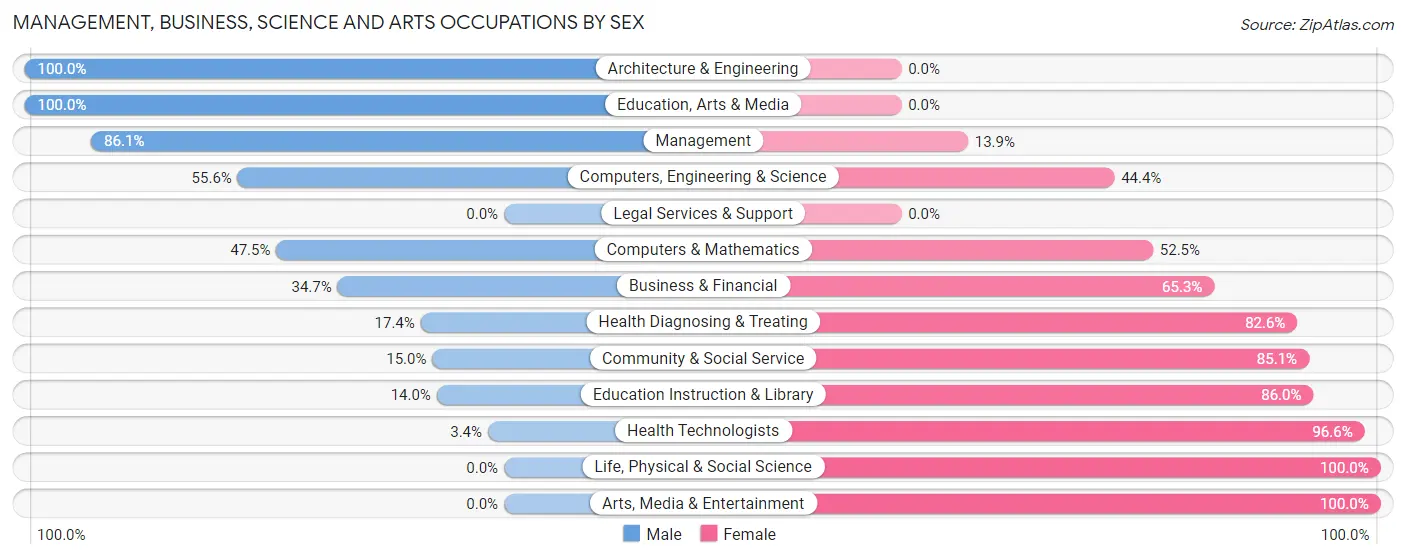
Management, Business, Science and Arts Occupations by Sex
Within the Management, Business, Science and Arts occupations in Venersborg, the most male-oriented occupations are Architecture & Engineering (100.0%), Education, Arts & Media (100.0%), and Management (86.1%), while the most female-oriented occupations are Life, Physical & Social Science (100.0%), Arts, Media & Entertainment (100.0%), and Health Technologists (96.6%).
| Occupation | Male | Female |
| Management | 155 (86.1%) | 25 (13.9%) |
| Business & Financial | 25 (34.7%) | 47 (65.3%) |
| Computers, Engineering & Science | 50 (55.6%) | 40 (44.4%) |
| Computers & Mathematics | 19 (47.5%) | 21 (52.5%) |
| Architecture & Engineering | 31 (100.0%) | 0 (0.0%) |
| Life, Physical & Social Science | 0 (0.0%) | 19 (100.0%) |
| Community & Social Service | 48 (14.9%) | 273 (85.1%) |
| Education, Arts & Media | 8 (100.0%) | 0 (0.0%) |
| Legal Services & Support | 0 (0.0%) | 0 (0.0%) |
| Education Instruction & Library | 40 (14.0%) | 245 (86.0%) |
| Arts, Media & Entertainment | 0 (0.0%) | 28 (100.0%) |
| Health Diagnosing & Treating | 36 (17.4%) | 171 (82.6%) |
| Health Technologists | 5 (3.4%) | 144 (96.6%) |
| Total (Category) | 314 (36.1%) | 556 (63.9%) |
| Total (Overall) | 931 (51.0%) | 896 (49.0%) |
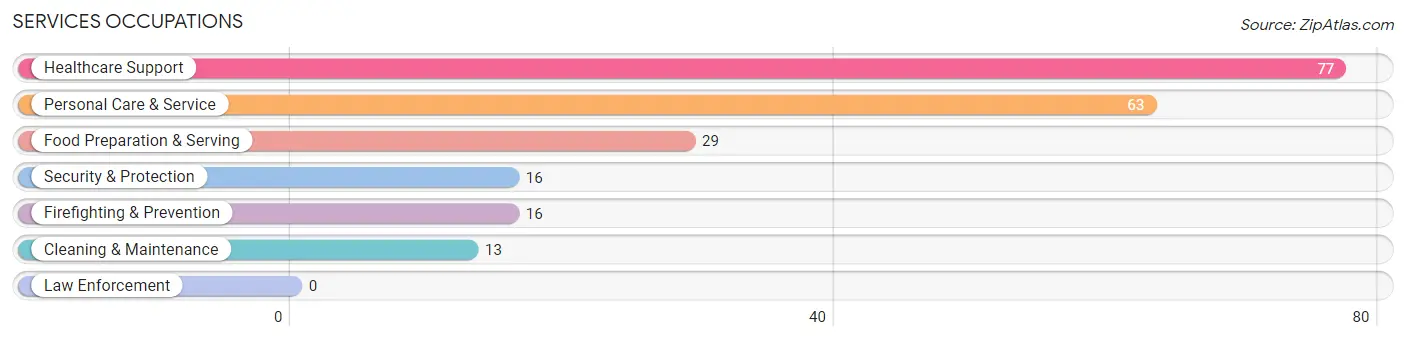
Services Occupations
The most common Services occupations in Venersborg are Healthcare Support (77 | 4.2%), Personal Care & Service (63 | 3.5%), Food Preparation & Serving (29 | 1.6%), Security & Protection (16 | 0.9%), and Firefighting & Prevention (16 | 0.9%).
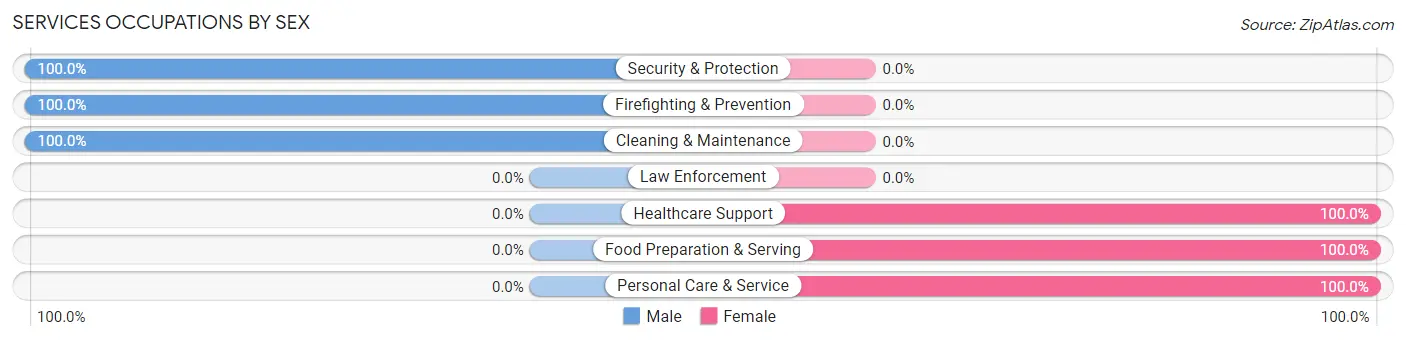
Services Occupations by Sex
Within the Services occupations in Venersborg, the most male-oriented occupations are Security & Protection (100.0%), Firefighting & Prevention (100.0%), and Cleaning & Maintenance (100.0%), while the most female-oriented occupations are Healthcare Support (100.0%), Food Preparation & Serving (100.0%), and Personal Care & Service (100.0%).
| Occupation | Male | Female |
| Healthcare Support | 0 (0.0%) | 77 (100.0%) |
| Security & Protection | 16 (100.0%) | 0 (0.0%) |
| Firefighting & Prevention | 16 (100.0%) | 0 (0.0%) |
| Law Enforcement | 0 (0.0%) | 0 (0.0%) |
| Food Preparation & Serving | 0 (0.0%) | 29 (100.0%) |
| Cleaning & Maintenance | 13 (100.0%) | 0 (0.0%) |
| Personal Care & Service | 0 (0.0%) | 63 (100.0%) |
| Total (Category) | 29 (14.6%) | 169 (85.4%) |
| Total (Overall) | 931 (51.0%) | 896 (49.0%) |
Sales and Office Occupations
The most common Sales and Office occupations in Venersborg are Sales & Related (200 | 11.0%), and Office & Administration (89 | 4.9%).
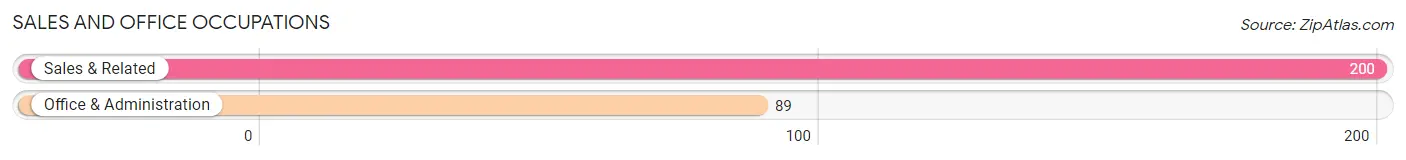
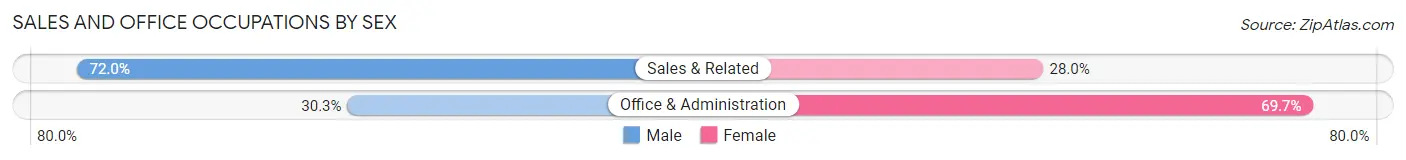
Sales and Office Occupations by Sex
| Occupation | Male | Female |
| Sales & Related | 144 (72.0%) | 56 (28.0%) |
| Office & Administration | 27 (30.3%) | 62 (69.7%) |
| Total (Category) | 171 (59.2%) | 118 (40.8%) |
| Total (Overall) | 931 (51.0%) | 896 (49.0%) |
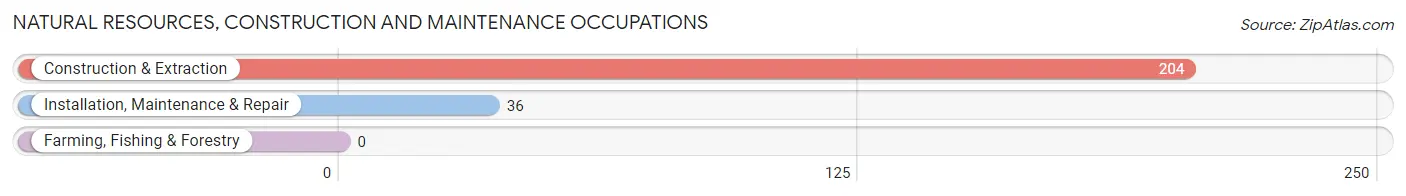
Natural Resources, Construction and Maintenance Occupations
The most common Natural Resources, Construction and Maintenance occupations in Venersborg are Construction & Extraction (204 | 11.2%), and Installation, Maintenance & Repair (36 | 2.0%).
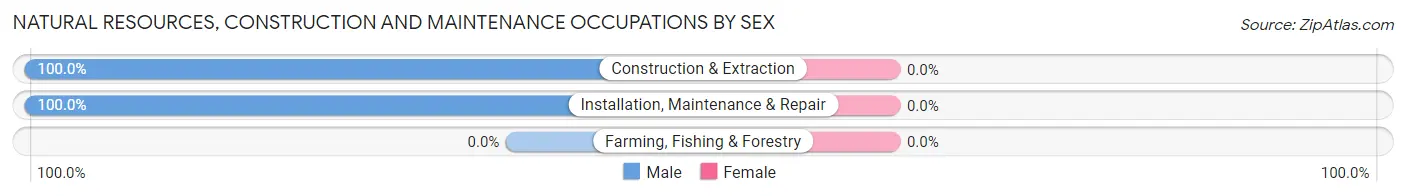
Natural Resources, Construction and Maintenance Occupations by Sex
| Occupation | Male | Female |
| Farming, Fishing & Forestry | 0 (0.0%) | 0 (0.0%) |
| Construction & Extraction | 204 (100.0%) | 0 (0.0%) |
| Installation, Maintenance & Repair | 36 (100.0%) | 0 (0.0%) |
| Total (Category) | 240 (100.0%) | 0 (0.0%) |
| Total (Overall) | 931 (51.0%) | 896 (49.0%) |
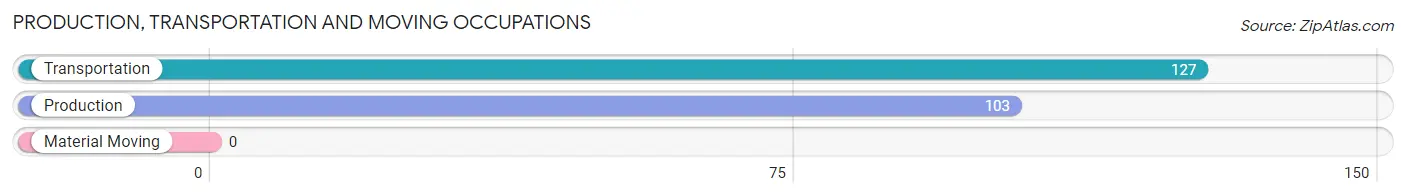
Production, Transportation and Moving Occupations
The most common Production, Transportation and Moving occupations in Venersborg are Transportation (127 | 7.0%), and Production (103 | 5.6%).
Production, Transportation and Moving Occupations by Sex
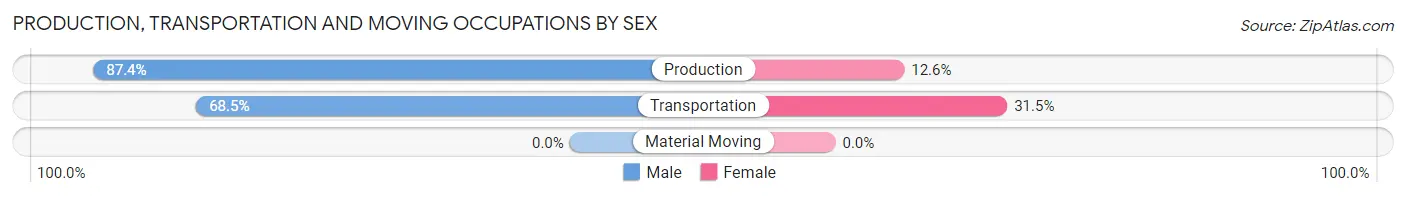
| Occupation | Male | Female |
| Production | 90 (87.4%) | 13 (12.6%) |
| Transportation | 87 (68.5%) | 40 (31.5%) |
| Material Moving | 0 (0.0%) | 0 (0.0%) |
| Total (Category) | 177 (77.0%) | 53 (23.0%) |
| Total (Overall) | 931 (51.0%) | 896 (49.0%) |
Employment Industries by Sex in Venersborg
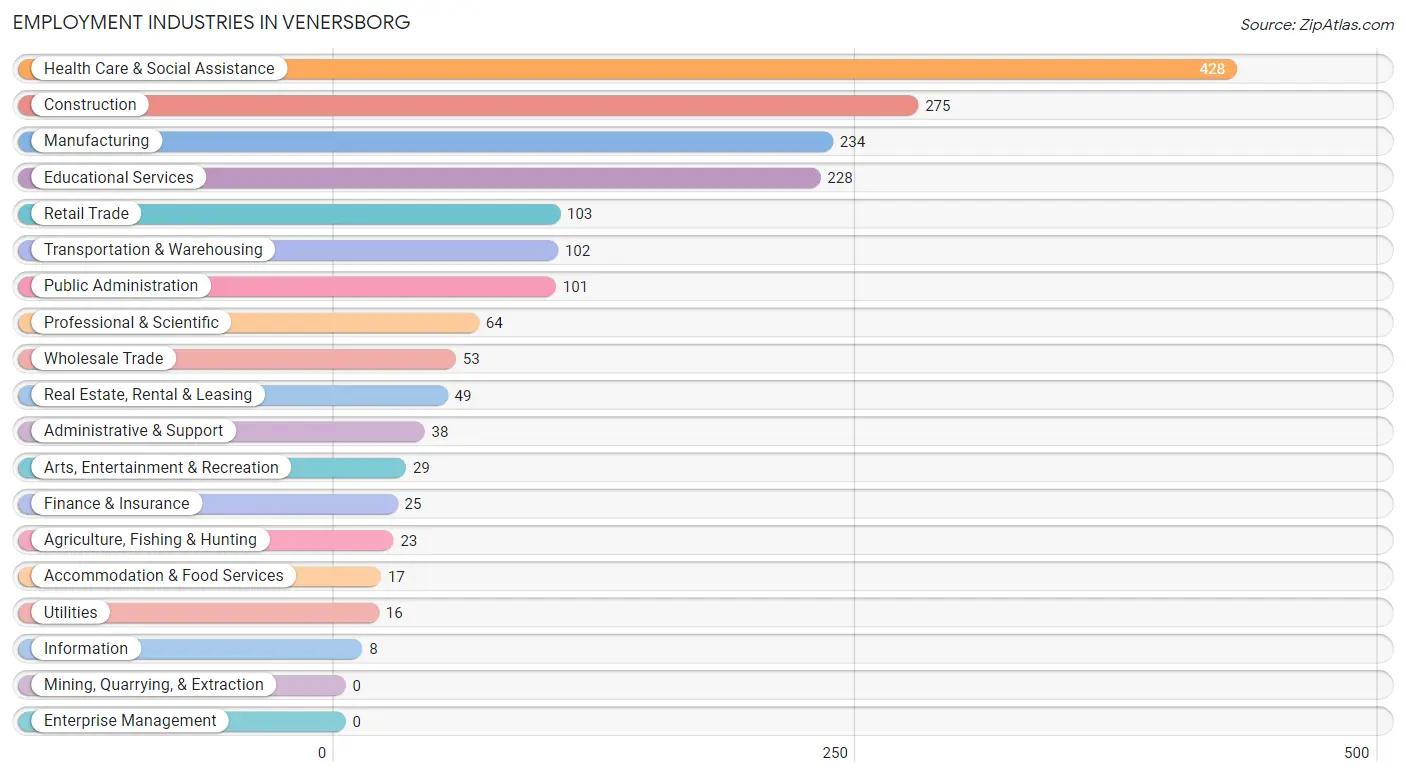
Employment Industries in Venersborg
The major employment industries in Venersborg include Health Care & Social Assistance (428 | 23.4%), Construction (275 | 15.0%), Manufacturing (234 | 12.8%), Educational Services (228 | 12.5%), and Retail Trade (103 | 5.6%).
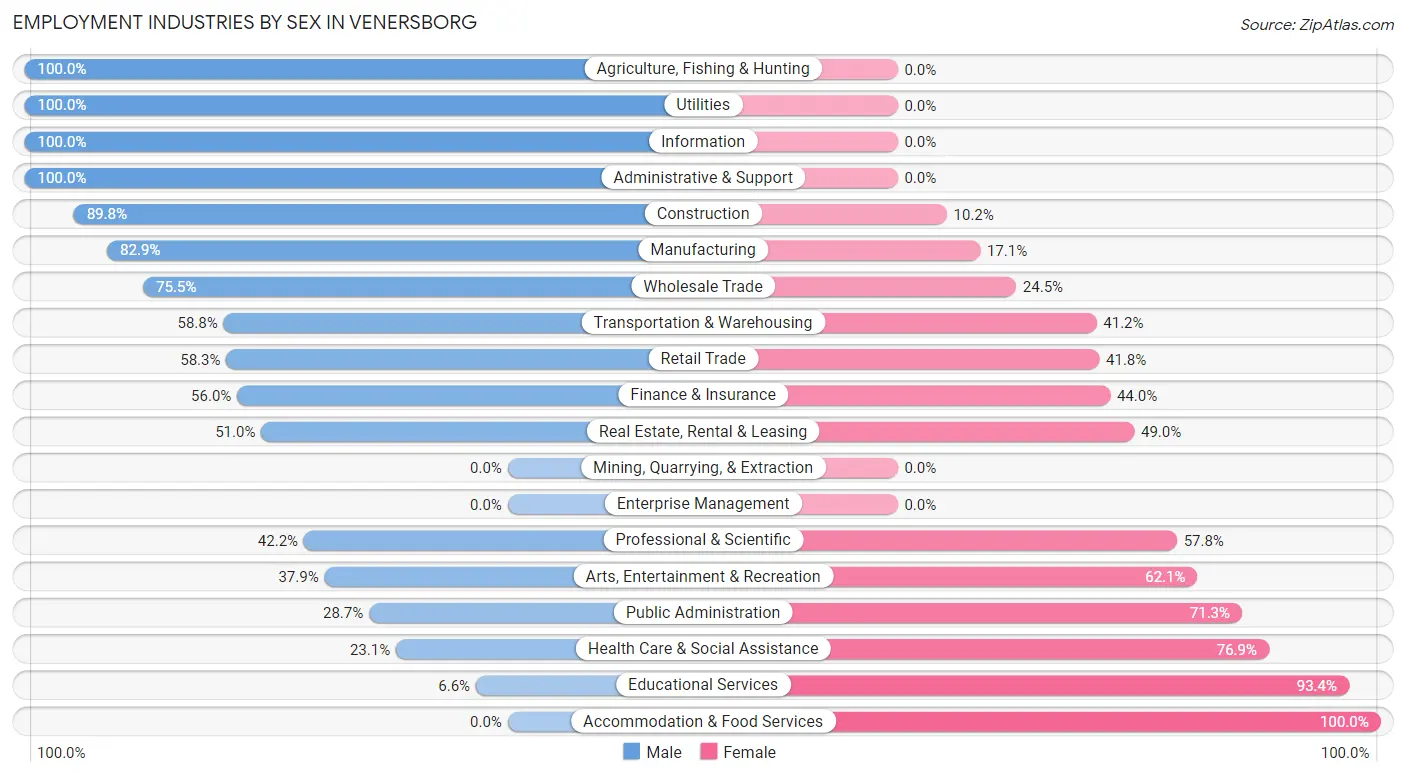
Employment Industries by Sex in Venersborg
The Venersborg industries that see more men than women are Agriculture, Fishing & Hunting (100.0%), Utilities (100.0%), and Information (100.0%), whereas the industries that tend to have a higher number of women are Accommodation & Food Services (100.0%), Educational Services (93.4%), and Health Care & Social Assistance (76.9%).
| Industry | Male | Female |
| Agriculture, Fishing & Hunting | 23 (100.0%) | 0 (0.0%) |
| Mining, Quarrying, & Extraction | 0 (0.0%) | 0 (0.0%) |
| Construction | 247 (89.8%) | 28 (10.2%) |
| Manufacturing | 194 (82.9%) | 40 (17.1%) |
| Wholesale Trade | 40 (75.5%) | 13 (24.5%) |
| Retail Trade | 60 (58.3%) | 43 (41.7%) |
| Transportation & Warehousing | 60 (58.8%) | 42 (41.2%) |
| Utilities | 16 (100.0%) | 0 (0.0%) |
| Information | 8 (100.0%) | 0 (0.0%) |
| Finance & Insurance | 14 (56.0%) | 11 (44.0%) |
| Real Estate, Rental & Leasing | 25 (51.0%) | 24 (49.0%) |
| Professional & Scientific | 27 (42.2%) | 37 (57.8%) |
| Enterprise Management | 0 (0.0%) | 0 (0.0%) |
| Administrative & Support | 38 (100.0%) | 0 (0.0%) |
| Educational Services | 15 (6.6%) | 213 (93.4%) |
| Health Care & Social Assistance | 99 (23.1%) | 329 (76.9%) |
| Arts, Entertainment & Recreation | 11 (37.9%) | 18 (62.1%) |
| Accommodation & Food Services | 0 (0.0%) | 17 (100.0%) |
| Public Administration | 29 (28.7%) | 72 (71.3%) |
| Total | 931 (51.0%) | 896 (49.0%) |
Education in Venersborg
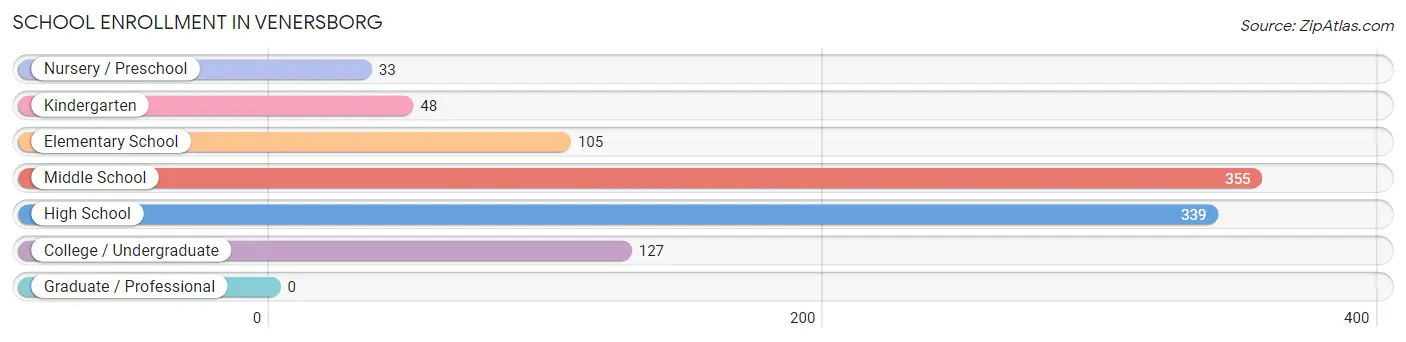
School Enrollment in Venersborg
The most common levels of schooling among the 1,007 students in Venersborg are middle school (355 | 35.2%), high school (339 | 33.7%), and college / undergraduate (127 | 12.6%).
| School Level | # Students | % Students |
| Nursery / Preschool | 33 | 3.3% |
| Kindergarten | 48 | 4.8% |
| Elementary School | 105 | 10.4% |
| Middle School | 355 | 35.2% |
| High School | 339 | 33.7% |
| College / Undergraduate | 127 | 12.6% |
| Graduate / Professional | 0 | 0.0% |
| Total | 1,007 | 100.0% |
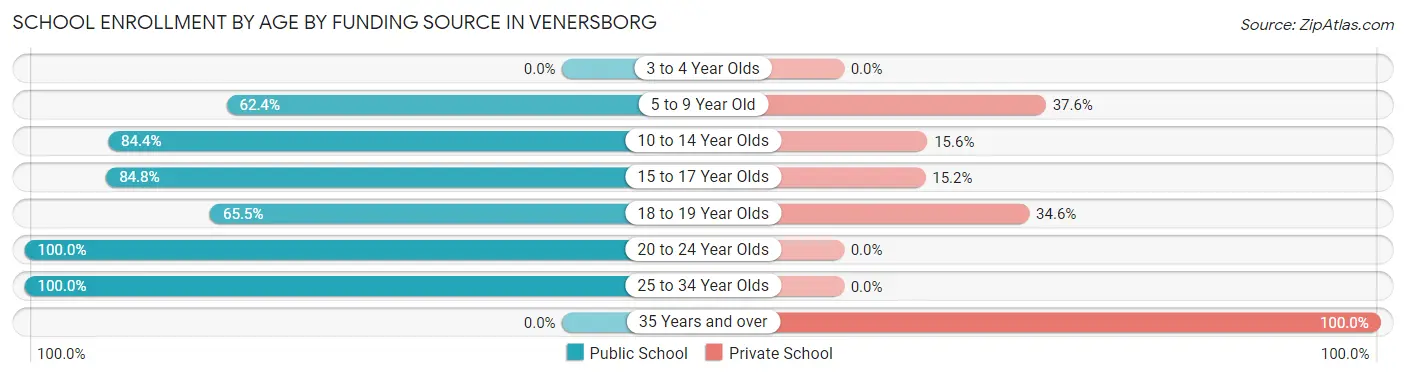
School Enrollment by Age by Funding Source in Venersborg
Out of a total of 1,007 students who are enrolled in schools in Venersborg, 224 (22.2%) attend a private institution, while the remaining 783 (77.8%) are enrolled in public schools. The age group of 35 years and over has the highest likelihood of being enrolled in private schools, with 32 (100.0% in the age bracket) enrolled. Conversely, the age group of 20 to 24 year olds has the lowest likelihood of being enrolled in a private school, with 47 (100.0% in the age bracket) attending a public institution.
| Age Bracket | Public School | Private School |
| 3 to 4 Year Olds | 0 (0.0%) | 0 (0.0%) |
| 5 to 9 Year Old | 116 (62.4%) | 70 (37.6%) |
| 10 to 14 Year Olds | 380 (84.4%) | 70 (15.6%) |
| 15 to 17 Year Olds | 184 (84.8%) | 33 (15.2%) |
| 18 to 19 Year Olds | 36 (65.4%) | 19 (34.5%) |
| 20 to 24 Year Olds | 47 (100.0%) | 0 (0.0%) |
| 25 to 34 Year Olds | 20 (100.0%) | 0 (0.0%) |
| 35 Years and over | 0 (0.0%) | 32 (100.0%) |
| Total | 783 (77.8%) | 224 (22.2%) |
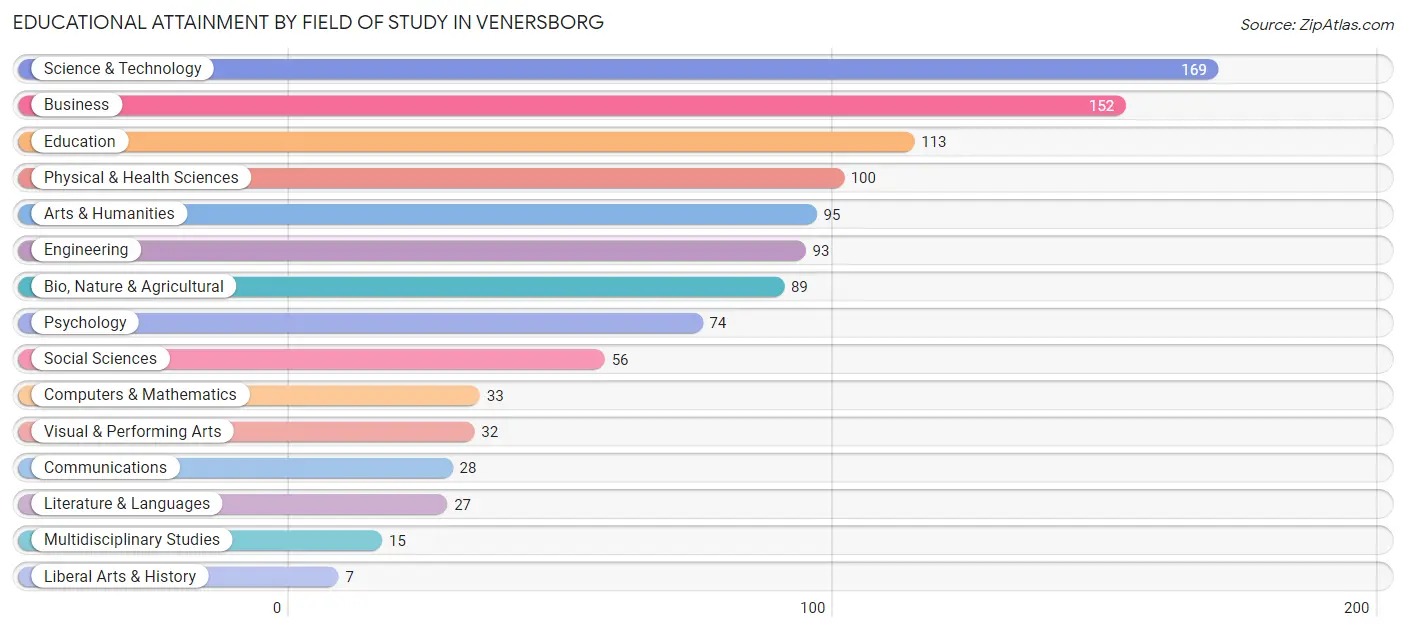
Educational Attainment by Field of Study in Venersborg
Science & technology (169 | 15.6%), business (152 | 14.0%), education (113 | 10.4%), physical & health sciences (100 | 9.2%), and arts & humanities (95 | 8.8%) are the most common fields of study among 1,083 individuals in Venersborg who have obtained a bachelor's degree or higher.
| Field of Study | # Graduates | % Graduates |
| Computers & Mathematics | 33 | 3.0% |
| Bio, Nature & Agricultural | 89 | 8.2% |
| Physical & Health Sciences | 100 | 9.2% |
| Psychology | 74 | 6.8% |
| Social Sciences | 56 | 5.2% |
| Engineering | 93 | 8.6% |
| Multidisciplinary Studies | 15 | 1.4% |
| Science & Technology | 169 | 15.6% |
| Business | 152 | 14.0% |
| Education | 113 | 10.4% |
| Literature & Languages | 27 | 2.5% |
| Liberal Arts & History | 7 | 0.6% |
| Visual & Performing Arts | 32 | 2.9% |
| Communications | 28 | 2.6% |
| Arts & Humanities | 95 | 8.8% |
| Total | 1,083 | 100.0% |
Transportation & Commute in Venersborg
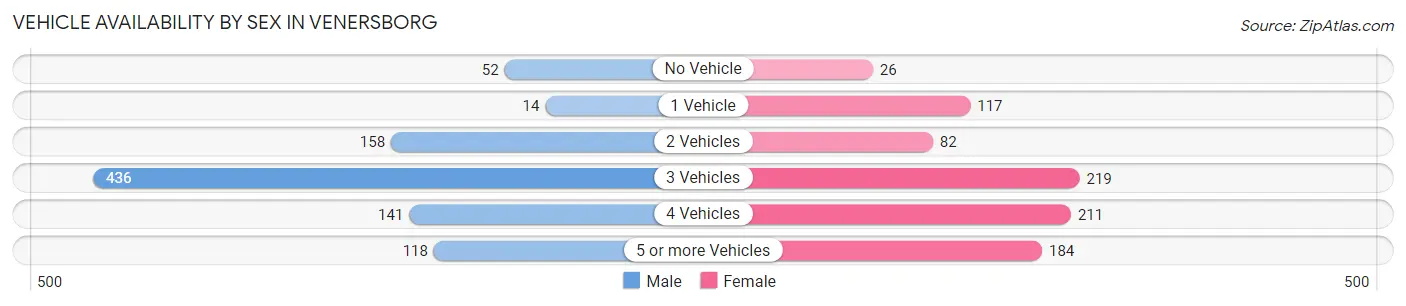
Vehicle Availability by Sex in Venersborg
The most prevalent vehicle ownership categories in Venersborg are males with 3 vehicles (436, accounting for 47.4%) and females with 3 vehicles (219, making up 52.0%).
| Vehicles Available | Male | Female |
| No Vehicle | 52 (5.7%) | 26 (3.1%) |
| 1 Vehicle | 14 (1.5%) | 117 (14.0%) |
| 2 Vehicles | 158 (17.2%) | 82 (9.8%) |
| 3 Vehicles | 436 (47.4%) | 219 (26.1%) |
| 4 Vehicles | 141 (15.3%) | 211 (25.2%) |
| 5 or more Vehicles | 118 (12.8%) | 184 (21.9%) |
| Total | 919 (100.0%) | 839 (100.0%) |
Commute Time in Venersborg
The most frequently occuring commute durations in Venersborg are 30 to 34 minutes (317 commuters, 20.6%), 25 to 29 minutes (271 commuters, 17.6%), and 60 to 89 minutes (177 commuters, 11.5%).
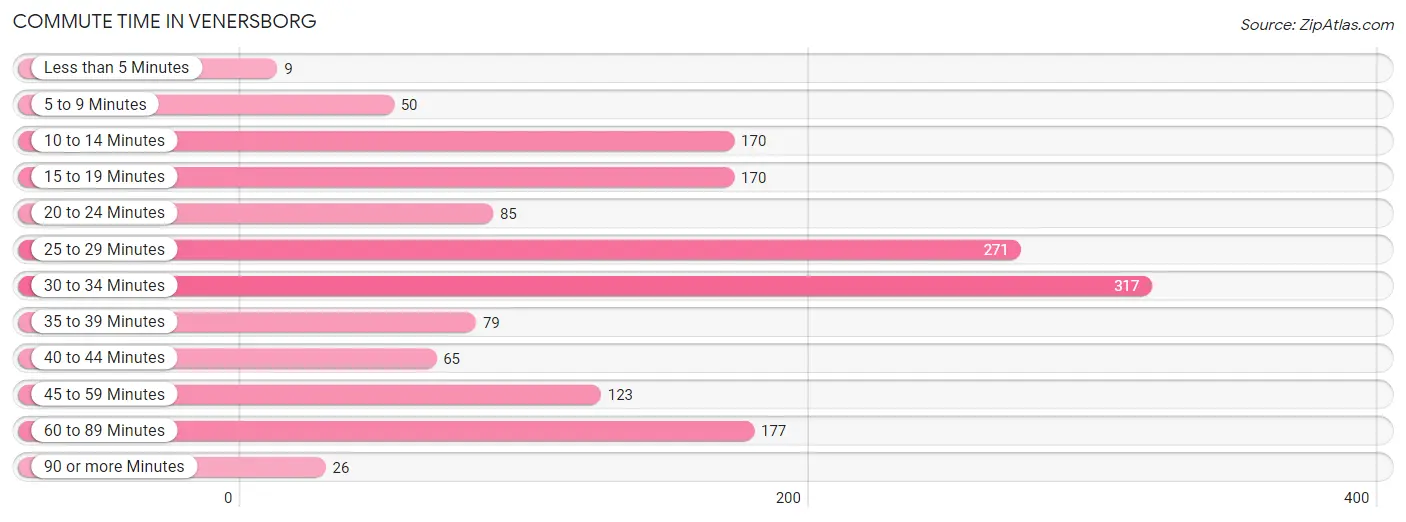
| Commute Time | # Commuters | % Commuters |
| Less than 5 Minutes | 9 | 0.6% |
| 5 to 9 Minutes | 50 | 3.2% |
| 10 to 14 Minutes | 170 | 11.0% |
| 15 to 19 Minutes | 170 | 11.0% |
| 20 to 24 Minutes | 85 | 5.5% |
| 25 to 29 Minutes | 271 | 17.6% |
| 30 to 34 Minutes | 317 | 20.6% |
| 35 to 39 Minutes | 79 | 5.1% |
| 40 to 44 Minutes | 65 | 4.2% |
| 45 to 59 Minutes | 123 | 8.0% |
| 60 to 89 Minutes | 177 | 11.5% |
| 90 or more Minutes | 26 | 1.7% |
Commute Time by Sex in Venersborg
The most common commute times in Venersborg are 30 to 34 minutes (155 commuters, 19.1%) for males and 30 to 34 minutes (162 commuters, 22.2%) for females.
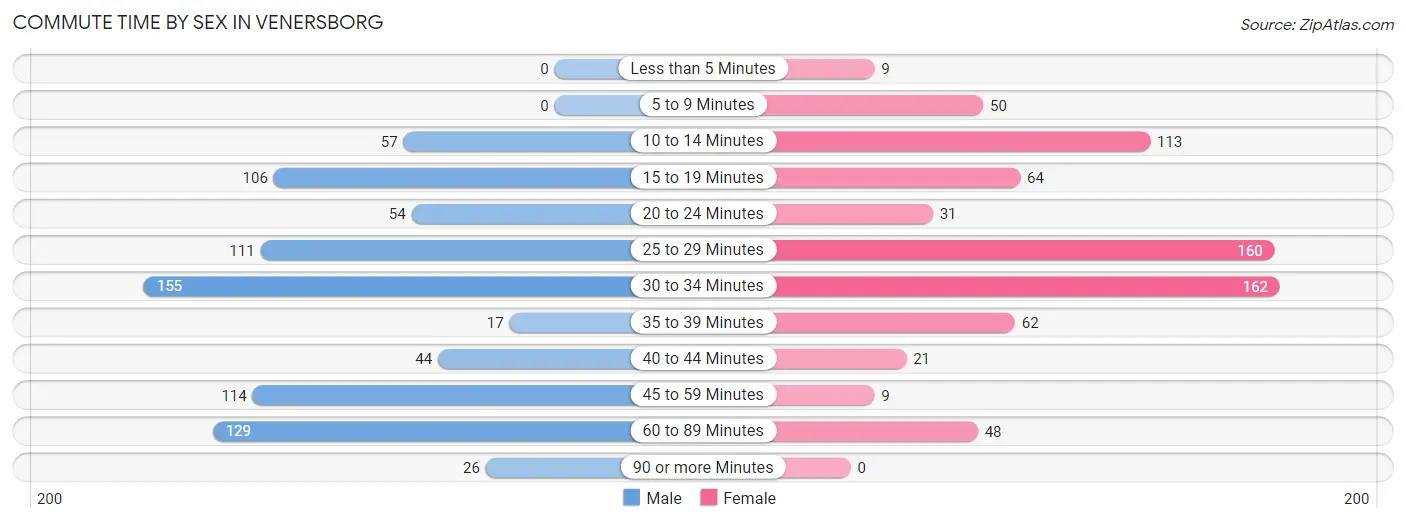
| Commute Time | Male | Female |
| Less than 5 Minutes | 0 (0.0%) | 9 (1.2%) |
| 5 to 9 Minutes | 0 (0.0%) | 50 (6.9%) |
| 10 to 14 Minutes | 57 (7.0%) | 113 (15.5%) |
| 15 to 19 Minutes | 106 (13.0%) | 64 (8.8%) |
| 20 to 24 Minutes | 54 (6.6%) | 31 (4.3%) |
| 25 to 29 Minutes | 111 (13.7%) | 160 (22.0%) |
| 30 to 34 Minutes | 155 (19.1%) | 162 (22.2%) |
| 35 to 39 Minutes | 17 (2.1%) | 62 (8.5%) |
| 40 to 44 Minutes | 44 (5.4%) | 21 (2.9%) |
| 45 to 59 Minutes | 114 (14.0%) | 9 (1.2%) |
| 60 to 89 Minutes | 129 (15.9%) | 48 (6.6%) |
| 90 or more Minutes | 26 (3.2%) | 0 (0.0%) |
Time of Departure to Work by Sex in Venersborg
The most frequent times of departure to work in Venersborg are 5:30 AM to 5:59 AM (145, 17.8%) for males and 7:00 AM to 7:29 AM (120, 16.5%) for females.
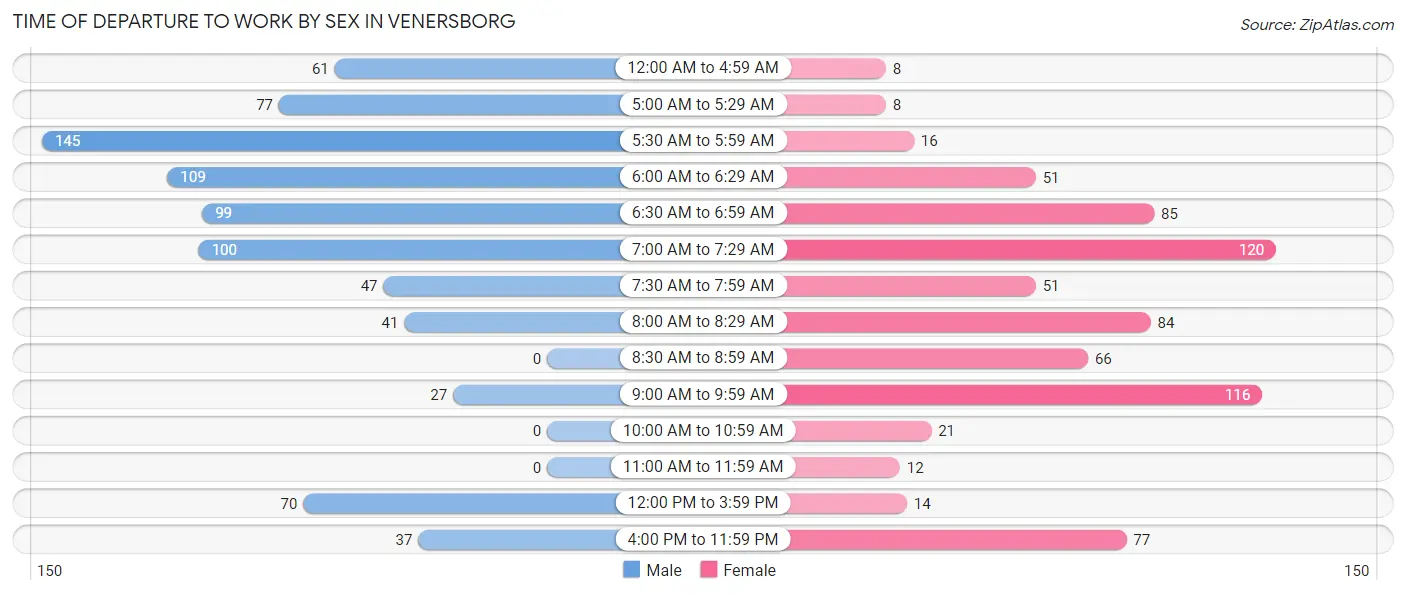
| Time of Departure | Male | Female |
| 12:00 AM to 4:59 AM | 61 (7.5%) | 8 (1.1%) |
| 5:00 AM to 5:29 AM | 77 (9.5%) | 8 (1.1%) |
| 5:30 AM to 5:59 AM | 145 (17.8%) | 16 (2.2%) |
| 6:00 AM to 6:29 AM | 109 (13.4%) | 51 (7.0%) |
| 6:30 AM to 6:59 AM | 99 (12.2%) | 85 (11.7%) |
| 7:00 AM to 7:29 AM | 100 (12.3%) | 120 (16.5%) |
| 7:30 AM to 7:59 AM | 47 (5.8%) | 51 (7.0%) |
| 8:00 AM to 8:29 AM | 41 (5.0%) | 84 (11.5%) |
| 8:30 AM to 8:59 AM | 0 (0.0%) | 66 (9.0%) |
| 9:00 AM to 9:59 AM | 27 (3.3%) | 116 (15.9%) |
| 10:00 AM to 10:59 AM | 0 (0.0%) | 21 (2.9%) |
| 11:00 AM to 11:59 AM | 0 (0.0%) | 12 (1.7%) |
| 12:00 PM to 3:59 PM | 70 (8.6%) | 14 (1.9%) |
| 4:00 PM to 11:59 PM | 37 (4.5%) | 77 (10.6%) |
| Total | 813 (100.0%) | 729 (100.0%) |
Housing Occupancy in Venersborg
Occupancy by Ownership in Venersborg
Of the total 1,349 dwellings in Venersborg, owner-occupied units account for 1,258 (93.2%), while renter-occupied units make up 91 (6.8%).
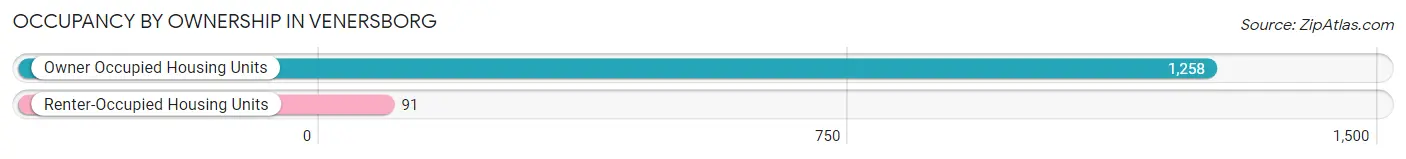
| Occupancy | # Housing Units | % Housing Units |
| Owner Occupied Housing Units | 1,258 | 93.2% |
| Renter-Occupied Housing Units | 91 | 6.8% |
| Total Occupied Housing Units | 1,349 | 100.0% |
Occupancy by Household Size in Venersborg
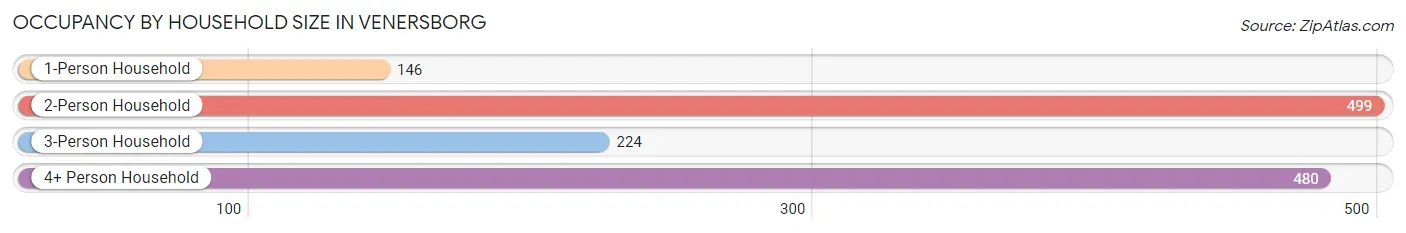
| Household Size | # Housing Units | % Housing Units |
| 1-Person Household | 146 | 10.8% |
| 2-Person Household | 499 | 37.0% |
| 3-Person Household | 224 | 16.6% |
| 4+ Person Household | 480 | 35.6% |
| Total Housing Units | 1,349 | 100.0% |
Occupancy by Ownership by Household Size in Venersborg
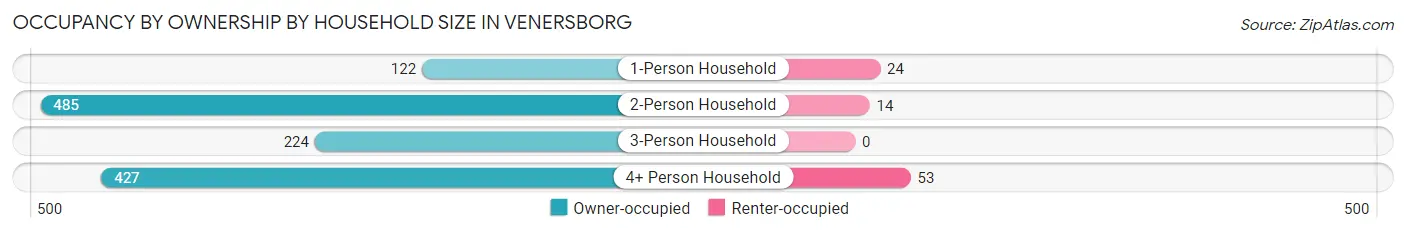
| Household Size | Owner-occupied | Renter-occupied |
| 1-Person Household | 122 (83.6%) | 24 (16.4%) |
| 2-Person Household | 485 (97.2%) | 14 (2.8%) |
| 3-Person Household | 224 (100.0%) | 0 (0.0%) |
| 4+ Person Household | 427 (89.0%) | 53 (11.0%) |
| Total Housing Units | 1,258 (93.2%) | 91 (6.8%) |
Occupancy by Educational Attainment in Venersborg
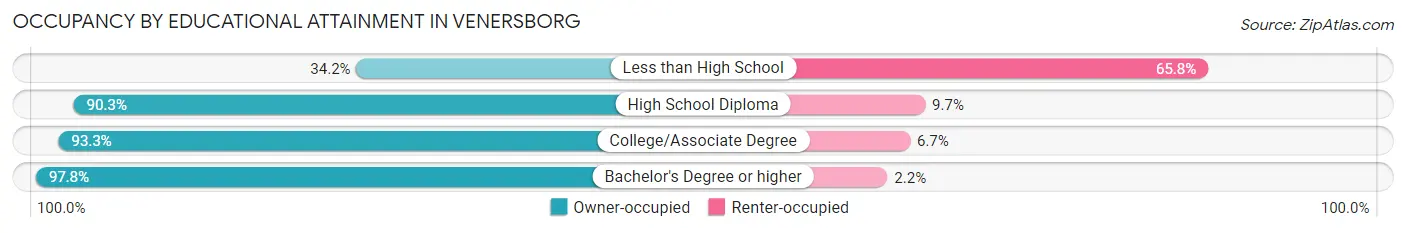
| Household Size | Owner-occupied | Renter-occupied |
| Less than High School | 13 (34.2%) | 25 (65.8%) |
| High School Diploma | 186 (90.3%) | 20 (9.7%) |
| College/Associate Degree | 445 (93.3%) | 32 (6.7%) |
| Bachelor's Degree or higher | 614 (97.8%) | 14 (2.2%) |
Occupancy by Age of Householder in Venersborg
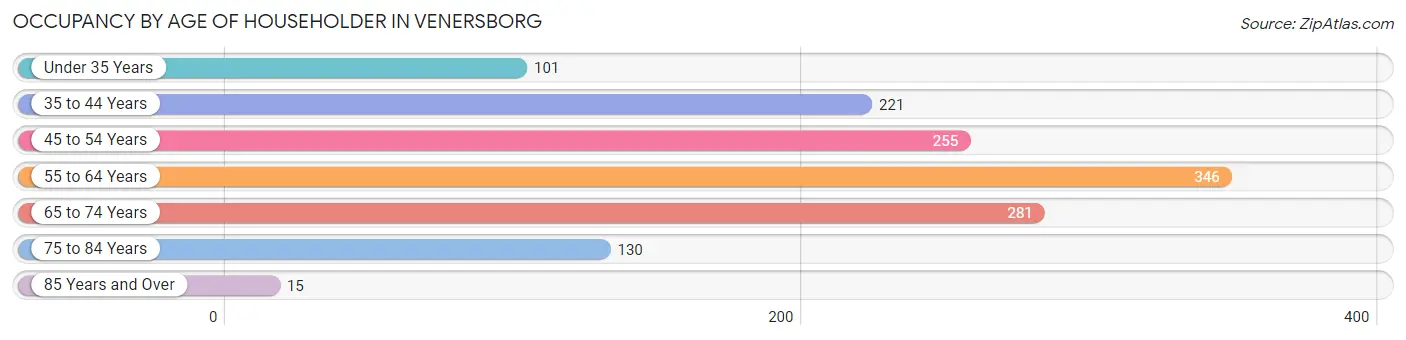
| Age Bracket | # Households | % Households |
| Under 35 Years | 101 | 7.5% |
| 35 to 44 Years | 221 | 16.4% |
| 45 to 54 Years | 255 | 18.9% |
| 55 to 64 Years | 346 | 25.7% |
| 65 to 74 Years | 281 | 20.8% |
| 75 to 84 Years | 130 | 9.6% |
| 85 Years and Over | 15 | 1.1% |
| Total | 1,349 | 100.0% |
Housing Finances in Venersborg
Median Income by Occupancy in Venersborg
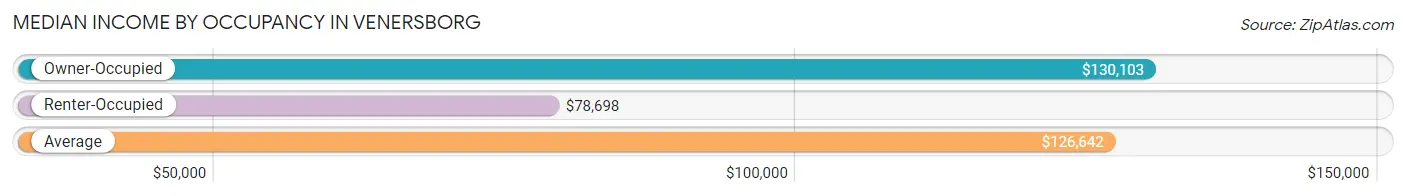
| Occupancy Type | # Households | Median Income |
| Owner-Occupied | 1,258 (93.2%) | $130,103 |
| Renter-Occupied | 91 (6.8%) | $78,698 |
| Average | 1,349 (100.0%) | $126,642 |
Occupancy by Householder Income Bracket in Venersborg
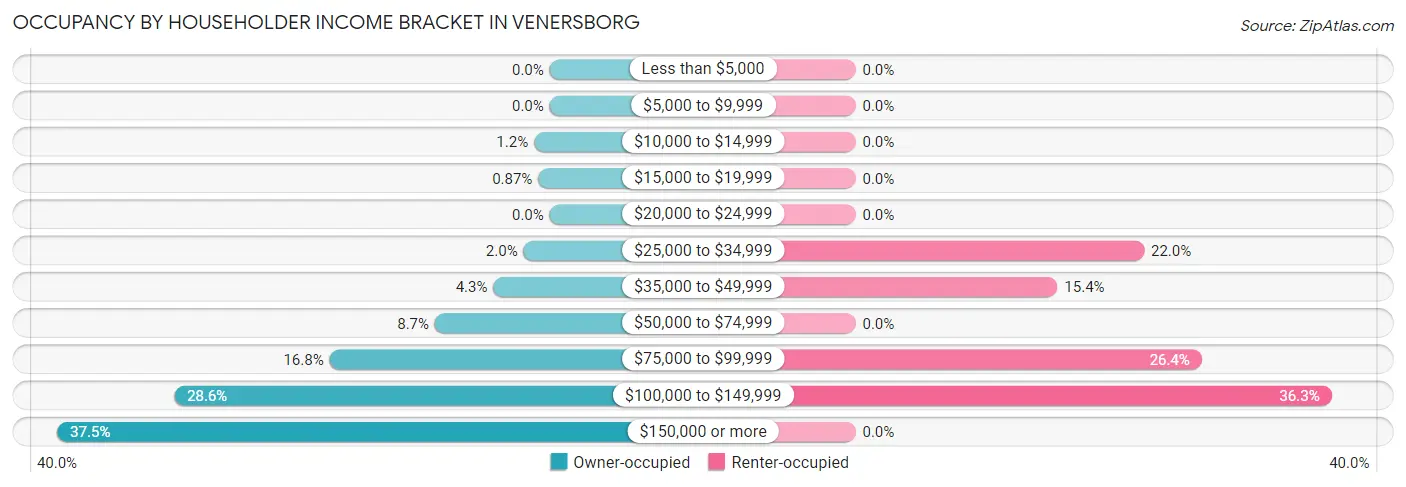
| Income Bracket | Owner-occupied | Renter-occupied |
| Less than $5,000 | 0 (0.0%) | 0 (0.0%) |
| $5,000 to $9,999 | 0 (0.0%) | 0 (0.0%) |
| $10,000 to $14,999 | 15 (1.2%) | 0 (0.0%) |
| $15,000 to $19,999 | 11 (0.9%) | 0 (0.0%) |
| $20,000 to $24,999 | 0 (0.0%) | 0 (0.0%) |
| $25,000 to $34,999 | 25 (2.0%) | 20 (22.0%) |
| $35,000 to $49,999 | 54 (4.3%) | 14 (15.4%) |
| $50,000 to $74,999 | 110 (8.7%) | 0 (0.0%) |
| $75,000 to $99,999 | 211 (16.8%) | 24 (26.4%) |
| $100,000 to $149,999 | 360 (28.6%) | 33 (36.3%) |
| $150,000 or more | 472 (37.5%) | 0 (0.0%) |
| Total | 1,258 (100.0%) | 91 (100.0%) |
Monthly Housing Cost Tiers in Venersborg
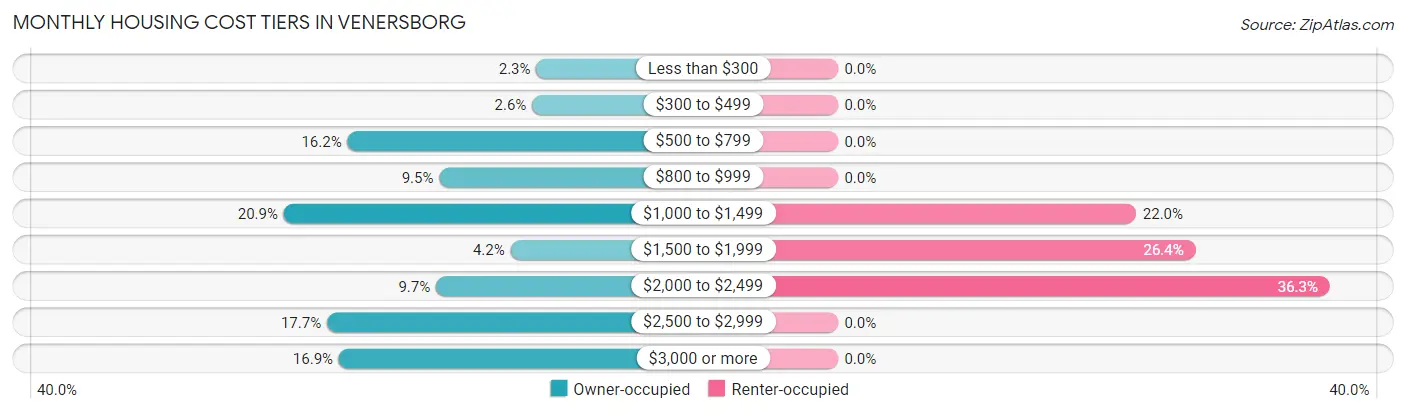
| Monthly Cost | Owner-occupied | Renter-occupied |
| Less than $300 | 29 (2.3%) | 0 (0.0%) |
| $300 to $499 | 33 (2.6%) | 0 (0.0%) |
| $500 to $799 | 204 (16.2%) | 0 (0.0%) |
| $800 to $999 | 119 (9.5%) | 0 (0.0%) |
| $1,000 to $1,499 | 263 (20.9%) | 20 (22.0%) |
| $1,500 to $1,999 | 53 (4.2%) | 24 (26.4%) |
| $2,000 to $2,499 | 122 (9.7%) | 33 (36.3%) |
| $2,500 to $2,999 | 223 (17.7%) | 0 (0.0%) |
| $3,000 or more | 212 (16.9%) | 0 (0.0%) |
| Total | 1,258 (100.0%) | 91 (100.0%) |
Physical Housing Characteristics in Venersborg
Housing Structures in Venersborg
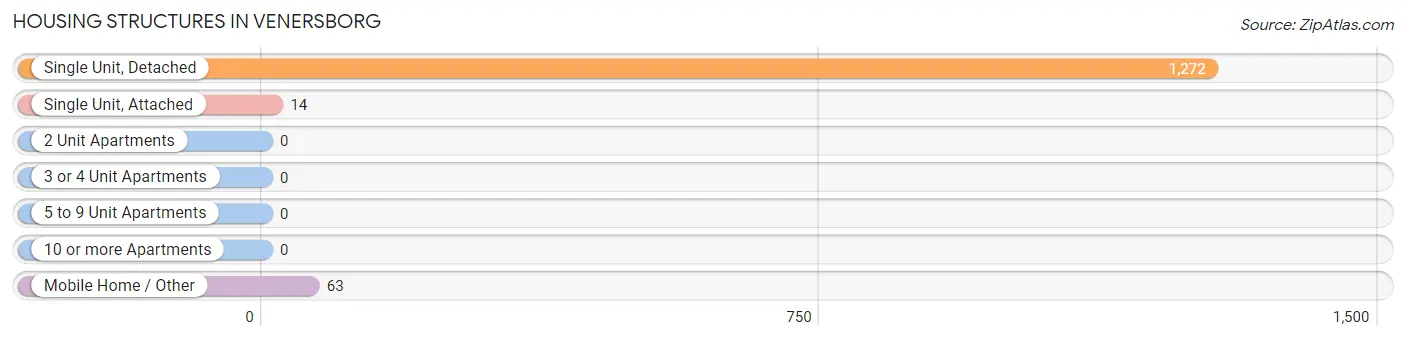
| Structure Type | # Housing Units | % Housing Units |
| Single Unit, Detached | 1,272 | 94.3% |
| Single Unit, Attached | 14 | 1.0% |
| 2 Unit Apartments | 0 | 0.0% |
| 3 or 4 Unit Apartments | 0 | 0.0% |
| 5 to 9 Unit Apartments | 0 | 0.0% |
| 10 or more Apartments | 0 | 0.0% |
| Mobile Home / Other | 63 | 4.7% |
| Total | 1,349 | 100.0% |
Housing Structures by Occupancy in Venersborg
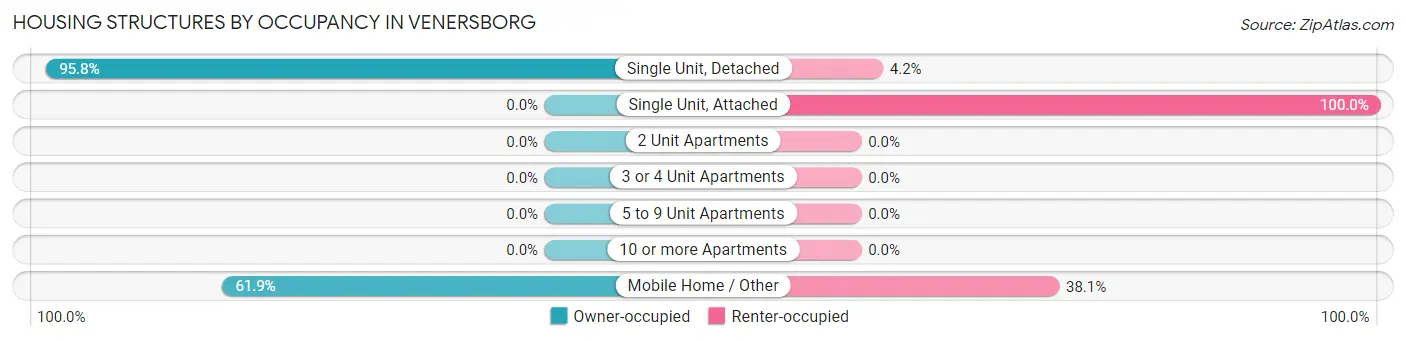
| Structure Type | Owner-occupied | Renter-occupied |
| Single Unit, Detached | 1,219 (95.8%) | 53 (4.2%) |
| Single Unit, Attached | 0 (0.0%) | 14 (100.0%) |
| 2 Unit Apartments | 0 (0.0%) | 0 (0.0%) |
| 3 or 4 Unit Apartments | 0 (0.0%) | 0 (0.0%) |
| 5 to 9 Unit Apartments | 0 (0.0%) | 0 (0.0%) |
| 10 or more Apartments | 0 (0.0%) | 0 (0.0%) |
| Mobile Home / Other | 39 (61.9%) | 24 (38.1%) |
| Total | 1,258 (93.2%) | 91 (6.8%) |
Housing Structures by Number of Rooms in Venersborg
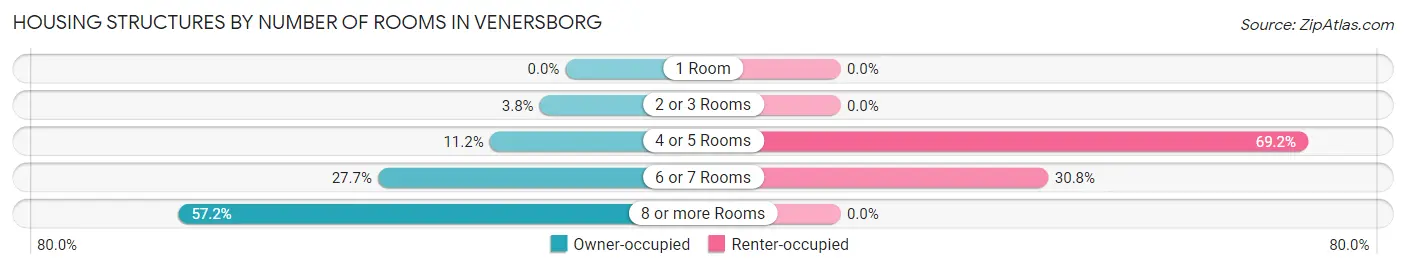
| Number of Rooms | Owner-occupied | Renter-occupied |
| 1 Room | 0 (0.0%) | 0 (0.0%) |
| 2 or 3 Rooms | 48 (3.8%) | 0 (0.0%) |
| 4 or 5 Rooms | 141 (11.2%) | 63 (69.2%) |
| 6 or 7 Rooms | 349 (27.7%) | 28 (30.8%) |
| 8 or more Rooms | 720 (57.2%) | 0 (0.0%) |
| Total | 1,258 (100.0%) | 91 (100.0%) |
Housing Structure by Heating Type in Venersborg
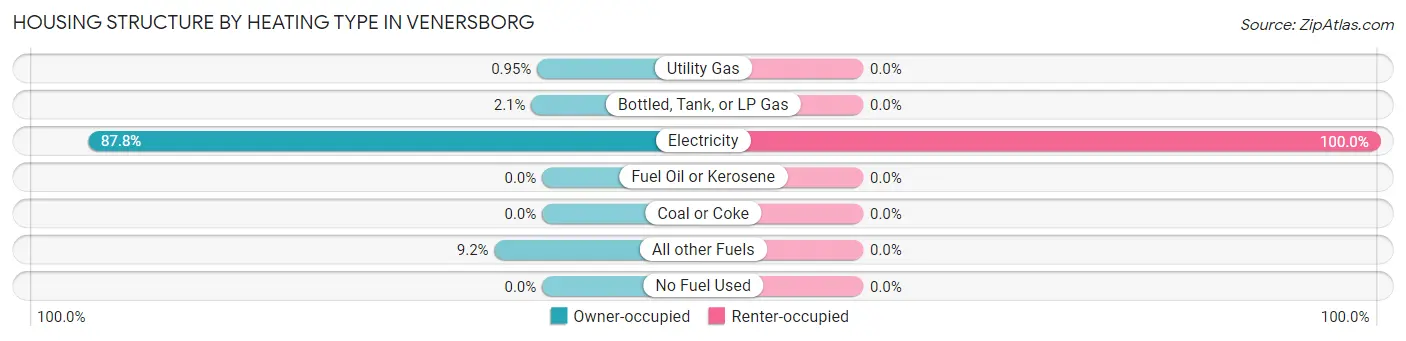
| Heating Type | Owner-occupied | Renter-occupied |
| Utility Gas | 12 (0.9%) | 0 (0.0%) |
| Bottled, Tank, or LP Gas | 26 (2.1%) | 0 (0.0%) |
| Electricity | 1,104 (87.8%) | 91 (100.0%) |
| Fuel Oil or Kerosene | 0 (0.0%) | 0 (0.0%) |
| Coal or Coke | 0 (0.0%) | 0 (0.0%) |
| All other Fuels | 116 (9.2%) | 0 (0.0%) |
| No Fuel Used | 0 (0.0%) | 0 (0.0%) |
| Total | 1,258 (100.0%) | 91 (100.0%) |
Household Vehicle Usage in Venersborg
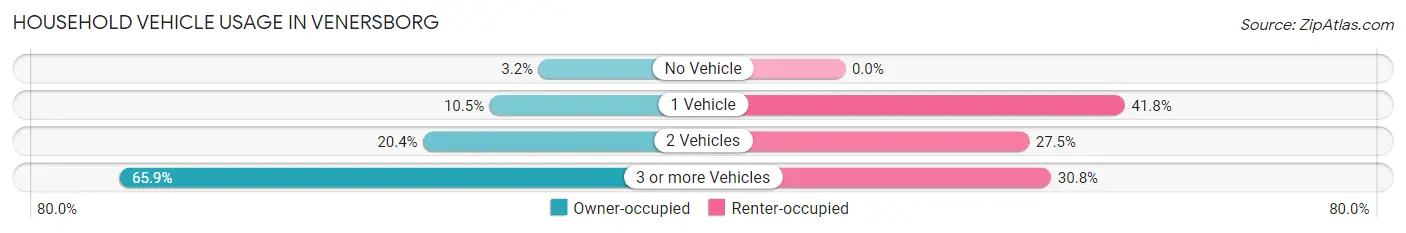
| Vehicles per Household | Owner-occupied | Renter-occupied |
| No Vehicle | 40 (3.2%) | 0 (0.0%) |
| 1 Vehicle | 132 (10.5%) | 38 (41.8%) |
| 2 Vehicles | 257 (20.4%) | 25 (27.5%) |
| 3 or more Vehicles | 829 (65.9%) | 28 (30.8%) |
| Total | 1,258 (100.0%) | 91 (100.0%) |
Real Estate & Mortgages in Venersborg
Real Estate and Mortgage Overview in Venersborg
| Characteristic | Without Mortgage | With Mortgage |
| Housing Units | 474 | 784 |
| Median Property Value | $667,700 | $626,600 |
| Median Household Income | $130,479 | $301 |
| Monthly Housing Costs | $791 | $212 |
| Real Estate Taxes | $5,888 | $28 |
Property Value by Mortgage Status in Venersborg
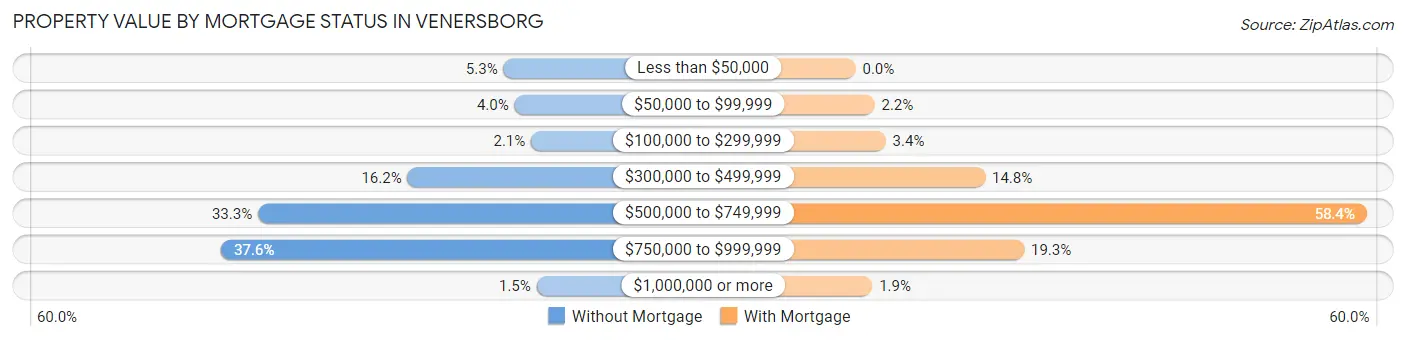
| Property Value | Without Mortgage | With Mortgage |
| Less than $50,000 | 25 (5.3%) | 0 (0.0%) |
| $50,000 to $99,999 | 19 (4.0%) | 17 (2.2%) |
| $100,000 to $299,999 | 10 (2.1%) | 27 (3.4%) |
| $300,000 to $499,999 | 77 (16.2%) | 116 (14.8%) |
| $500,000 to $749,999 | 158 (33.3%) | 458 (58.4%) |
| $750,000 to $999,999 | 178 (37.6%) | 151 (19.3%) |
| $1,000,000 or more | 7 (1.5%) | 15 (1.9%) |
| Total | 474 (100.0%) | 784 (100.0%) |
Household Income by Mortgage Status in Venersborg
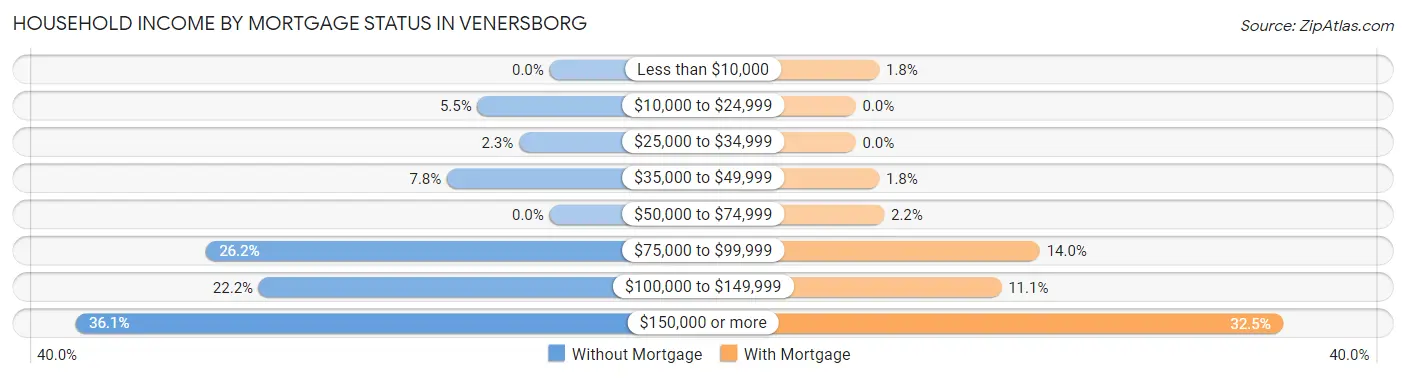
| Household Income | Without Mortgage | With Mortgage |
| Less than $10,000 | 0 (0.0%) | 14 (1.8%) |
| $10,000 to $24,999 | 26 (5.5%) | 0 (0.0%) |
| $25,000 to $34,999 | 11 (2.3%) | 0 (0.0%) |
| $35,000 to $49,999 | 37 (7.8%) | 14 (1.8%) |
| $50,000 to $74,999 | 0 (0.0%) | 17 (2.2%) |
| $75,000 to $99,999 | 124 (26.2%) | 110 (14.0%) |
| $100,000 to $149,999 | 105 (22.2%) | 87 (11.1%) |
| $150,000 or more | 171 (36.1%) | 255 (32.5%) |
| Total | 474 (100.0%) | 784 (100.0%) |
Property Value to Household Income Ratio in Venersborg
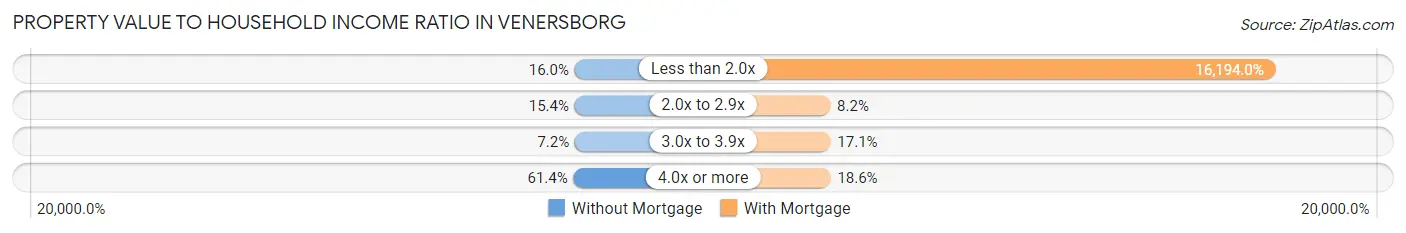
| Value-to-Income Ratio | Without Mortgage | With Mortgage |
| Less than 2.0x | 76 (16.0%) | 126,961 (16,194.0%) |
| 2.0x to 2.9x | 73 (15.4%) | 64 (8.2%) |
| 3.0x to 3.9x | 34 (7.2%) | 134 (17.1%) |
| 4.0x or more | 291 (61.4%) | 146 (18.6%) |
| Total | 474 (100.0%) | 784 (100.0%) |
Real Estate Taxes by Mortgage Status in Venersborg
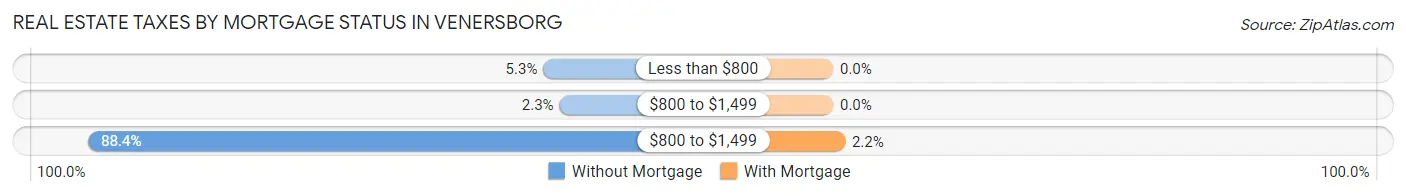
| Property Taxes | Without Mortgage | With Mortgage |
| Less than $800 | 25 (5.3%) | 0 (0.0%) |
| $800 to $1,499 | 11 (2.3%) | 0 (0.0%) |
| $800 to $1,499 | 419 (88.4%) | 17 (2.2%) |
| Total | 474 (100.0%) | 784 (100.0%) |
Health & Disability in Venersborg
Health Insurance Coverage by Age in Venersborg
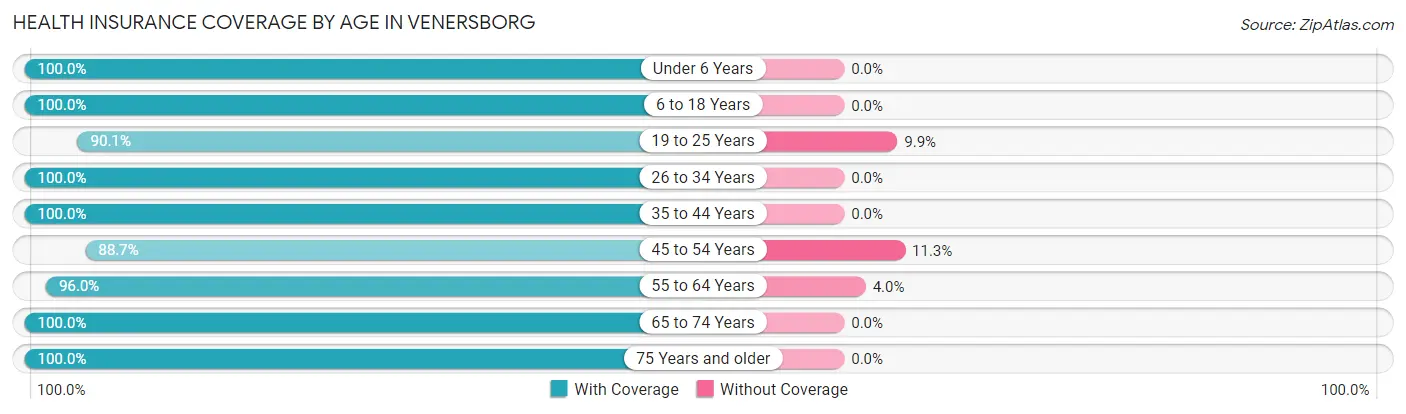
| Age Bracket | With Coverage | Without Coverage |
| Under 6 Years | 292 (100.0%) | 0 (0.0%) |
| 6 to 18 Years | 821 (100.0%) | 0 (0.0%) |
| 19 to 25 Years | 255 (90.1%) | 28 (9.9%) |
| 26 to 34 Years | 336 (100.0%) | 0 (0.0%) |
| 35 to 44 Years | 438 (100.0%) | 0 (0.0%) |
| 45 to 54 Years | 469 (88.7%) | 60 (11.3%) |
| 55 to 64 Years | 601 (96.0%) | 25 (4.0%) |
| 65 to 74 Years | 582 (100.0%) | 0 (0.0%) |
| 75 Years and older | 298 (100.0%) | 0 (0.0%) |
| Total | 4,092 (97.3%) | 113 (2.7%) |
Health Insurance Coverage by Citizenship Status in Venersborg
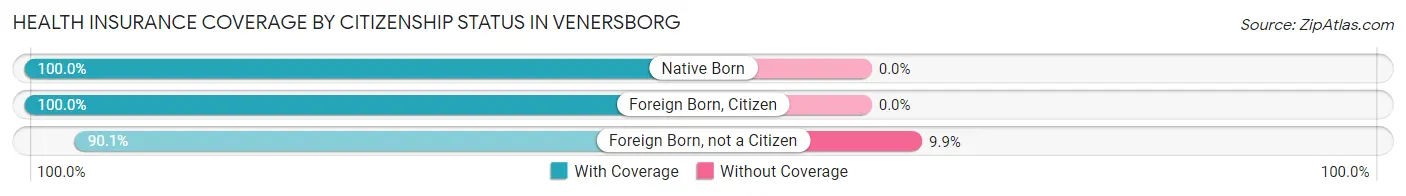
| Citizenship Status | With Coverage | Without Coverage |
| Native Born | 292 (100.0%) | 0 (0.0%) |
| Foreign Born, Citizen | 821 (100.0%) | 0 (0.0%) |
| Foreign Born, not a Citizen | 255 (90.1%) | 28 (9.9%) |
Health Insurance Coverage by Household Income in Venersborg
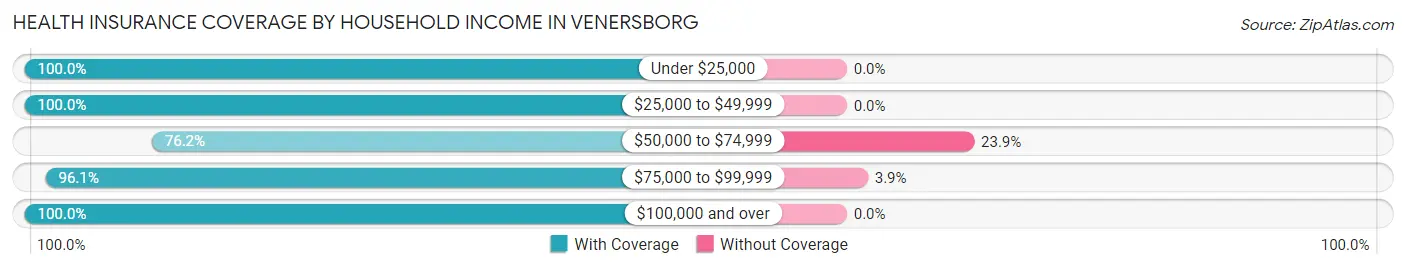
| Household Income | With Coverage | Without Coverage |
| Under $25,000 | 26 (100.0%) | 0 (0.0%) |
| $25,000 to $49,999 | 244 (100.0%) | 0 (0.0%) |
| $50,000 to $74,999 | 281 (76.1%) | 88 (23.8%) |
| $75,000 to $99,999 | 611 (96.1%) | 25 (3.9%) |
| $100,000 and over | 2,922 (100.0%) | 0 (0.0%) |
Public vs Private Health Insurance Coverage by Age in Venersborg
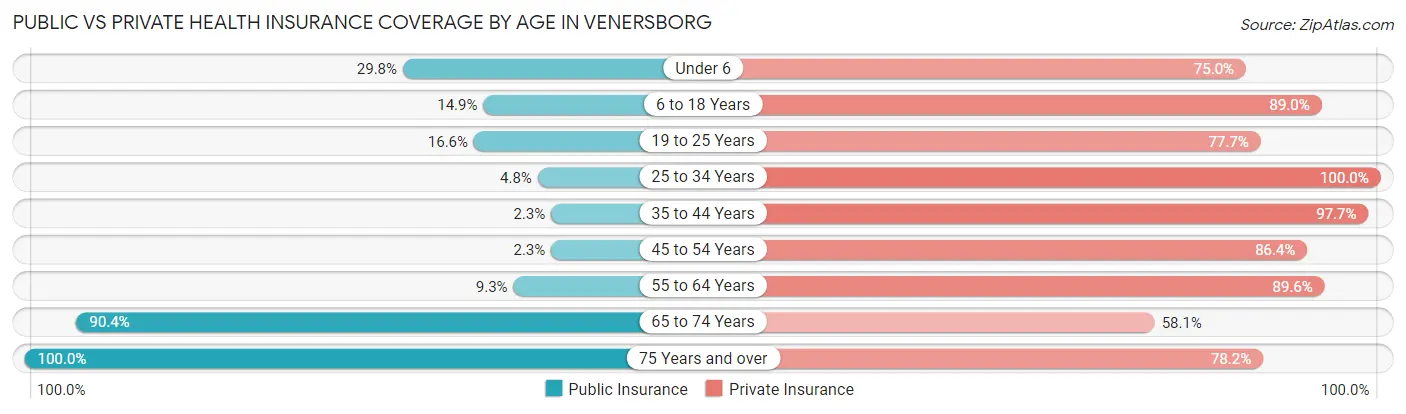
| Age Bracket | Public Insurance | Private Insurance |
| Under 6 | 87 (29.8%) | 219 (75.0%) |
| 6 to 18 Years | 122 (14.9%) | 731 (89.0%) |
| 19 to 25 Years | 47 (16.6%) | 220 (77.7%) |
| 25 to 34 Years | 16 (4.8%) | 336 (100.0%) |
| 35 to 44 Years | 10 (2.3%) | 428 (97.7%) |
| 45 to 54 Years | 12 (2.3%) | 457 (86.4%) |
| 55 to 64 Years | 58 (9.3%) | 561 (89.6%) |
| 65 to 74 Years | 526 (90.4%) | 338 (58.1%) |
| 75 Years and over | 298 (100.0%) | 233 (78.2%) |
| Total | 1,176 (28.0%) | 3,523 (83.8%) |
Disability Status by Sex by Age in Venersborg
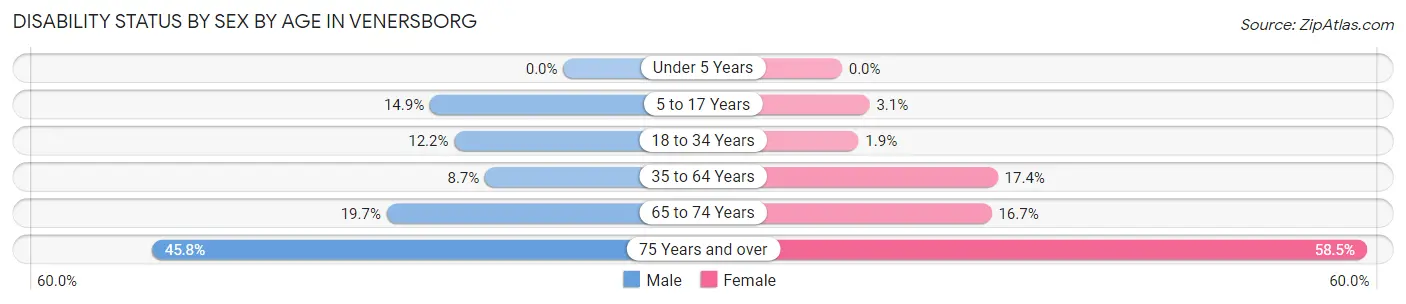
| Age Bracket | Male | Female |
| Under 5 Years | 0 (0.0%) | 0 (0.0%) |
| 5 to 17 Years | 64 (14.8%) | 14 (3.1%) |
| 18 to 34 Years | 26 (12.1%) | 8 (1.8%) |
| 35 to 64 Years | 70 (8.7%) | 137 (17.4%) |
| 65 to 74 Years | 59 (19.7%) | 47 (16.7%) |
| 75 Years and over | 77 (45.8%) | 76 (58.5%) |
Disability Class by Sex by Age in Venersborg
Disability Class: Hearing Difficulty
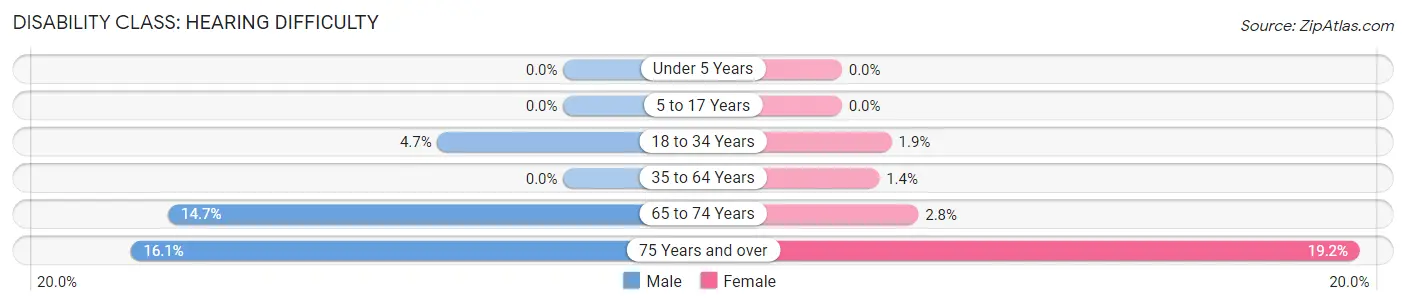
| Age Bracket | Male | Female |
| Under 5 Years | 0 (0.0%) | 0 (0.0%) |
| 5 to 17 Years | 0 (0.0%) | 0 (0.0%) |
| 18 to 34 Years | 10 (4.7%) | 8 (1.8%) |
| 35 to 64 Years | 0 (0.0%) | 11 (1.4%) |
| 65 to 74 Years | 44 (14.7%) | 8 (2.8%) |
| 75 Years and over | 27 (16.1%) | 25 (19.2%) |
Disability Class: Vision Difficulty
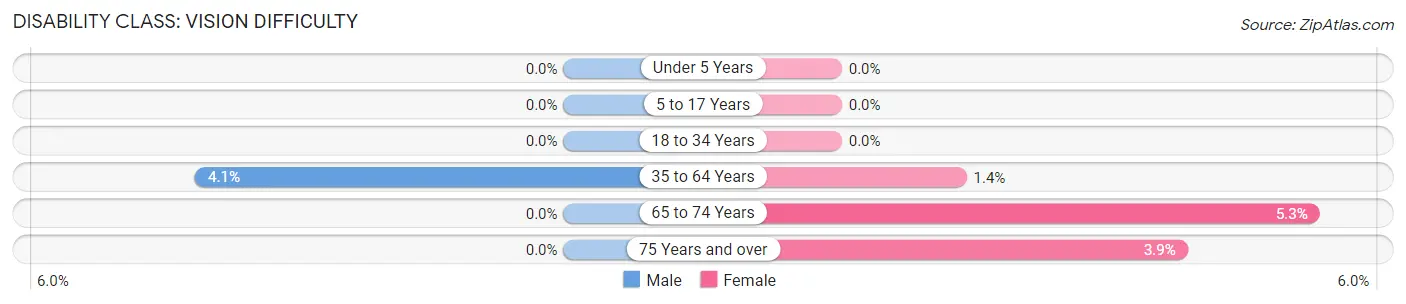
| Age Bracket | Male | Female |
| Under 5 Years | 0 (0.0%) | 0 (0.0%) |
| 5 to 17 Years | 0 (0.0%) | 0 (0.0%) |
| 18 to 34 Years | 0 (0.0%) | 0 (0.0%) |
| 35 to 64 Years | 33 (4.1%) | 11 (1.4%) |
| 65 to 74 Years | 0 (0.0%) | 15 (5.3%) |
| 75 Years and over | 0 (0.0%) | 5 (3.8%) |
Disability Class: Cognitive Difficulty
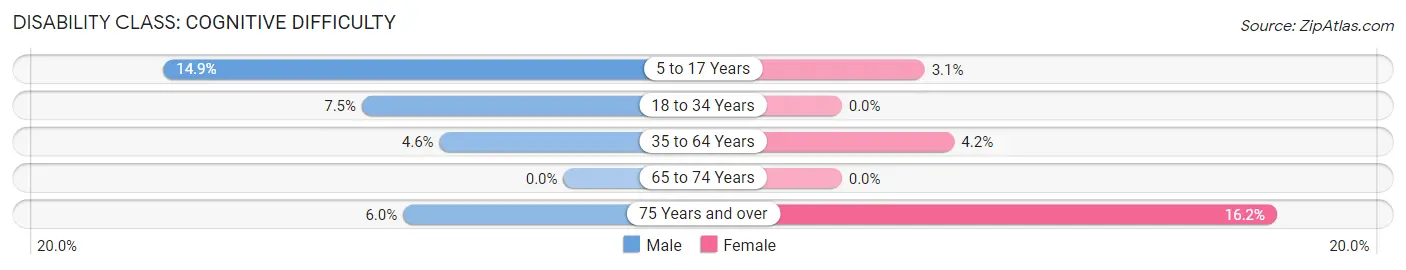
| Age Bracket | Male | Female |
| 5 to 17 Years | 64 (14.8%) | 14 (3.1%) |
| 18 to 34 Years | 16 (7.5%) | 0 (0.0%) |
| 35 to 64 Years | 37 (4.6%) | 33 (4.2%) |
| 65 to 74 Years | 0 (0.0%) | 0 (0.0%) |
| 75 Years and over | 10 (5.9%) | 21 (16.2%) |
Disability Class: Ambulatory Difficulty
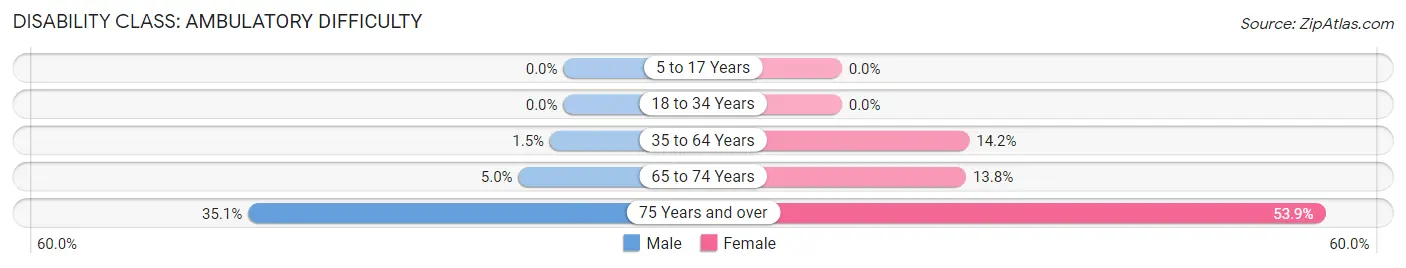
| Age Bracket | Male | Female |
| 5 to 17 Years | 0 (0.0%) | 0 (0.0%) |
| 18 to 34 Years | 0 (0.0%) | 0 (0.0%) |
| 35 to 64 Years | 12 (1.5%) | 112 (14.2%) |
| 65 to 74 Years | 15 (5.0%) | 39 (13.8%) |
| 75 Years and over | 59 (35.1%) | 70 (53.8%) |
Disability Class: Self-Care Difficulty
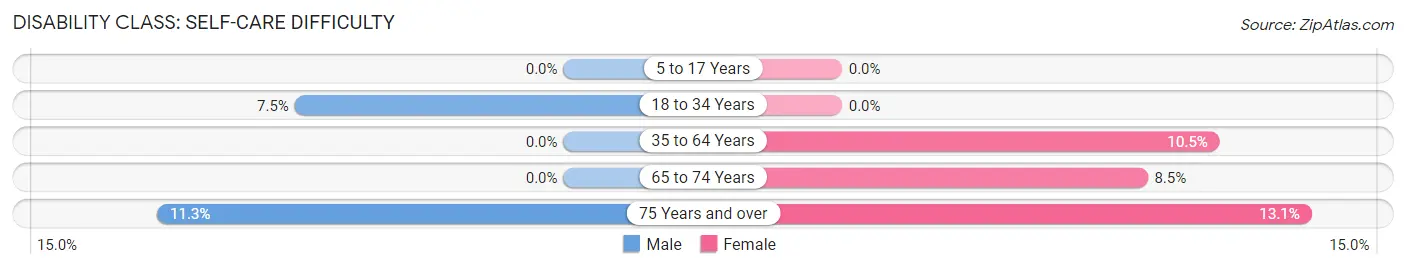
| Age Bracket | Male | Female |
| 5 to 17 Years | 0 (0.0%) | 0 (0.0%) |
| 18 to 34 Years | 16 (7.5%) | 0 (0.0%) |
| 35 to 64 Years | 0 (0.0%) | 83 (10.5%) |
| 65 to 74 Years | 0 (0.0%) | 24 (8.5%) |
| 75 Years and over | 19 (11.3%) | 17 (13.1%) |
Technology Access in Venersborg
Computing Device Access in Venersborg
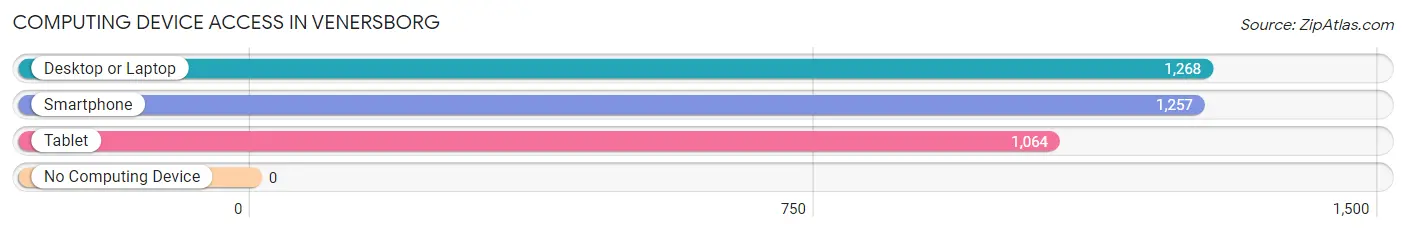
| Device Type | # Households | % Households |
| Desktop or Laptop | 1,268 | 94.0% |
| Smartphone | 1,257 | 93.2% |
| Tablet | 1,064 | 78.9% |
| No Computing Device | 0 | 0.0% |
| Total | 1,349 | 100.0% |
Internet Access in Venersborg
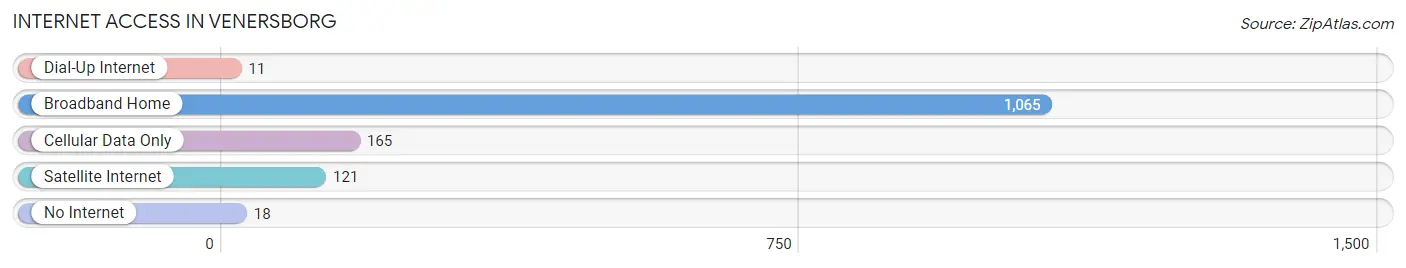
| Internet Type | # Households | % Households |
| Dial-Up Internet | 11 | 0.8% |
| Broadband Home | 1,065 | 78.9% |
| Cellular Data Only | 165 | 12.2% |
| Satellite Internet | 121 | 9.0% |
| No Internet | 18 | 1.3% |
| Total | 1,349 | 100.0% |
Venersborg Summary
Venersborg is a small unincorporated community located in Clark County, Washington, United States. It is situated in the foothills of the Cascade Mountains, approximately 20 miles east of Vancouver. The population of Venersborg was estimated to be around 200 people in 2000.
History
Venersborg was founded in 1883 by Swedish immigrants who had come to the area in search of a better life. The town was named after the Swedish city of Vänersborg, which is located on the shores of Lake Vänern. The first settlers in Venersborg were mostly farmers, and the town quickly grew to become a thriving agricultural community.
In the early 1900s, the town was home to a sawmill, a general store, a post office, a blacksmith shop, and a school. The town also had a church, which was built in 1906.
Geography
Venersborg is located in the foothills of the Cascade Mountains, approximately 20 miles east of Vancouver. The town is situated on a plateau, with an elevation of about 1,000 feet. The surrounding area is mostly forested, with some open fields and meadows.
The climate in Venersborg is mild and temperate, with warm summers and cool winters. The average annual temperature is around 50 degrees Fahrenheit.
Economy
The economy of Venersborg is largely based on agriculture. The town is home to several farms, which produce a variety of crops, including hay, wheat, corn, and potatoes. The town also has a few small businesses, including a general store, a post office, and a few restaurants.
Demographics
As of the 2000 census, the population of Venersborg was estimated to be around 200 people. The racial makeup of the town was 97.5% White, 0.5% African American, 0.5% Native American, and 1.5% from other races. The median household income was $37,500, and the median family income was $41,250.
Conclusion
Venersborg is a small unincorporated community located in Clark County, Washington. It was founded in 1883 by Swedish immigrants, and has since grown to become a thriving agricultural community. The town is situated in the foothills of the Cascade Mountains, and has a mild and temperate climate. The economy of Venersborg is largely based on agriculture, and the population was estimated to be around 200 people in 2000.
Common Questions
What is Per Capita Income in Venersborg?
Per Capita income in Venersborg is $47,805.
What is the Median Family Income in Venersborg?
Median Family Income in Venersborg is $130,651.
What is the Median Household income in Venersborg?
Median Household Income in Venersborg is $126,642.
What is Income or Wage Gap in Venersborg?
Income or Wage Gap in Venersborg is 46.1%.
Women in Venersborg earn 53.9 cents for every dollar earned by a man.
What is Inequality or Gini Index in Venersborg?
Inequality or Gini Index in Venersborg is 0.33.
What is the Total Population of Venersborg?
Total Population of Venersborg is 4,212.
What is the Total Male Population of Venersborg?
Total Male Population of Venersborg is 1,997.
What is the Total Female Population of Venersborg?
Total Female Population of Venersborg is 2,215.
What is the Ratio of Males per 100 Females in Venersborg?
There are 90.16 Males per 100 Females in Venersborg.
What is the Ratio of Females per 100 Males in Venersborg?
There are 110.92 Females per 100 Males in Venersborg.
What is the Median Population Age in Venersborg?
Median Population Age in Venersborg is 41.5 Years.
What is the Average Family Size in Venersborg
Average Family Size in Venersborg is 3.3 People.
What is the Average Household Size in Venersborg
Average Household Size in Venersborg is 3.1 People.
How Large is the Labor Force in Venersborg?
There are 1,931 People in the Labor Forcein in Venersborg.
What is the Percentage of People in the Labor Force in Venersborg?
58.6% of People are in the Labor Force in Venersborg.
What is the Unemployment Rate in Venersborg?
Unemployment Rate in Venersborg is 5.1%.