Wallington borough, NJ Map & Demographics
Wallington borough Overview
$42,203
PER CAPITA INCOME
$85,745
AVG FAMILY INCOME
$79,270
AVG HOUSEHOLD INCOME
42.7%
WAGE / INCOME GAP [ % ]
57.3¢/ $1
WAGE / INCOME GAP [ $ ]
0.43
INEQUALITY / GINI INDEX
11,838
TOTAL POPULATION
6,014
MALE POPULATION
5,824
FEMALE POPULATION
103.26
MALES / 100 FEMALES
96.84
FEMALES / 100 MALES
39.3
MEDIAN AGE
2.9
AVG FAMILY SIZE
2.4
AVG HOUSEHOLD SIZE
6,538
LABOR FORCE [ PEOPLE ]
66.4%
PERCENT IN LABOR FORCE
7.6%
UNEMPLOYMENT RATE
Income in Wallington borough
Income Overview in Wallington borough
Per Capita Income in Wallington borough is $42,203, while median incomes of families and households are $85,745 and $79,270 respectively.
| Characteristic | Number | Measure |
| Per Capita Income | 11,838 | $42,203 |
| Median Family Income | 3,206 | $85,745 |
| Mean Family Income | 3,206 | $112,030 |
| Median Household Income | 4,994 | $79,270 |
| Mean Household Income | 4,994 | $99,704 |
| Income Deficit | 3,206 | $0 |
| Wage / Income Gap (%) | 11,838 | 42.72% |
| Wage / Income Gap ($) | 11,838 | 57.28¢ per $1 |
| Gini / Inequality Index | 11,838 | 0.43 |
Earnings by Sex in Wallington borough
Average Earnings in Wallington borough are $53,277, $69,938 for men and $40,061 for women, a difference of 42.7%.
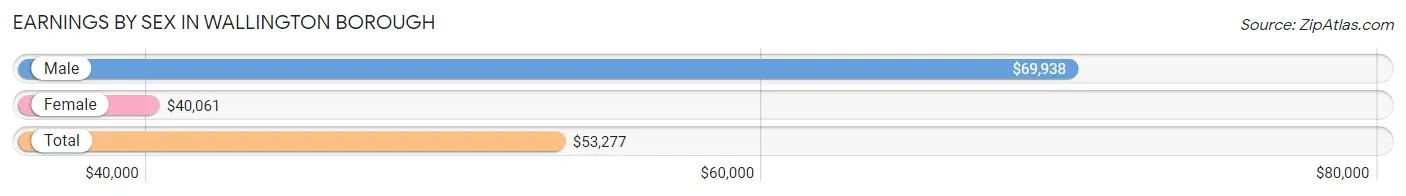
| Sex | Number | Average Earnings |
| Male | 3,710 (54.8%) | $69,938 |
| Female | 3,064 (45.2%) | $40,061 |
| Total | 6,774 (100.0%) | $53,277 |
Earnings by Sex by Income Bracket in Wallington borough
The most common earnings brackets in Wallington borough are $75,000 to $99,999 for men (859 | 23.2%) and $75,000 to $99,999 for women (435 | 14.2%).
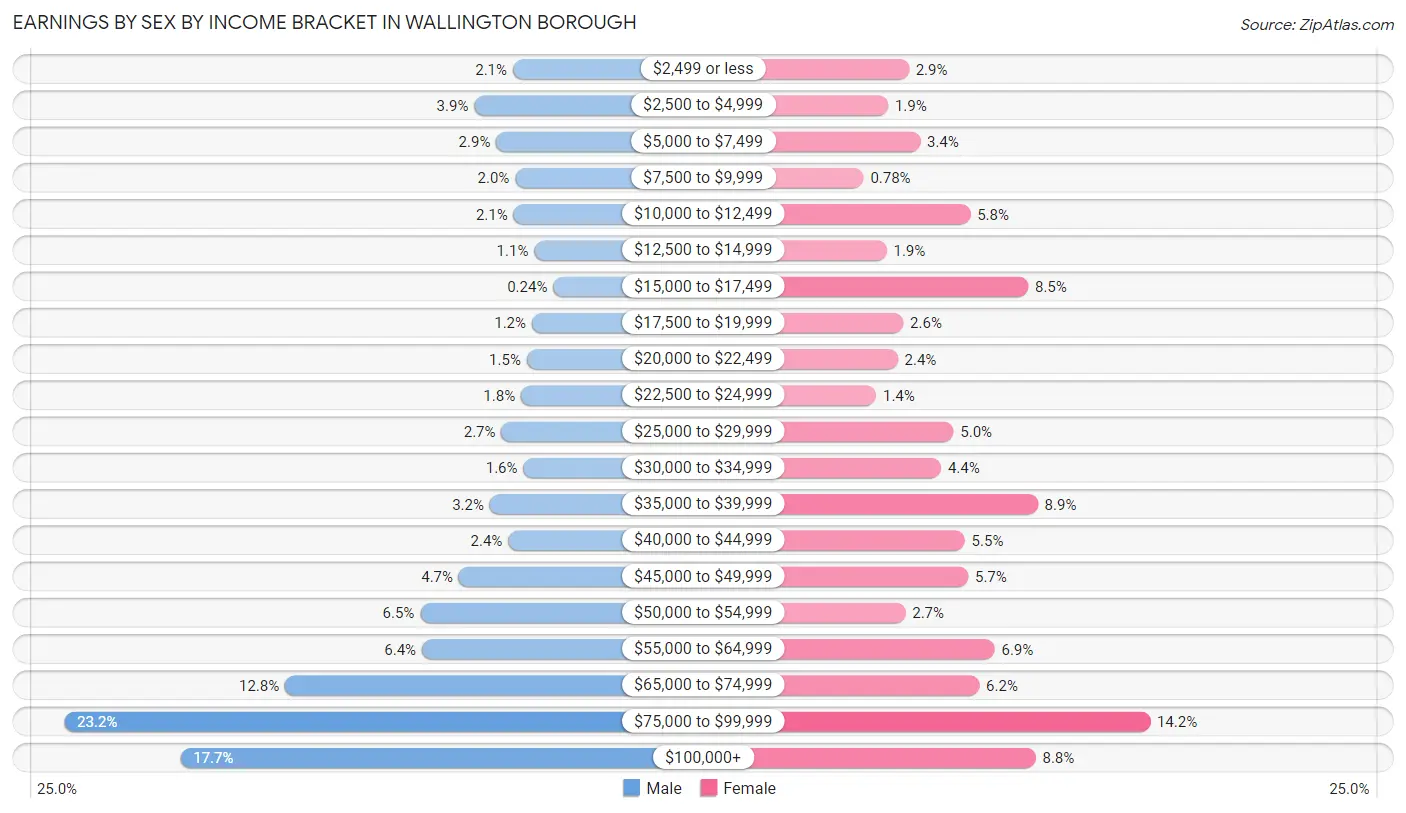
| Income | Male | Female |
| $2,499 or less | 79 (2.1%) | 89 (2.9%) |
| $2,500 to $4,999 | 146 (3.9%) | 59 (1.9%) |
| $5,000 to $7,499 | 108 (2.9%) | 105 (3.4%) |
| $7,500 to $9,999 | 75 (2.0%) | 24 (0.8%) |
| $10,000 to $12,499 | 78 (2.1%) | 177 (5.8%) |
| $12,500 to $14,999 | 42 (1.1%) | 57 (1.9%) |
| $15,000 to $17,499 | 9 (0.2%) | 260 (8.5%) |
| $17,500 to $19,999 | 46 (1.2%) | 81 (2.6%) |
| $20,000 to $22,499 | 55 (1.5%) | 73 (2.4%) |
| $22,500 to $24,999 | 65 (1.8%) | 42 (1.4%) |
| $25,000 to $29,999 | 99 (2.7%) | 153 (5.0%) |
| $30,000 to $34,999 | 61 (1.6%) | 135 (4.4%) |
| $35,000 to $39,999 | 119 (3.2%) | 274 (8.9%) |
| $40,000 to $44,999 | 87 (2.4%) | 169 (5.5%) |
| $45,000 to $49,999 | 173 (4.7%) | 174 (5.7%) |
| $50,000 to $54,999 | 240 (6.5%) | 84 (2.7%) |
| $55,000 to $64,999 | 237 (6.4%) | 212 (6.9%) |
| $65,000 to $74,999 | 475 (12.8%) | 190 (6.2%) |
| $75,000 to $99,999 | 859 (23.2%) | 435 (14.2%) |
| $100,000+ | 657 (17.7%) | 271 (8.8%) |
| Total | 3,710 (100.0%) | 3,064 (100.0%) |
Earnings by Sex by Educational Attainment in Wallington borough
Average earnings in Wallington borough are $71,377 for men and $42,244 for women, a difference of 40.8%. Men with an educational attainment of bachelor's degree enjoy the highest average annual earnings of $79,005, while those with high school diploma education earn the least with $56,586. Women with an educational attainment of graduate degree earn the most with the average annual earnings of $65,729, while those with less than high school education have the smallest earnings of $28,250.
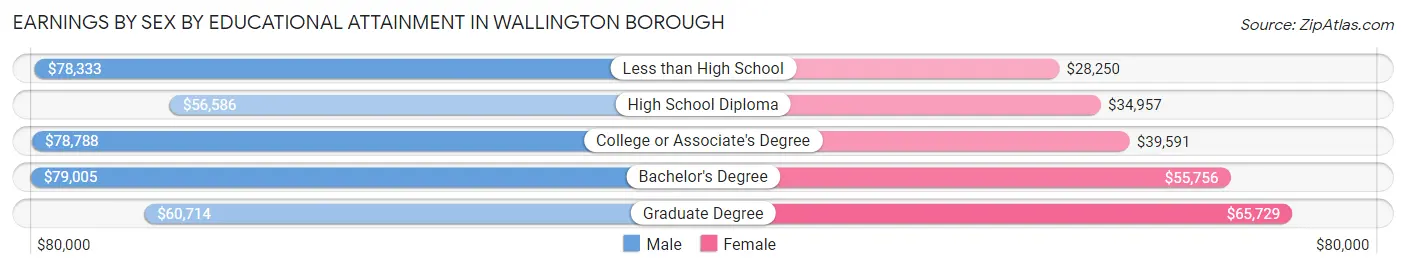
| Educational Attainment | Male Income | Female Income |
| Less than High School | $78,333 | $28,250 |
| High School Diploma | $56,586 | $34,957 |
| College or Associate's Degree | $78,788 | $39,591 |
| Bachelor's Degree | $79,005 | $55,756 |
| Graduate Degree | $60,714 | $65,729 |
| Total | $71,377 | $42,244 |
Family Income in Wallington borough
Family Income Brackets in Wallington borough
According to the Wallington borough family income data, there are 561 families falling into the $75,000 to $99,999 income range, which is the most common income bracket and makes up 17.5% of all families. Conversely, the less than $10,000 income bracket is the least frequent group with only 103 families (3.2%) belonging to this category.
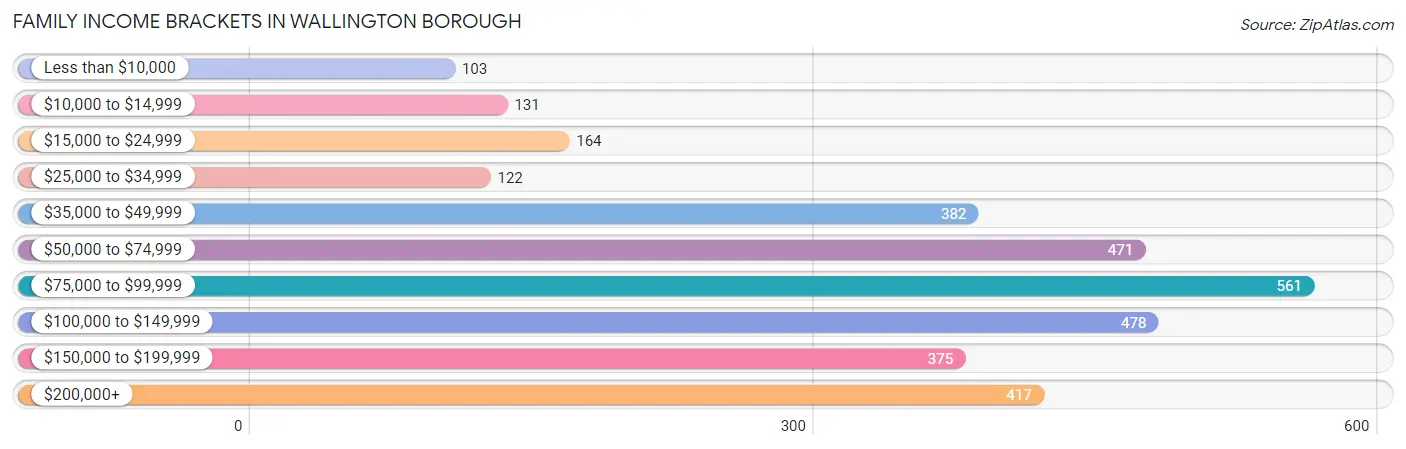
| Income Bracket | # Families | % Families |
| Less than $10,000 | 103 | 3.2% |
| $10,000 to $14,999 | 131 | 4.1% |
| $15,000 to $24,999 | 164 | 5.1% |
| $25,000 to $34,999 | 122 | 3.8% |
| $35,000 to $49,999 | 382 | 11.9% |
| $50,000 to $74,999 | 471 | 14.7% |
| $75,000 to $99,999 | 561 | 17.5% |
| $100,000 to $149,999 | 478 | 14.9% |
| $150,000 to $199,999 | 375 | 11.7% |
| $200,000+ | 417 | 13.0% |
Family Income by Famaliy Size in Wallington borough
7+ person families (24 | 0.7%) account for the highest median family income in Wallington borough with $250,001 per family, while 5-person families (122 | 3.8%) have the highest median income of $45,045 per family member.
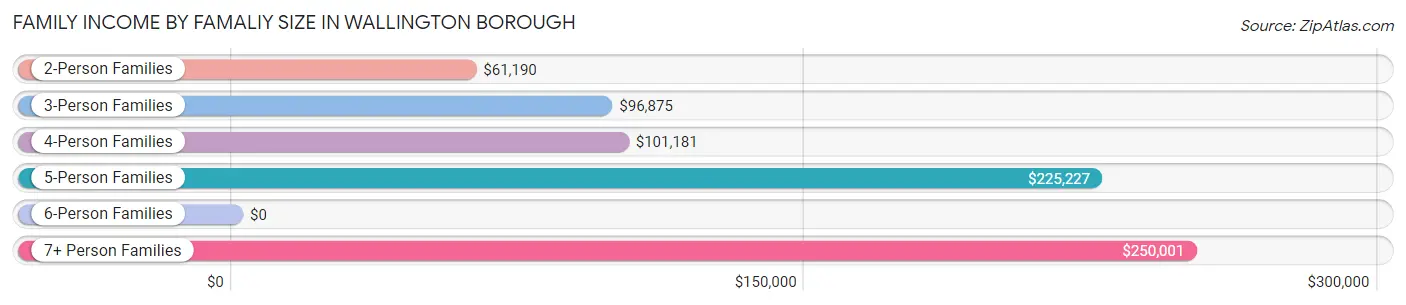
| Income Bracket | # Families | Median Income |
| 2-Person Families | 1,264 (39.4%) | $61,190 |
| 3-Person Families | 1,372 (42.8%) | $96,875 |
| 4-Person Families | 413 (12.9%) | $101,181 |
| 5-Person Families | 122 (3.8%) | $225,227 |
| 6-Person Families | 11 (0.3%) | $0 |
| 7+ Person Families | 24 (0.7%) | $250,001 |
| Total | 3,206 (100.0%) | $85,745 |
Family Income by Number of Earners in Wallington borough
The median family income in Wallington borough is $85,745, with families comprising 3+ earners (428) having the highest median family income of $191,944, while families with no earners (424) have the lowest median family income of $41,141, accounting for 13.4% and 13.2% of families, respectively.
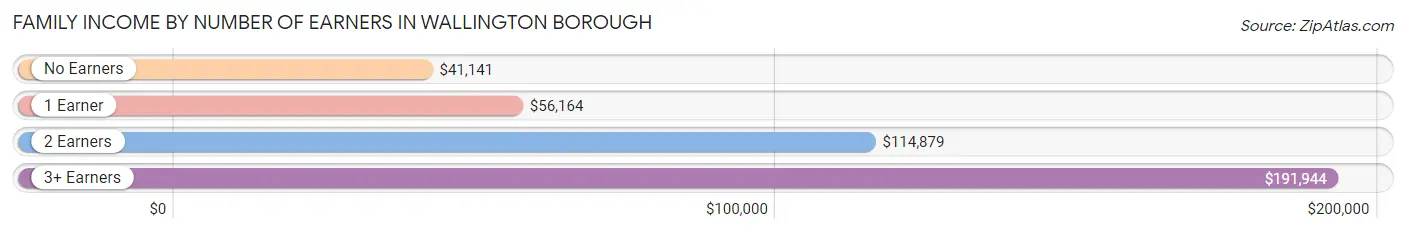
| Number of Earners | # Families | Median Income |
| No Earners | 424 (13.2%) | $41,141 |
| 1 Earner | 1,205 (37.6%) | $56,164 |
| 2 Earners | 1,149 (35.8%) | $114,879 |
| 3+ Earners | 428 (13.4%) | $191,944 |
| Total | 3,206 (100.0%) | $85,745 |
Household Income in Wallington borough
Household Income Brackets in Wallington borough
With 999 households falling in the category, the $75,000 to $99,999 income range is the most frequent in Wallington borough, accounting for 20.0% of all households. In contrast, only 155 households (3.1%) fall into the less than $10,000 income bracket, making it the least populous group.
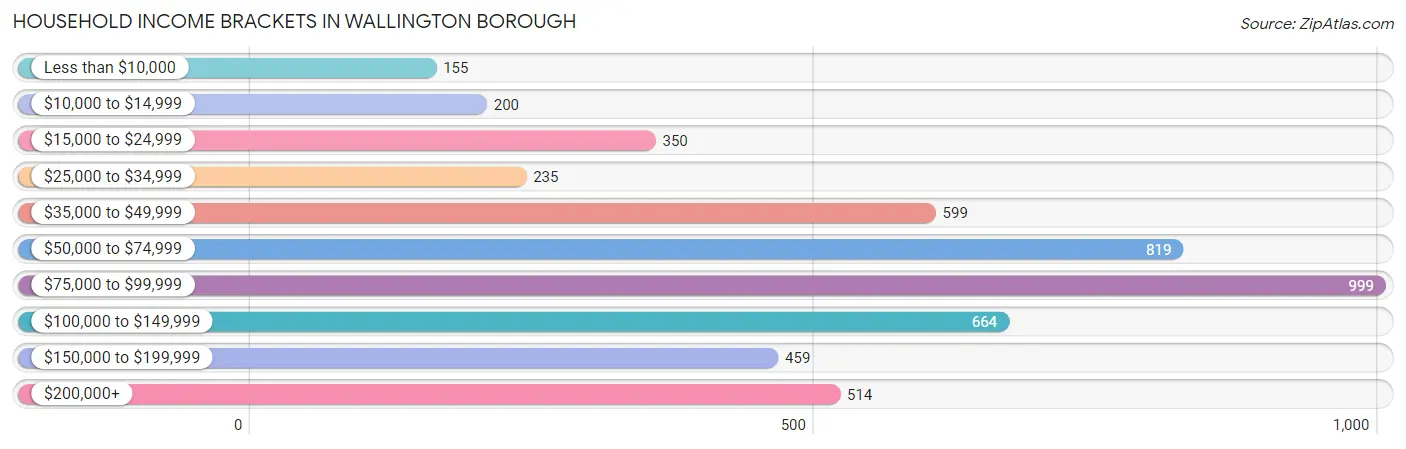
| Income Bracket | # Households | % Households |
| Less than $10,000 | 155 | 3.1% |
| $10,000 to $14,999 | 200 | 4.0% |
| $15,000 to $24,999 | 350 | 7.0% |
| $25,000 to $34,999 | 235 | 4.7% |
| $35,000 to $49,999 | 599 | 12.0% |
| $50,000 to $74,999 | 819 | 16.4% |
| $75,000 to $99,999 | 999 | 20.0% |
| $100,000 to $149,999 | 664 | 13.3% |
| $150,000 to $199,999 | 459 | 9.2% |
| $200,000+ | 514 | 10.3% |
Household Income by Householder Age in Wallington borough
The median household income in Wallington borough is $79,270, with the highest median household income of $86,725 found in the 25 to 44 years age bracket for the primary householder. A total of 1,976 households (39.6%) fall into this category. Meanwhile, the 15 to 24 years age bracket for the primary householder has the lowest median household income of $35,096, with 217 households (4.3%) in this group.
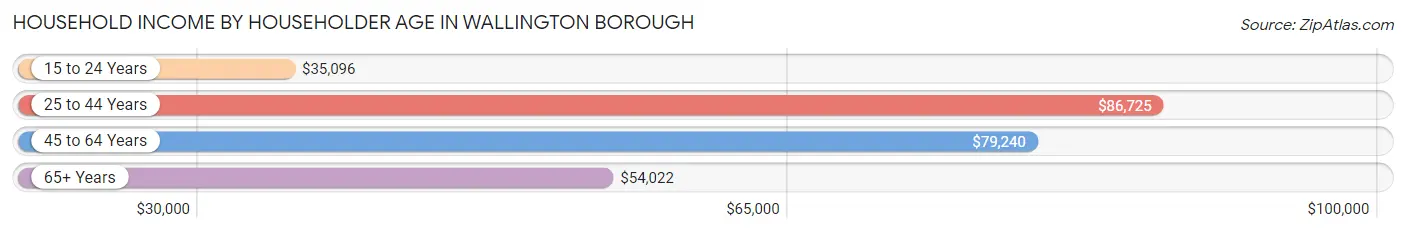
| Income Bracket | # Households | Median Income |
| 15 to 24 Years | 217 (4.3%) | $35,096 |
| 25 to 44 Years | 1,976 (39.6%) | $86,725 |
| 45 to 64 Years | 1,783 (35.7%) | $79,240 |
| 65+ Years | 1,018 (20.4%) | $54,022 |
| Total | 4,994 (100.0%) | $79,270 |
Poverty in Wallington borough
Income Below Poverty by Sex and Age in Wallington borough
With 8.6% poverty level for males and 13.0% for females among the residents of Wallington borough, 15 year old males and 12 to 14 year old females are the most vulnerable to poverty, with 13 males (31.7%) and 92 females (48.4%) in their respective age groups living below the poverty level.
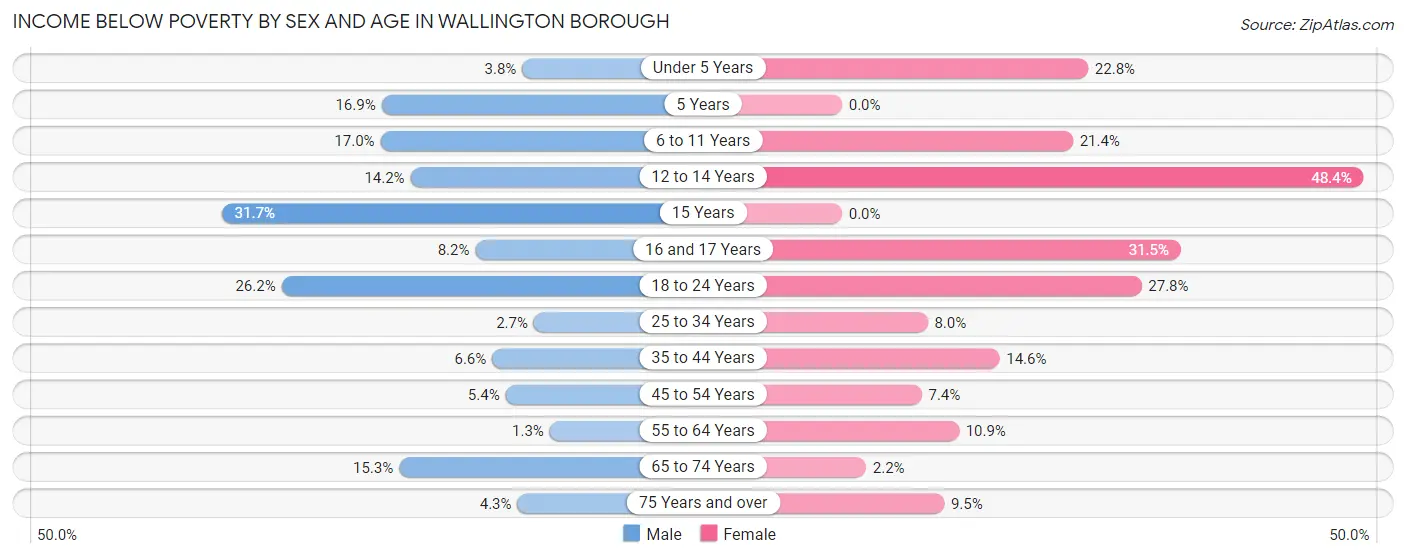
| Age Bracket | Male | Female |
| Under 5 Years | 11 (3.8%) | 82 (22.8%) |
| 5 Years | 13 (16.9%) | 0 (0.0%) |
| 6 to 11 Years | 90 (17.0%) | 51 (21.4%) |
| 12 to 14 Years | 22 (14.2%) | 92 (48.4%) |
| 15 Years | 13 (31.7%) | 0 (0.0%) |
| 16 and 17 Years | 17 (8.2%) | 28 (31.5%) |
| 18 to 24 Years | 118 (26.2%) | 77 (27.8%) |
| 25 to 34 Years | 28 (2.7%) | 77 (8.0%) |
| 35 to 44 Years | 70 (6.6%) | 124 (14.6%) |
| 45 to 54 Years | 47 (5.4%) | 71 (7.4%) |
| 55 to 64 Years | 8 (1.3%) | 83 (10.8%) |
| 65 to 74 Years | 68 (15.2%) | 8 (2.2%) |
| 75 Years and over | 9 (4.3%) | 64 (9.5%) |
| Total | 514 (8.6%) | 757 (13.0%) |
Income Above Poverty by Sex and Age in Wallington borough
According to the poverty statistics in Wallington borough, males aged 55 to 64 years and females aged 5 years are the age groups that are most secure financially, with 98.7% of males and 100.0% of females in these age groups living above the poverty line.
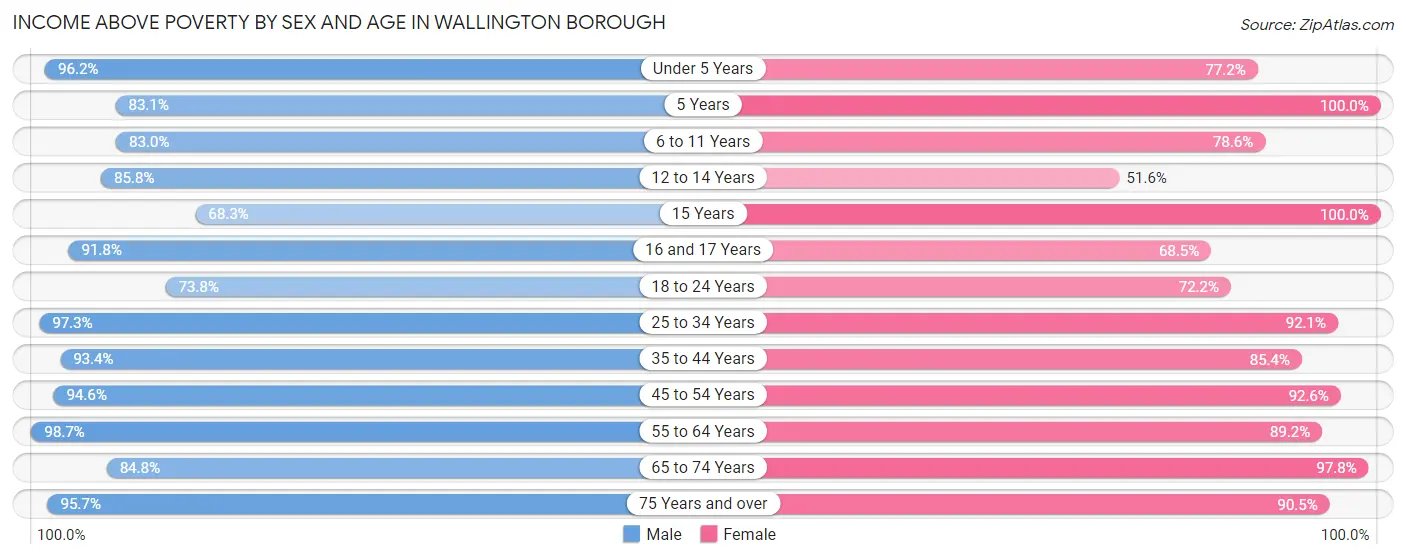
| Age Bracket | Male | Female |
| Under 5 Years | 277 (96.2%) | 277 (77.2%) |
| 5 Years | 64 (83.1%) | 10 (100.0%) |
| 6 to 11 Years | 440 (83.0%) | 187 (78.6%) |
| 12 to 14 Years | 133 (85.8%) | 98 (51.6%) |
| 15 Years | 28 (68.3%) | 67 (100.0%) |
| 16 and 17 Years | 191 (91.8%) | 61 (68.5%) |
| 18 to 24 Years | 333 (73.8%) | 200 (72.2%) |
| 25 to 34 Years | 995 (97.3%) | 891 (92.0%) |
| 35 to 44 Years | 989 (93.4%) | 724 (85.4%) |
| 45 to 54 Years | 829 (94.6%) | 889 (92.6%) |
| 55 to 64 Years | 623 (98.7%) | 682 (89.1%) |
| 65 to 74 Years | 378 (84.8%) | 351 (97.8%) |
| 75 Years and over | 202 (95.7%) | 611 (90.5%) |
| Total | 5,482 (91.4%) | 5,048 (87.0%) |
Income Below Poverty Among Married-Couple Families in Wallington borough
The poverty statistics for married-couple families in Wallington borough show that 5.0% or 119 of the total 2,403 families live below the poverty line. Families with no children have the highest poverty rate of 5.1%, comprising of 60 families. On the other hand, families with 3 or 4 children have the lowest poverty rate of 0.0%, which includes 0 families.
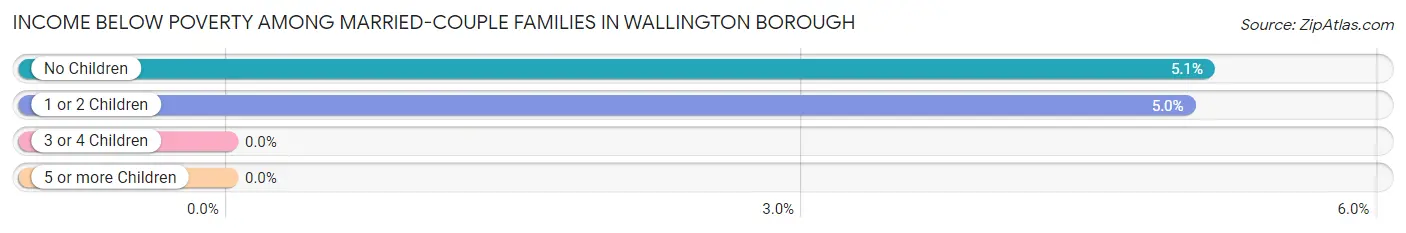
| Children | Above Poverty | Below Poverty |
| No Children | 1,117 (94.9%) | 60 (5.1%) |
| 1 or 2 Children | 1,121 (95.0%) | 59 (5.0%) |
| 3 or 4 Children | 46 (100.0%) | 0 (0.0%) |
| 5 or more Children | 0 (0.0%) | 0 (0.0%) |
| Total | 2,284 (95.1%) | 119 (5.0%) |
Income Below Poverty Among Single-Parent Households in Wallington borough
According to the poverty data in Wallington borough, 11.6% or 25 single-father households and 28.7% or 169 single-mother households are living below the poverty line. Among single-father households, those with 1 or 2 children have the highest poverty rate, with 25 households (40.3%) experiencing poverty. Likewise, among single-mother households, those with 1 or 2 children have the highest poverty rate, with 143 households (44.1%) falling below the poverty line.
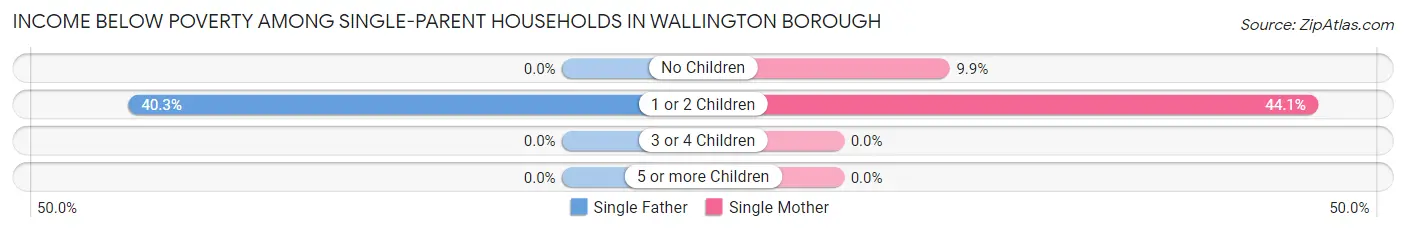
| Children | Single Father | Single Mother |
| No Children | 0 (0.0%) | 26 (9.9%) |
| 1 or 2 Children | 25 (40.3%) | 143 (44.1%) |
| 3 or 4 Children | 0 (0.0%) | 0 (0.0%) |
| 5 or more Children | 0 (0.0%) | 0 (0.0%) |
| Total | 25 (11.6%) | 169 (28.7%) |
Income Below Poverty Among Married-Couple vs Single-Parent Households in Wallington borough
The poverty data for Wallington borough shows that 119 of the married-couple family households (5.0%) and 194 of the single-parent households (24.2%) are living below the poverty level. Within the married-couple family households, those with no children have the highest poverty rate, with 60 households (5.1%) falling below the poverty line. Among the single-parent households, those with 1 or 2 children have the highest poverty rate, with 168 household (43.5%) living below poverty.
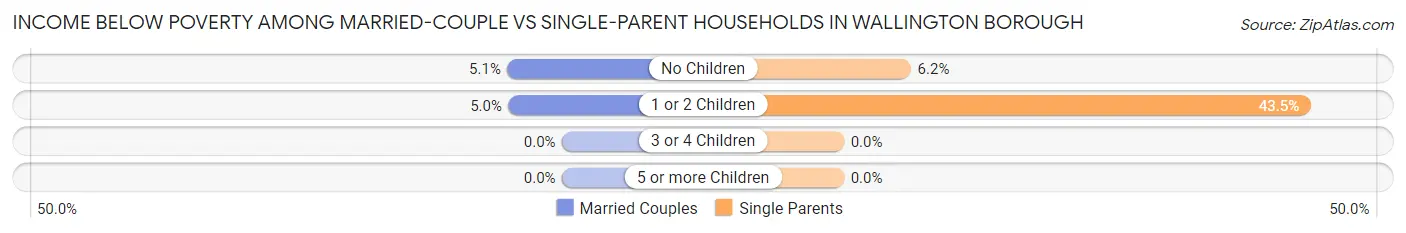
| Children | Married-Couple Families | Single-Parent Households |
| No Children | 60 (5.1%) | 26 (6.2%) |
| 1 or 2 Children | 59 (5.0%) | 168 (43.5%) |
| 3 or 4 Children | 0 (0.0%) | 0 (0.0%) |
| 5 or more Children | 0 (0.0%) | 0 (0.0%) |
| Total | 119 (5.0%) | 194 (24.2%) |
Race in Wallington borough
The most populous races in Wallington borough are White / Caucasian (8,756 | 74.0%), Hispanic or Latino (2,431 | 20.5%), and Two or more Races (1,136 | 9.6%).
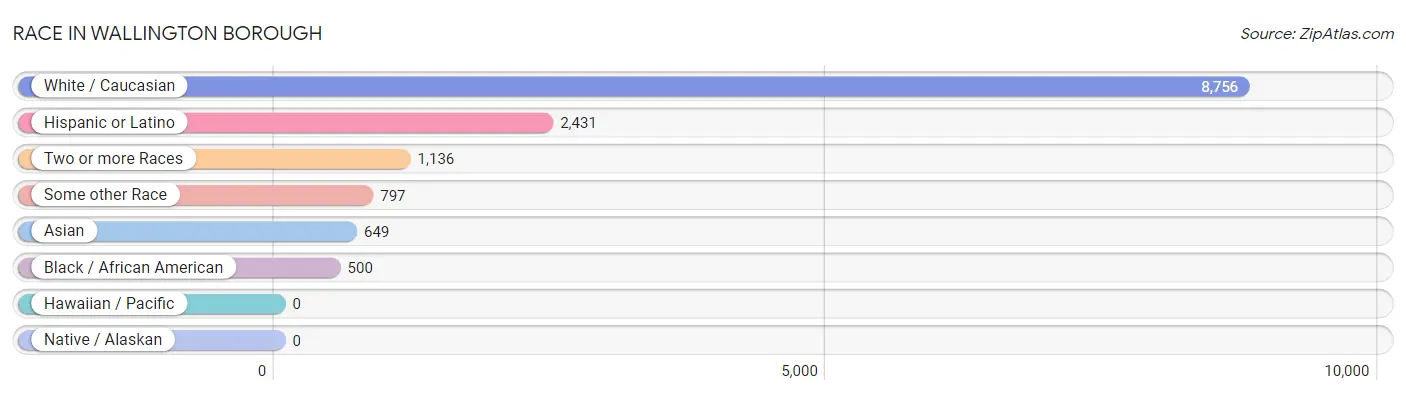
| Race | # Population | % Population |
| Asian | 649 | 5.5% |
| Black / African American | 500 | 4.2% |
| Hawaiian / Pacific | 0 | 0.0% |
| Hispanic or Latino | 2,431 | 20.5% |
| Native / Alaskan | 0 | 0.0% |
| White / Caucasian | 8,756 | 74.0% |
| Two or more Races | 1,136 | 9.6% |
| Some other Race | 797 | 6.7% |
| Total | 11,838 | 100.0% |
Ancestry in Wallington borough
The most populous ancestries reported in Wallington borough are Polish (4,394 | 37.1%), Irish (798 | 6.7%), Dominican (679 | 5.7%), Italian (656 | 5.5%), and South American (608 | 5.1%), together accounting for 60.3% of all Wallington borough residents.
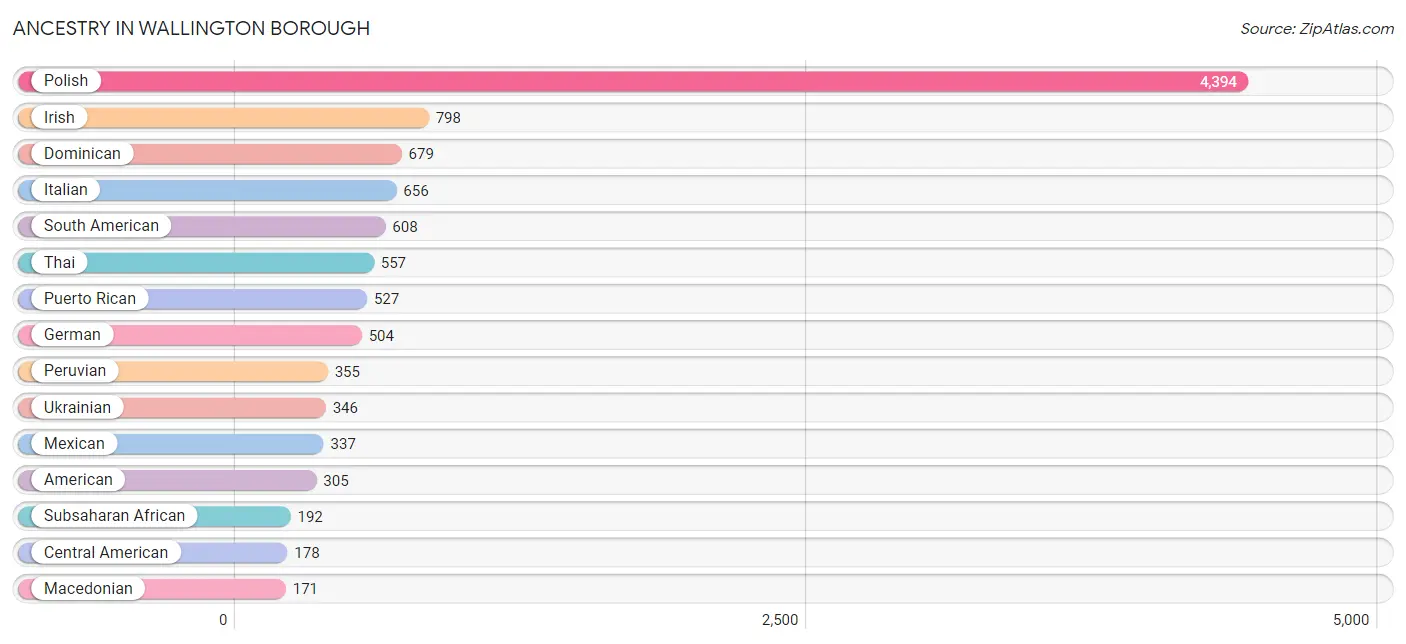
| Ancestry | # Population | % Population |
| African | 53 | 0.4% |
| Albanian | 61 | 0.5% |
| American | 305 | 2.6% |
| Arab | 123 | 1.0% |
| Armenian | 51 | 0.4% |
| Austrian | 9 | 0.1% |
| Bhutanese | 29 | 0.2% |
| Burmese | 16 | 0.1% |
| Central American | 178 | 1.5% |
| Colombian | 166 | 1.4% |
| Costa Rican | 49 | 0.4% |
| Cuban | 40 | 0.3% |
| Czech | 21 | 0.2% |
| Dominican | 679 | 5.7% |
| Dutch | 28 | 0.2% |
| Eastern European | 7 | 0.1% |
| Ecuadorian | 87 | 0.7% |
| Egyptian | 88 | 0.7% |
| English | 151 | 1.3% |
| European | 13 | 0.1% |
| French | 37 | 0.3% |
| German | 504 | 4.3% |
| Greek | 26 | 0.2% |
| Guamanian / Chamorro | 12 | 0.1% |
| Guatemalan | 10 | 0.1% |
| Honduran | 10 | 0.1% |
| Hungarian | 33 | 0.3% |
| Indian (Asian) | 14 | 0.1% |
| Irish | 798 | 6.7% |
| Israeli | 17 | 0.1% |
| Italian | 656 | 5.5% |
| Jamaican | 29 | 0.2% |
| Korean | 88 | 0.7% |
| Lebanese | 35 | 0.3% |
| Lithuanian | 41 | 0.4% |
| Macedonian | 171 | 1.4% |
| Mexican | 337 | 2.9% |
| Nigerian | 139 | 1.2% |
| Panamanian | 41 | 0.4% |
| Pennsylvania German | 9 | 0.1% |
| Peruvian | 355 | 3.0% |
| Polish | 4,394 | 37.1% |
| Portuguese | 32 | 0.3% |
| Puerto Rican | 527 | 4.4% |
| Russian | 102 | 0.9% |
| Salvadoran | 68 | 0.6% |
| Scottish | 25 | 0.2% |
| Serbian | 152 | 1.3% |
| Slavic | 6 | 0.1% |
| Slovak | 120 | 1.0% |
| South American | 608 | 5.1% |
| Spaniard | 27 | 0.2% |
| Sri Lankan | 15 | 0.1% |
| Subsaharan African | 192 | 1.6% |
| Swedish | 21 | 0.2% |
| Thai | 557 | 4.7% |
| Ukrainian | 346 | 2.9% |
| Yugoslavian | 58 | 0.5% | View All 58 Rows |
Immigrants in Wallington borough
The most numerous immigrant groups reported in Wallington borough came from Europe (3,960 | 33.5%), Eastern Europe (3,881 | 32.8%), Poland (2,938 | 24.8%), Latin America (909 | 7.7%), and Asia (638 | 5.4%), together accounting for 104.1% of all Wallington borough residents.
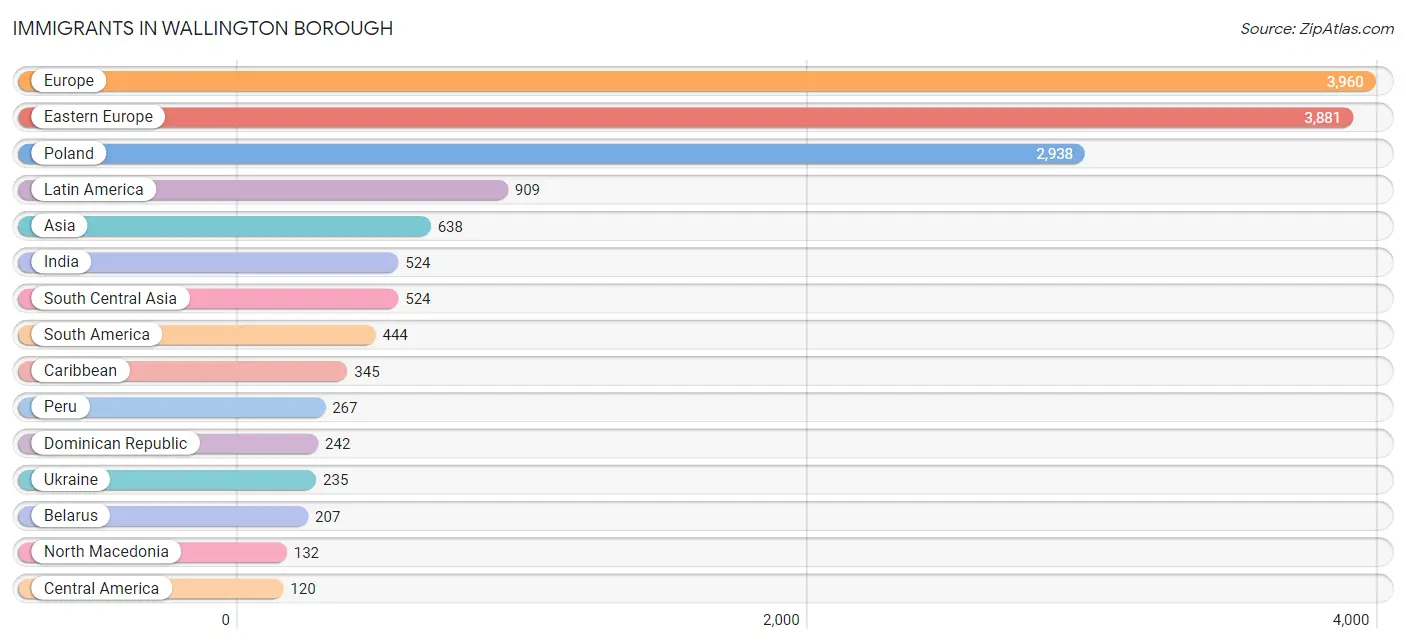
| Immigration Origin | # Population | % Population |
| Africa | 92 | 0.8% |
| Asia | 638 | 5.4% |
| Barbados | 24 | 0.2% |
| Belarus | 207 | 1.8% |
| Bosnia and Herzegovina | 58 | 0.5% |
| Caribbean | 345 | 2.9% |
| Central America | 120 | 1.0% |
| Colombia | 105 | 0.9% |
| Costa Rica | 49 | 0.4% |
| Cuba | 38 | 0.3% |
| Czechoslovakia | 46 | 0.4% |
| Dominica | 28 | 0.2% |
| Dominican Republic | 242 | 2.0% |
| Eastern Asia | 16 | 0.1% |
| Eastern Europe | 3,881 | 32.8% |
| Ecuador | 72 | 0.6% |
| Egypt | 65 | 0.5% |
| El Salvador | 13 | 0.1% |
| England | 18 | 0.2% |
| Europe | 3,960 | 33.5% |
| France | 11 | 0.1% |
| Germany | 34 | 0.3% |
| Guatemala | 10 | 0.1% |
| Hungary | 55 | 0.5% |
| India | 524 | 4.4% |
| Israel | 17 | 0.1% |
| Italy | 16 | 0.1% |
| Korea | 16 | 0.1% |
| Latin America | 909 | 7.7% |
| Lithuania | 17 | 0.1% |
| Mexico | 7 | 0.1% |
| North Macedonia | 132 | 1.1% |
| Northern Africa | 92 | 0.8% |
| Northern Europe | 18 | 0.2% |
| Panama | 41 | 0.4% |
| Peru | 267 | 2.3% |
| Philippines | 42 | 0.4% |
| Poland | 2,938 | 24.8% |
| Russia | 19 | 0.2% |
| Serbia | 80 | 0.7% |
| South America | 444 | 3.7% |
| South Central Asia | 524 | 4.4% |
| South Eastern Asia | 42 | 0.4% |
| Southern Europe | 16 | 0.1% |
| Trinidad and Tobago | 13 | 0.1% |
| Ukraine | 235 | 2.0% |
| Western Asia | 56 | 0.5% |
| Western Europe | 45 | 0.4% | View All 48 Rows |
Sex and Age in Wallington borough
Sex and Age in Wallington borough
The most populous age groups in Wallington borough are 30 to 34 Years (703 | 11.7%) for men and 25 to 29 Years (504 | 8.6%) for women.
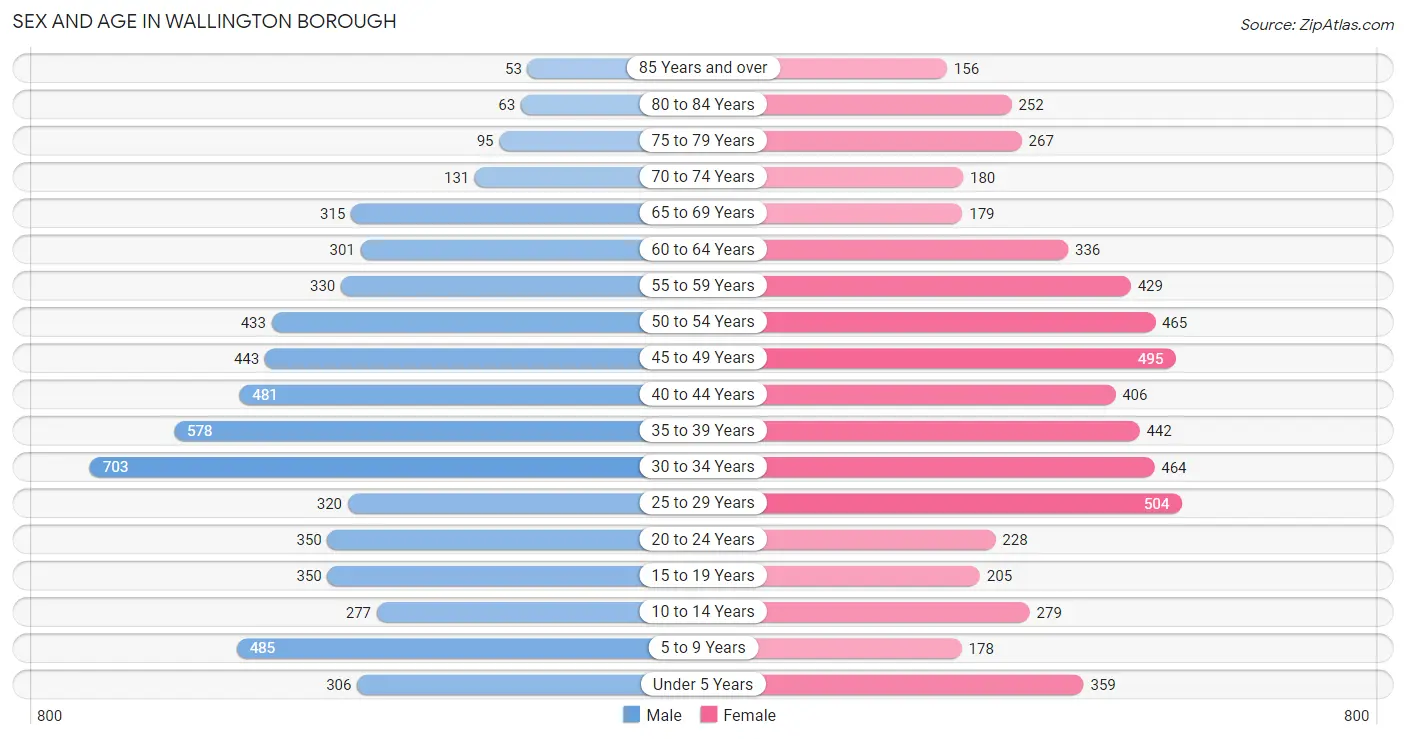
| Age Bracket | Male | Female |
| Under 5 Years | 306 (5.1%) | 359 (6.2%) |
| 5 to 9 Years | 485 (8.1%) | 178 (3.1%) |
| 10 to 14 Years | 277 (4.6%) | 279 (4.8%) |
| 15 to 19 Years | 350 (5.8%) | 205 (3.5%) |
| 20 to 24 Years | 350 (5.8%) | 228 (3.9%) |
| 25 to 29 Years | 320 (5.3%) | 504 (8.6%) |
| 30 to 34 Years | 703 (11.7%) | 464 (8.0%) |
| 35 to 39 Years | 578 (9.6%) | 442 (7.6%) |
| 40 to 44 Years | 481 (8.0%) | 406 (7.0%) |
| 45 to 49 Years | 443 (7.4%) | 495 (8.5%) |
| 50 to 54 Years | 433 (7.2%) | 465 (8.0%) |
| 55 to 59 Years | 330 (5.5%) | 429 (7.4%) |
| 60 to 64 Years | 301 (5.0%) | 336 (5.8%) |
| 65 to 69 Years | 315 (5.2%) | 179 (3.1%) |
| 70 to 74 Years | 131 (2.2%) | 180 (3.1%) |
| 75 to 79 Years | 95 (1.6%) | 267 (4.6%) |
| 80 to 84 Years | 63 (1.1%) | 252 (4.3%) |
| 85 Years and over | 53 (0.9%) | 156 (2.7%) |
| Total | 6,014 (100.0%) | 5,824 (100.0%) |
Families and Households in Wallington borough
Median Family Size in Wallington borough
The median family size in Wallington borough is 2.93 persons per family, with married-couple families (2,403 | 75.0%) accounting for the largest median family size of 3.05 persons per family. On the other hand, single male/father families (215 | 6.7%) represent the smallest median family size with 2.35 persons per family.
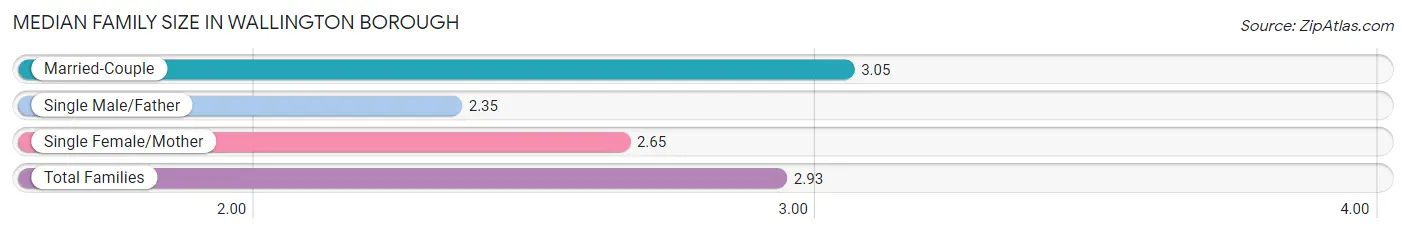
| Family Type | # Families | Family Size |
| Married-Couple | 2,403 (75.0%) | 3.05 |
| Single Male/Father | 215 (6.7%) | 2.35 |
| Single Female/Mother | 588 (18.3%) | 2.65 |
| Total Families | 3,206 (100.0%) | 2.93 |
Median Household Size in Wallington borough
The median household size in Wallington borough is 2.37 persons per household, with married-couple households (2,403 | 48.1%) accounting for the largest median household size of 3.08 persons per household. non-family households (1,788 | 35.8%) represent the smallest median household size with 1.24 persons per household.
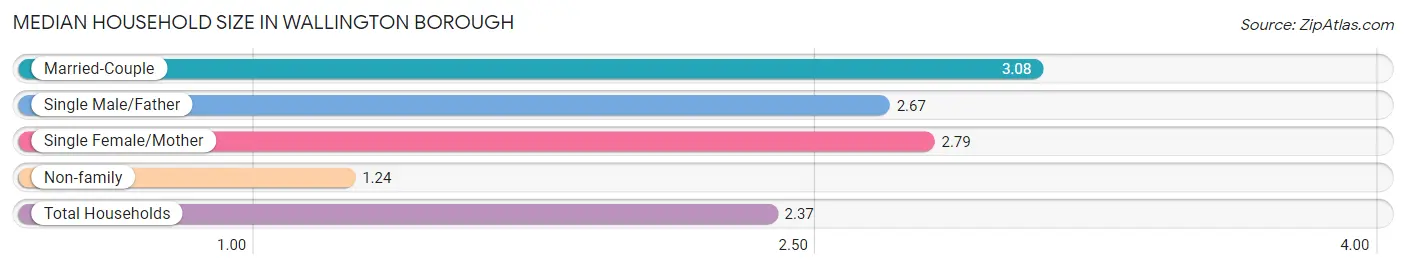
| Household Type | # Households | Household Size |
| Married-Couple | 2,403 (48.1%) | 3.08 |
| Single Male/Father | 215 (4.3%) | 2.67 |
| Single Female/Mother | 588 (11.8%) | 2.79 |
| Non-family | 1,788 (35.8%) | 1.24 |
| Total Households | 4,994 (100.0%) | 2.37 |
Household Size by Marriage Status in Wallington borough
Out of a total of 4,994 households in Wallington borough, 3,206 (64.2%) are family households, while 1,788 (35.8%) are nonfamily households. The most numerous type of family households are 3-person households, comprising 1,418, and the most common type of nonfamily households are 1-person households, comprising 1,447.
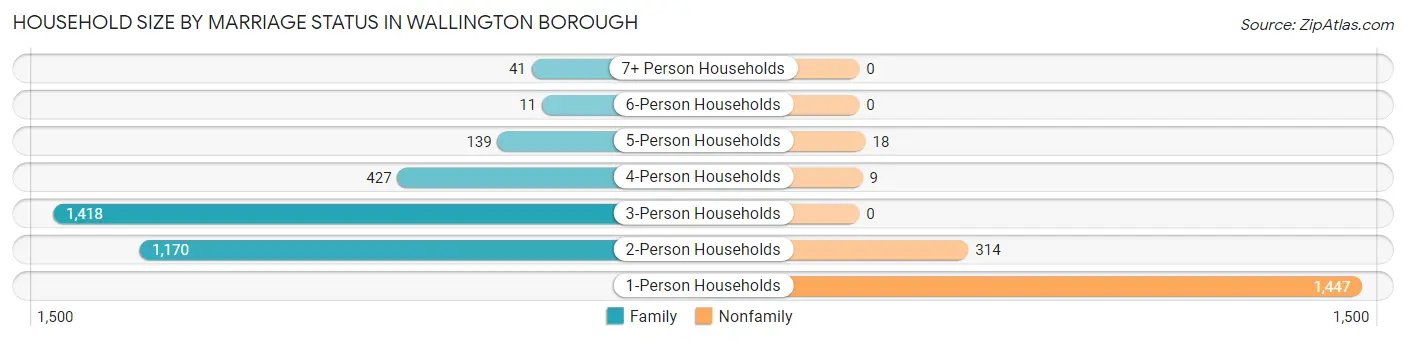
| Household Size | Family Households | Nonfamily Households |
| 1-Person Households | - | 1,447 (29.0%) |
| 2-Person Households | 1,170 (23.4%) | 314 (6.3%) |
| 3-Person Households | 1,418 (28.4%) | 0 (0.0%) |
| 4-Person Households | 427 (8.6%) | 9 (0.2%) |
| 5-Person Households | 139 (2.8%) | 18 (0.4%) |
| 6-Person Households | 11 (0.2%) | 0 (0.0%) |
| 7+ Person Households | 41 (0.8%) | 0 (0.0%) |
| Total | 3,206 (64.2%) | 1,788 (35.8%) |
Female Fertility in Wallington borough
Fertility by Age in Wallington borough
Average fertility rate in Wallington borough is 77.0 births per 1,000 women. Women in the age bracket of 20 to 34 years have the highest fertility rate with 99.0 births per 1,000 women. Women in the age bracket of 20 to 34 years acount for 54.1% of all women with births.
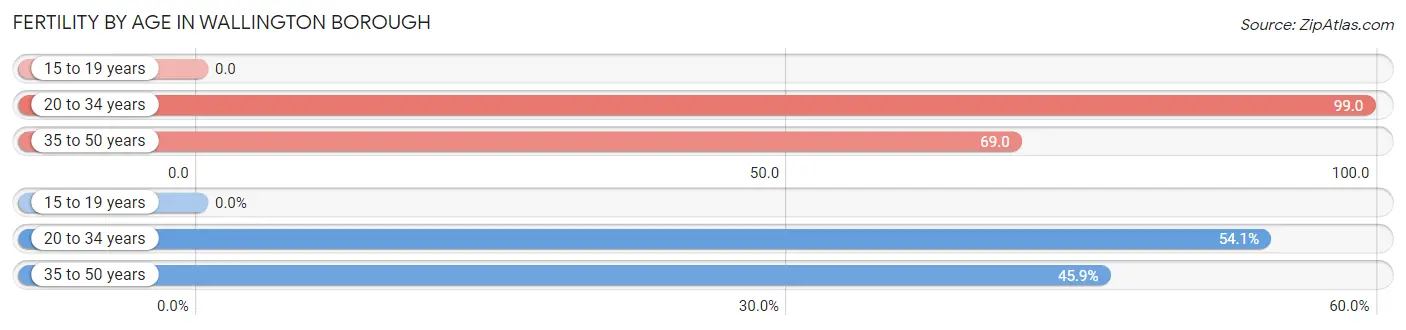
| Age Bracket | Women with Births | Births / 1,000 Women |
| 15 to 19 years | 0 (0.0%) | 0.0 |
| 20 to 34 years | 119 (54.1%) | 99.0 |
| 35 to 50 years | 101 (45.9%) | 69.0 |
| Total | 220 (100.0%) | 77.0 |
Fertility by Age by Marriage Status in Wallington borough
65.0% of women with births (220) in Wallington borough are married. The highest percentage of unmarried women with births falls into 35 to 50 years age bracket with 51.5% of them unmarried at the time of birth, while the lowest percentage of unmarried women with births belong to 20 to 34 years age bracket with 21.0% of them unmarried.
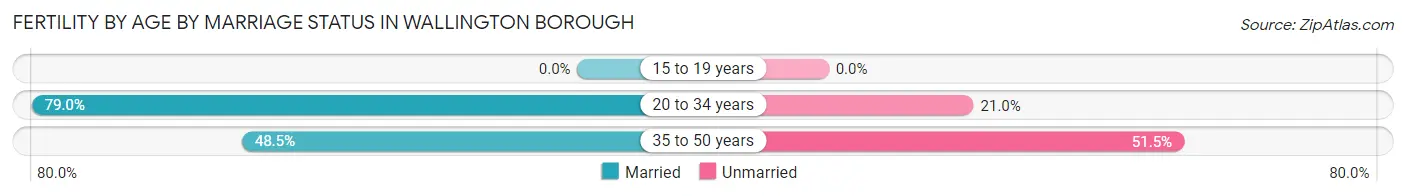
| Age Bracket | Married | Unmarried |
| 15 to 19 years | 0 (0.0%) | 0 (0.0%) |
| 20 to 34 years | 94 (79.0%) | 25 (21.0%) |
| 35 to 50 years | 49 (48.5%) | 52 (51.5%) |
| Total | 143 (65.0%) | 77 (35.0%) |
Fertility by Education in Wallington borough
Average fertility rate in Wallington borough is 77.0 births per 1,000 women. Women with the education attainment of bachelor's degree have the highest fertility rate of 125.0 births per 1,000 women, while women with the education attainment of less than high school have the lowest fertility at 29.0 births per 1,000 women. Women with the education attainment of bachelor's degree represent 55.9% of all women with births.
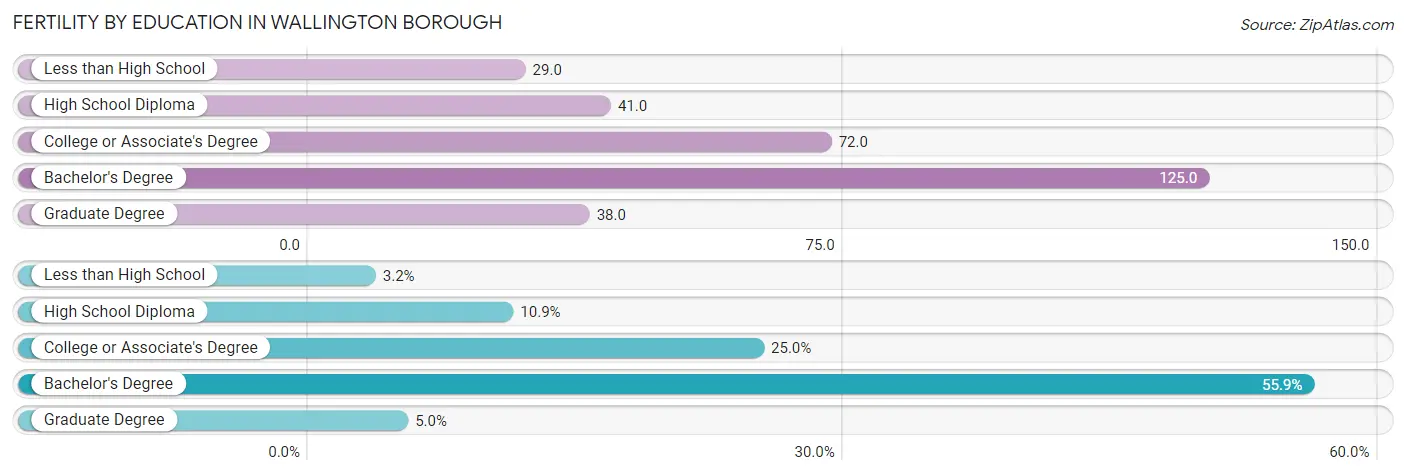
| Educational Attainment | Women with Births | Births / 1,000 Women |
| Less than High School | 7 (3.2%) | 29.0 |
| High School Diploma | 24 (10.9%) | 41.0 |
| College or Associate's Degree | 55 (25.0%) | 72.0 |
| Bachelor's Degree | 123 (55.9%) | 125.0 |
| Graduate Degree | 11 (5.0%) | 38.0 |
| Total | 220 (100.0%) | 77.0 |
Fertility by Education by Marriage Status in Wallington borough
35.0% of women with births in Wallington borough are unmarried. Women with the educational attainment of less than high school are most likely to be married with 100.0% of them married at childbirth, while women with the educational attainment of college or associate's degree are least likely to be married with 100.0% of them unmarried at childbirth.
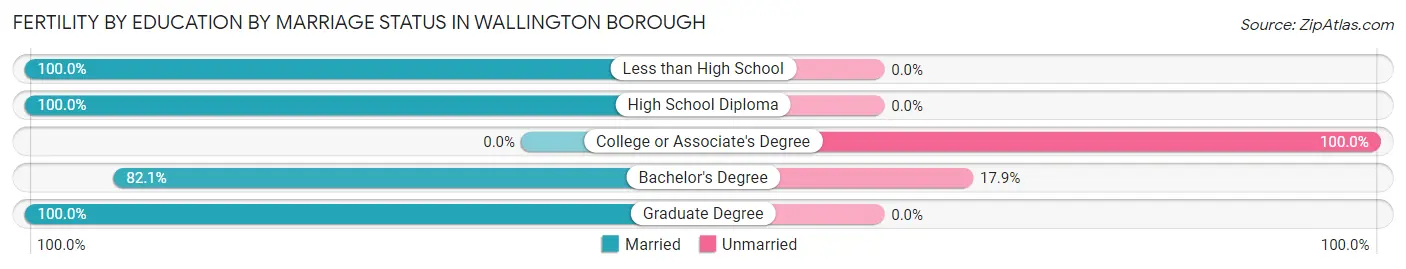
| Educational Attainment | Married | Unmarried |
| Less than High School | 7 (100.0%) | 0 (0.0%) |
| High School Diploma | 24 (100.0%) | 0 (0.0%) |
| College or Associate's Degree | 0 (0.0%) | 55 (100.0%) |
| Bachelor's Degree | 101 (82.1%) | 22 (17.9%) |
| Graduate Degree | 11 (100.0%) | 0 (0.0%) |
| Total | 143 (65.0%) | 77 (35.0%) |
Employment Characteristics in Wallington borough
Employment by Class of Employer in Wallington borough
Among the 5,766 employed individuals in Wallington borough, private company employees (4,319 | 74.9%), self-employed (not incorporated) (439 | 7.6%), and local government employees (368 | 6.4%) make up the most common classes of employment.
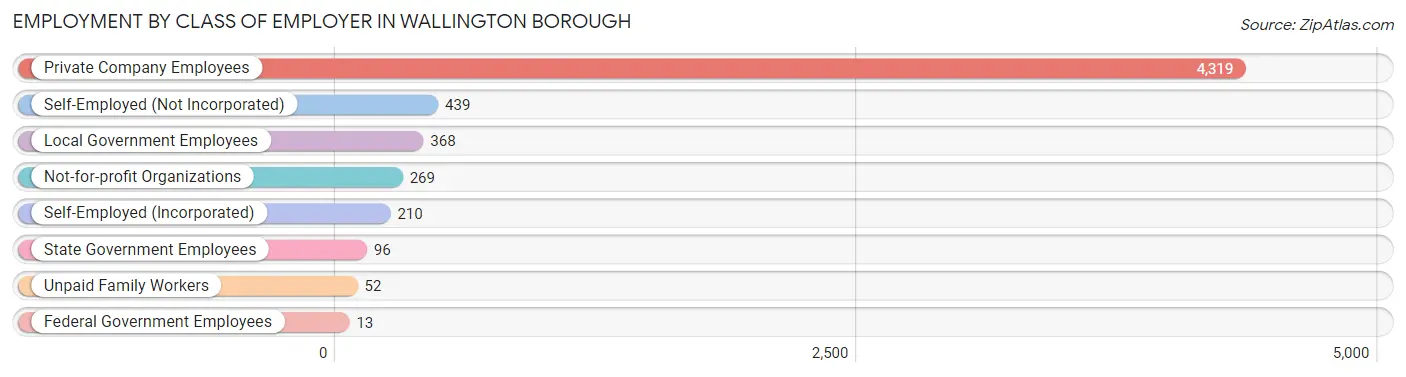
| Employer Class | # Employees | % Employees |
| Private Company Employees | 4,319 | 74.9% |
| Self-Employed (Incorporated) | 210 | 3.6% |
| Self-Employed (Not Incorporated) | 439 | 7.6% |
| Not-for-profit Organizations | 269 | 4.7% |
| Local Government Employees | 368 | 6.4% |
| State Government Employees | 96 | 1.7% |
| Federal Government Employees | 13 | 0.2% |
| Unpaid Family Workers | 52 | 0.9% |
| Total | 5,766 | 100.0% |
Employment Status by Age in Wallington borough
According to the labor force statistics for Wallington borough, out of the total population over 16 years of age (9,846), 66.4% or 6,538 individuals are in the labor force, with 7.6% or 497 of them unemployed. The age group with the highest labor force participation rate is 45 to 54 years, with 85.8% or 1,575 individuals in the labor force. Within the labor force, the 75 years and over age range has the highest percentage of unemployed individuals, with 16.3% or 7 of them being unemployed.
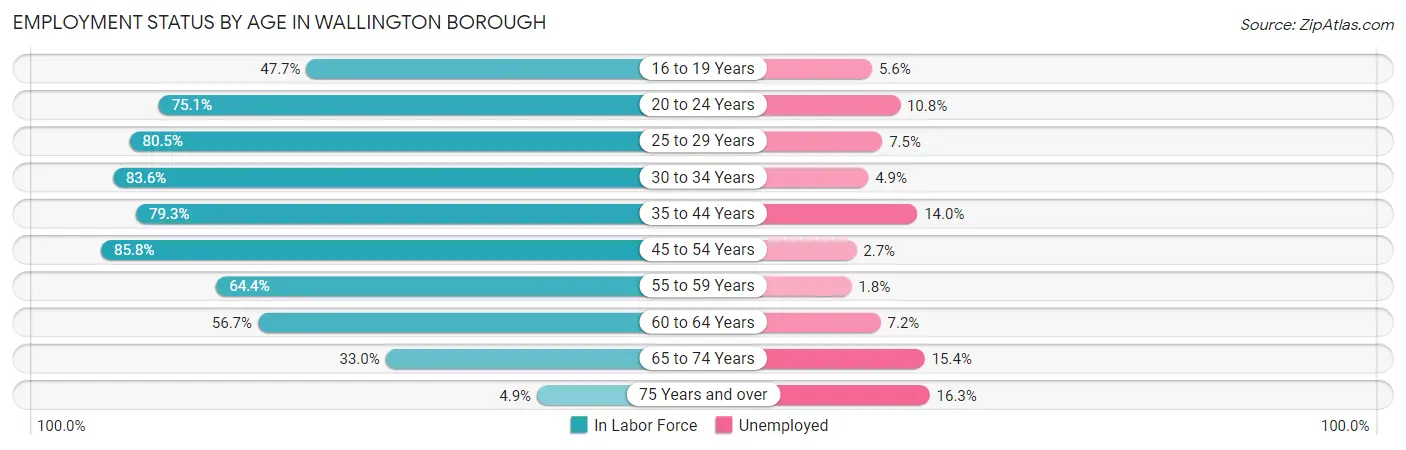
| Age Bracket | In Labor Force | Unemployed |
| 16 to 19 Years | 213 (47.7%) | 12 (5.6%) |
| 20 to 24 Years | 434 (75.1%) | 47 (10.8%) |
| 25 to 29 Years | 663 (80.5%) | 50 (7.5%) |
| 30 to 34 Years | 976 (83.6%) | 48 (4.9%) |
| 35 to 44 Years | 1,512 (79.3%) | 212 (14.0%) |
| 45 to 54 Years | 1,575 (85.8%) | 43 (2.7%) |
| 55 to 59 Years | 489 (64.4%) | 9 (1.8%) |
| 60 to 64 Years | 361 (56.7%) | 26 (7.2%) |
| 65 to 74 Years | 266 (33.0%) | 41 (15.4%) |
| 75 Years and over | 43 (4.9%) | 7 (16.3%) |
| Total | 6,538 (66.4%) | 497 (7.6%) |
Employment Status by Educational Attainment in Wallington borough
According to labor force statistics for Wallington borough, 78.2% of individuals (5,576) out of the total population between 25 and 64 years of age (7,130) are in the labor force, with 6.9% or 385 of them being unemployed. The group with the highest labor force participation rate are those with the educational attainment of bachelor's degree or higher, with 84.4% or 2,309 individuals in the labor force. Within the labor force, individuals with high school diploma education have the highest percentage of unemployment, with 15.6% or 239 of them being unemployed.
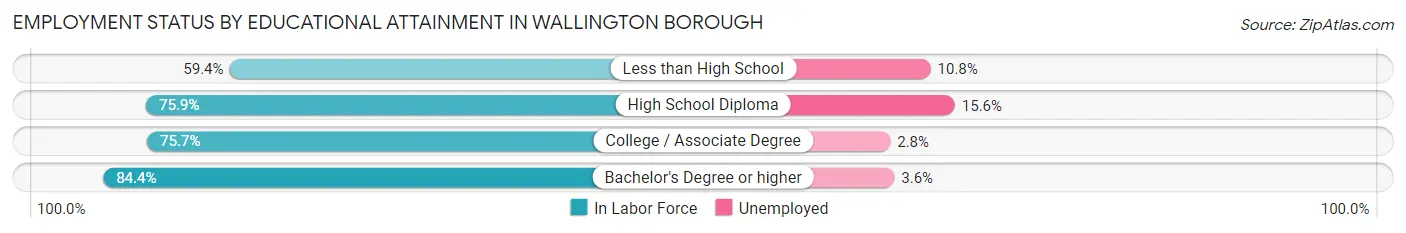
| Educational Attainment | In Labor Force | Unemployed |
| Less than High School | 222 (59.4%) | 40 (10.8%) |
| High School Diploma | 1,534 (75.9%) | 315 (15.6%) |
| College / Associate Degree | 1,513 (75.7%) | 56 (2.8%) |
| Bachelor's Degree or higher | 2,309 (84.4%) | 98 (3.6%) |
| Total | 5,576 (78.2%) | 492 (6.9%) |
Employment Occupations by Sex in Wallington borough
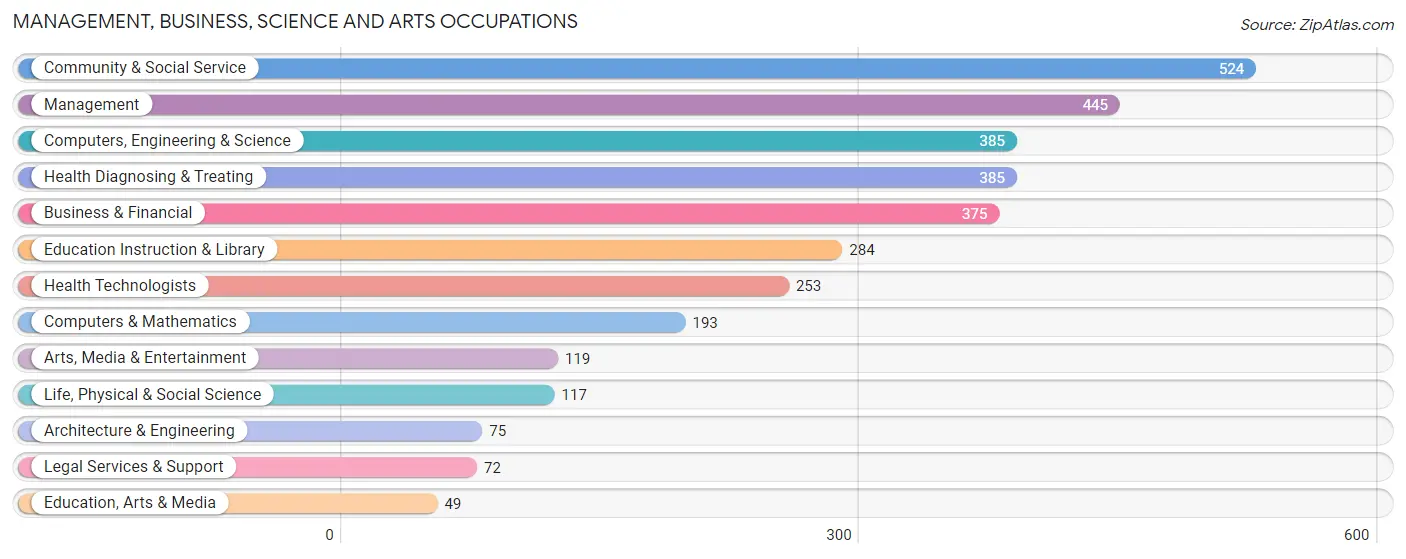
Management, Business, Science and Arts Occupations
The most common Management, Business, Science and Arts occupations in Wallington borough are Community & Social Service (524 | 8.7%), Management (445 | 7.4%), Computers, Engineering & Science (385 | 6.4%), Health Diagnosing & Treating (385 | 6.4%), and Business & Financial (375 | 6.2%).
Management, Business, Science and Arts Occupations by Sex
Within the Management, Business, Science and Arts occupations in Wallington borough, the most male-oriented occupations are Architecture & Engineering (84.0%), Arts, Media & Entertainment (71.4%), and Business & Financial (66.9%), while the most female-oriented occupations are Education, Arts & Media (100.0%), Health Technologists (91.7%), and Life, Physical & Social Science (88.9%).
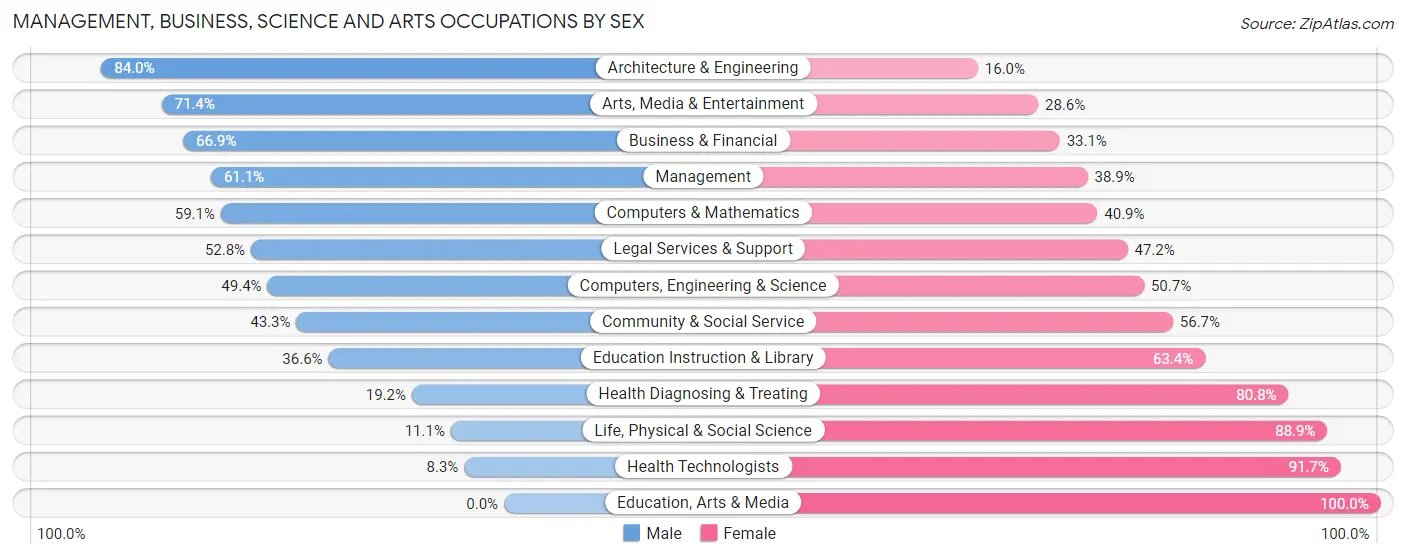
| Occupation | Male | Female |
| Management | 272 (61.1%) | 173 (38.9%) |
| Business & Financial | 251 (66.9%) | 124 (33.1%) |
| Computers, Engineering & Science | 190 (49.3%) | 195 (50.6%) |
| Computers & Mathematics | 114 (59.1%) | 79 (40.9%) |
| Architecture & Engineering | 63 (84.0%) | 12 (16.0%) |
| Life, Physical & Social Science | 13 (11.1%) | 104 (88.9%) |
| Community & Social Service | 227 (43.3%) | 297 (56.7%) |
| Education, Arts & Media | 0 (0.0%) | 49 (100.0%) |
| Legal Services & Support | 38 (52.8%) | 34 (47.2%) |
| Education Instruction & Library | 104 (36.6%) | 180 (63.4%) |
| Arts, Media & Entertainment | 85 (71.4%) | 34 (28.6%) |
| Health Diagnosing & Treating | 74 (19.2%) | 311 (80.8%) |
| Health Technologists | 21 (8.3%) | 232 (91.7%) |
| Total (Category) | 1,014 (48.0%) | 1,100 (52.0%) |
| Total (Overall) | 3,324 (55.0%) | 2,715 (45.0%) |
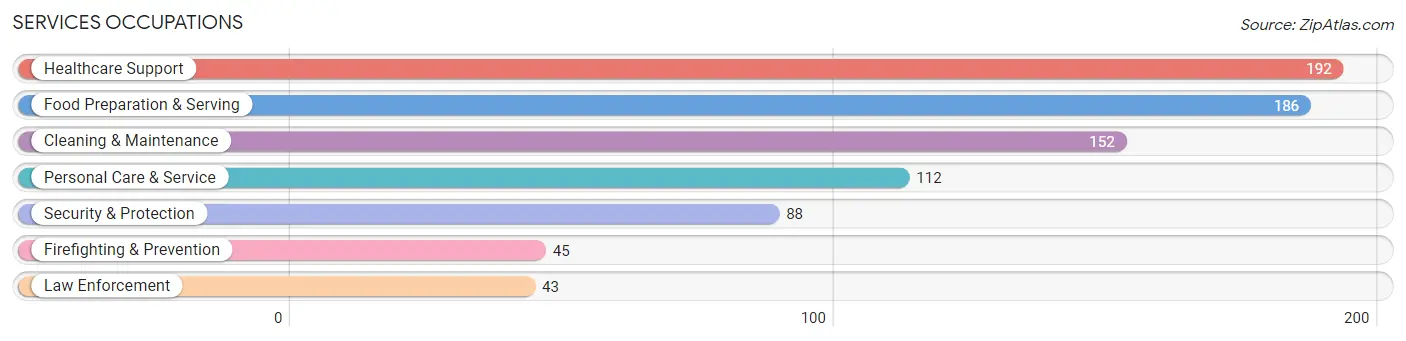
Services Occupations
The most common Services occupations in Wallington borough are Healthcare Support (192 | 3.2%), Food Preparation & Serving (186 | 3.1%), Cleaning & Maintenance (152 | 2.5%), Personal Care & Service (112 | 1.8%), and Security & Protection (88 | 1.5%).
Services Occupations by Sex
Within the Services occupations in Wallington borough, the most male-oriented occupations are Firefighting & Prevention (100.0%), Security & Protection (92.0%), and Law Enforcement (83.7%), while the most female-oriented occupations are Healthcare Support (81.2%), Personal Care & Service (72.3%), and Cleaning & Maintenance (63.2%).
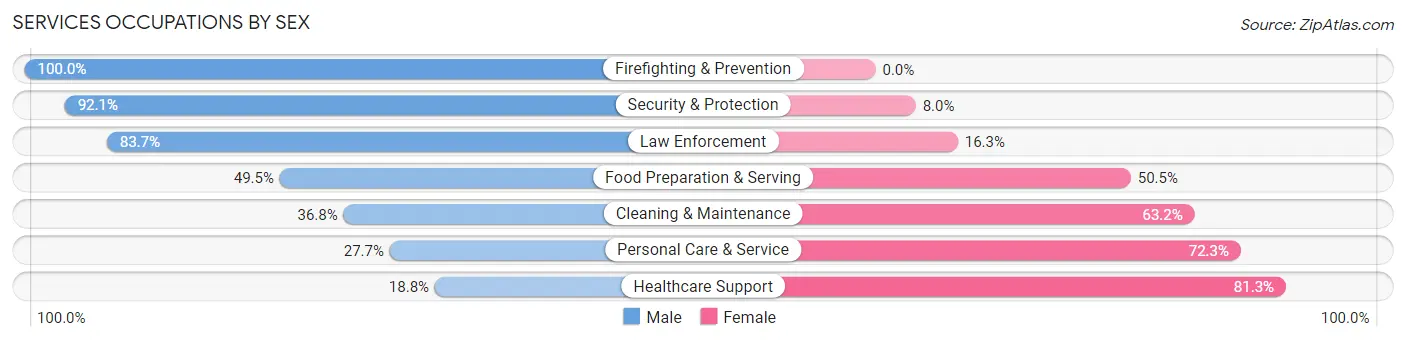
| Occupation | Male | Female |
| Healthcare Support | 36 (18.8%) | 156 (81.2%) |
| Security & Protection | 81 (92.0%) | 7 (8.0%) |
| Firefighting & Prevention | 45 (100.0%) | 0 (0.0%) |
| Law Enforcement | 36 (83.7%) | 7 (16.3%) |
| Food Preparation & Serving | 92 (49.5%) | 94 (50.5%) |
| Cleaning & Maintenance | 56 (36.8%) | 96 (63.2%) |
| Personal Care & Service | 31 (27.7%) | 81 (72.3%) |
| Total (Category) | 296 (40.6%) | 434 (59.5%) |
| Total (Overall) | 3,324 (55.0%) | 2,715 (45.0%) |
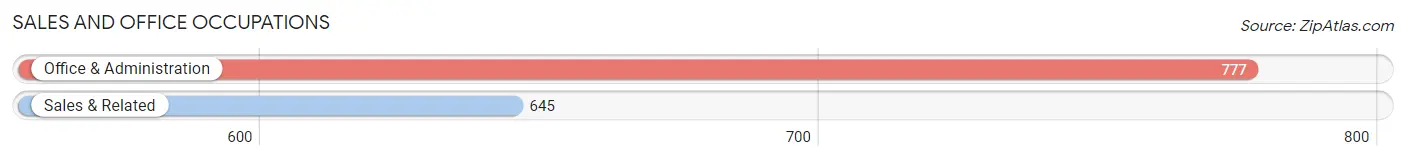
Sales and Office Occupations
The most common Sales and Office occupations in Wallington borough are Office & Administration (777 | 12.9%), and Sales & Related (645 | 10.7%).
Sales and Office Occupations by Sex
| Occupation | Male | Female |
| Sales & Related | 351 (54.4%) | 294 (45.6%) |
| Office & Administration | 215 (27.7%) | 562 (72.3%) |
| Total (Category) | 566 (39.8%) | 856 (60.2%) |
| Total (Overall) | 3,324 (55.0%) | 2,715 (45.0%) |
Natural Resources, Construction and Maintenance Occupations
The most common Natural Resources, Construction and Maintenance occupations in Wallington borough are Construction & Extraction (676 | 11.2%), Installation, Maintenance & Repair (222 | 3.7%), and Farming, Fishing & Forestry (5 | 0.1%).
Natural Resources, Construction and Maintenance Occupations by Sex
| Occupation | Male | Female |
| Farming, Fishing & Forestry | 5 (100.0%) | 0 (0.0%) |
| Construction & Extraction | 669 (99.0%) | 7 (1.0%) |
| Installation, Maintenance & Repair | 222 (100.0%) | 0 (0.0%) |
| Total (Category) | 896 (99.2%) | 7 (0.8%) |
| Total (Overall) | 3,324 (55.0%) | 2,715 (45.0%) |
Production, Transportation and Moving Occupations
The most common Production, Transportation and Moving occupations in Wallington borough are Transportation (303 | 5.0%), Production (299 | 5.0%), and Material Moving (268 | 4.4%).
Production, Transportation and Moving Occupations by Sex
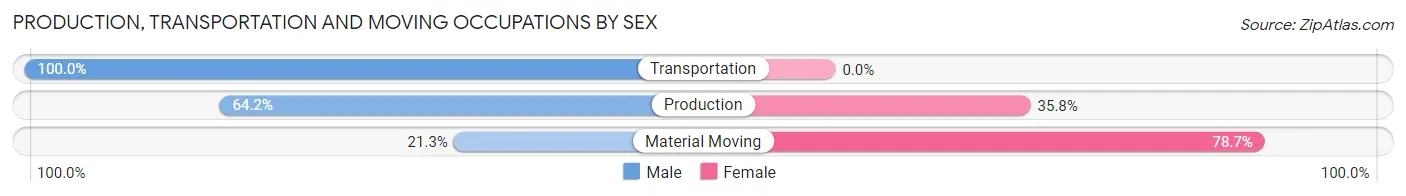
| Occupation | Male | Female |
| Production | 192 (64.2%) | 107 (35.8%) |
| Transportation | 303 (100.0%) | 0 (0.0%) |
| Material Moving | 57 (21.3%) | 211 (78.7%) |
| Total (Category) | 552 (63.4%) | 318 (36.5%) |
| Total (Overall) | 3,324 (55.0%) | 2,715 (45.0%) |
Employment Industries by Sex in Wallington borough
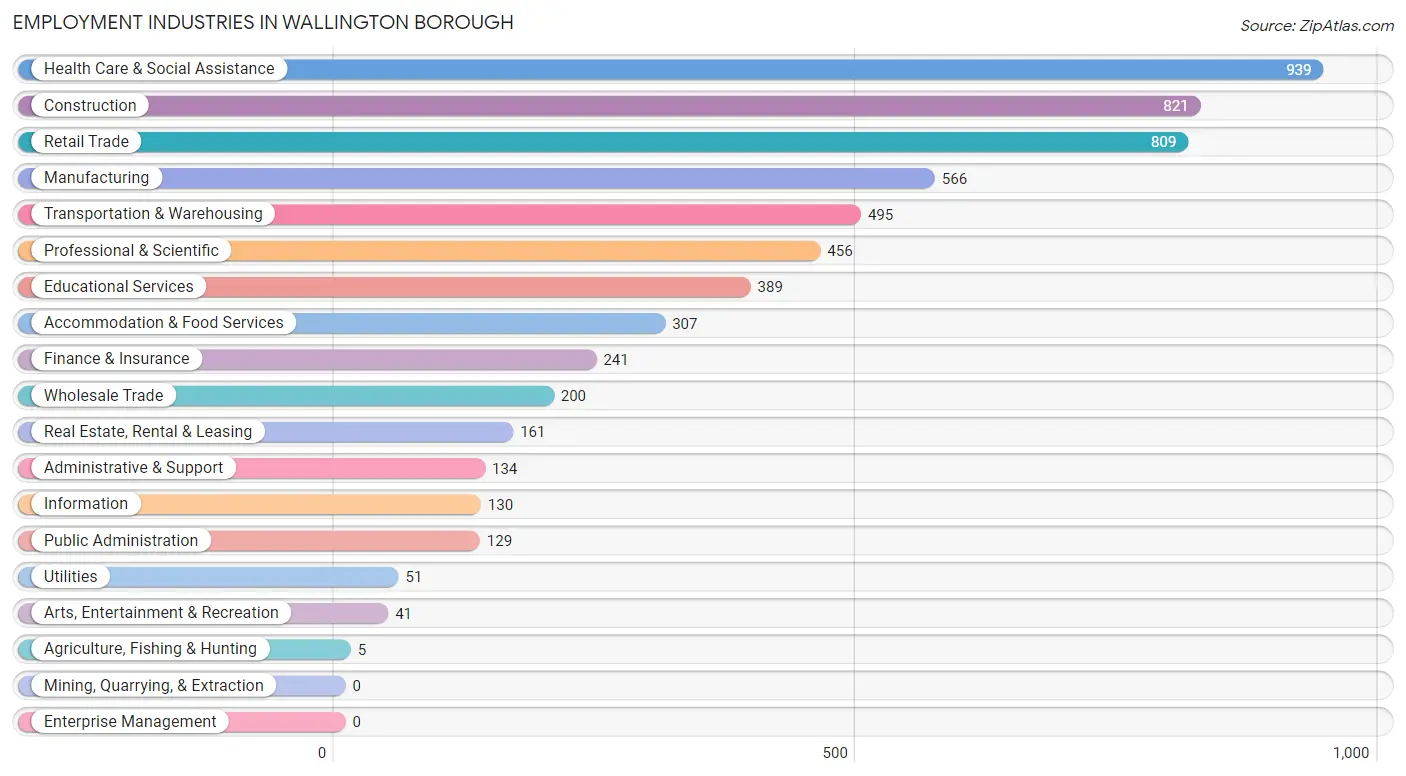
Employment Industries in Wallington borough
The major employment industries in Wallington borough include Health Care & Social Assistance (939 | 15.5%), Construction (821 | 13.6%), Retail Trade (809 | 13.4%), Manufacturing (566 | 9.4%), and Transportation & Warehousing (495 | 8.2%).
Employment Industries by Sex in Wallington borough
The Wallington borough industries that see more men than women are Agriculture, Fishing & Hunting (100.0%), Utilities (100.0%), and Construction (93.1%), whereas the industries that tend to have a higher number of women are Health Care & Social Assistance (87.9%), Arts, Entertainment & Recreation (80.5%), and Retail Trade (56.6%).
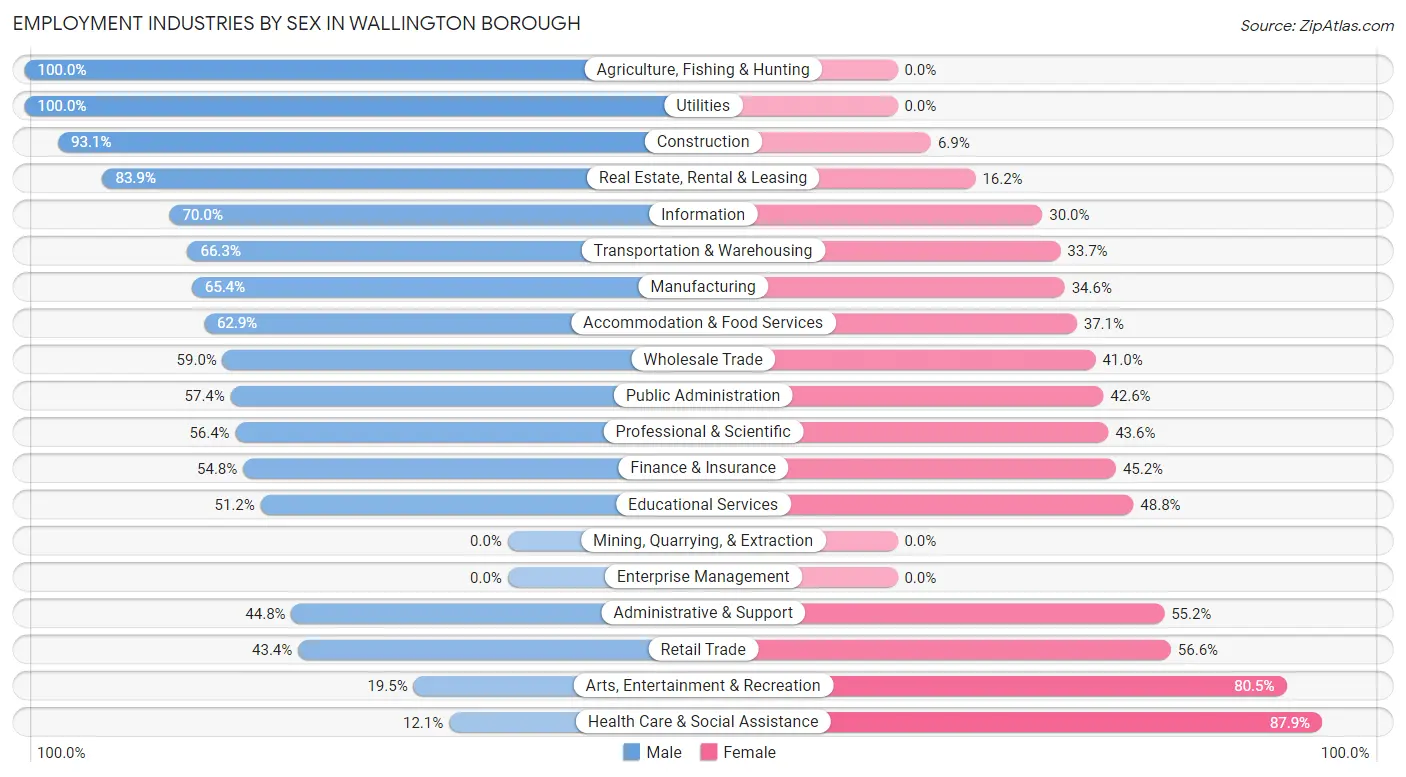
| Industry | Male | Female |
| Agriculture, Fishing & Hunting | 5 (100.0%) | 0 (0.0%) |
| Mining, Quarrying, & Extraction | 0 (0.0%) | 0 (0.0%) |
| Construction | 764 (93.1%) | 57 (6.9%) |
| Manufacturing | 370 (65.4%) | 196 (34.6%) |
| Wholesale Trade | 118 (59.0%) | 82 (41.0%) |
| Retail Trade | 351 (43.4%) | 458 (56.6%) |
| Transportation & Warehousing | 328 (66.3%) | 167 (33.7%) |
| Utilities | 51 (100.0%) | 0 (0.0%) |
| Information | 91 (70.0%) | 39 (30.0%) |
| Finance & Insurance | 132 (54.8%) | 109 (45.2%) |
| Real Estate, Rental & Leasing | 135 (83.9%) | 26 (16.2%) |
| Professional & Scientific | 257 (56.4%) | 199 (43.6%) |
| Enterprise Management | 0 (0.0%) | 0 (0.0%) |
| Administrative & Support | 60 (44.8%) | 74 (55.2%) |
| Educational Services | 199 (51.2%) | 190 (48.8%) |
| Health Care & Social Assistance | 114 (12.1%) | 825 (87.9%) |
| Arts, Entertainment & Recreation | 8 (19.5%) | 33 (80.5%) |
| Accommodation & Food Services | 193 (62.9%) | 114 (37.1%) |
| Public Administration | 74 (57.4%) | 55 (42.6%) |
| Total | 3,324 (55.0%) | 2,715 (45.0%) |
Education in Wallington borough
School Enrollment in Wallington borough
The most common levels of schooling among the 2,199 students in Wallington borough are high school (535 | 24.3%), elementary school (527 | 24.0%), and college / undergraduate (483 | 22.0%).
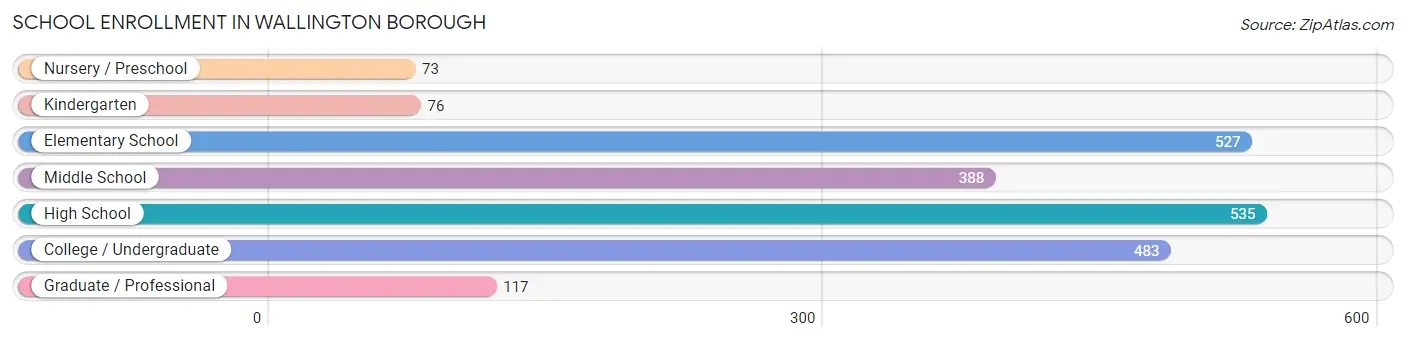
| School Level | # Students | % Students |
| Nursery / Preschool | 73 | 3.3% |
| Kindergarten | 76 | 3.5% |
| Elementary School | 527 | 24.0% |
| Middle School | 388 | 17.6% |
| High School | 535 | 24.3% |
| College / Undergraduate | 483 | 22.0% |
| Graduate / Professional | 117 | 5.3% |
| Total | 2,199 | 100.0% |
School Enrollment by Age by Funding Source in Wallington borough
Out of a total of 2,199 students who are enrolled in schools in Wallington borough, 226 (10.3%) attend a private institution, while the remaining 1,973 (89.7%) are enrolled in public schools. The age group of 20 to 24 year olds has the highest likelihood of being enrolled in private schools, with 70 (36.6% in the age bracket) enrolled. Conversely, the age group of 5 to 9 year old has the lowest likelihood of being enrolled in a private school, with 598 (100.0% in the age bracket) attending a public institution.
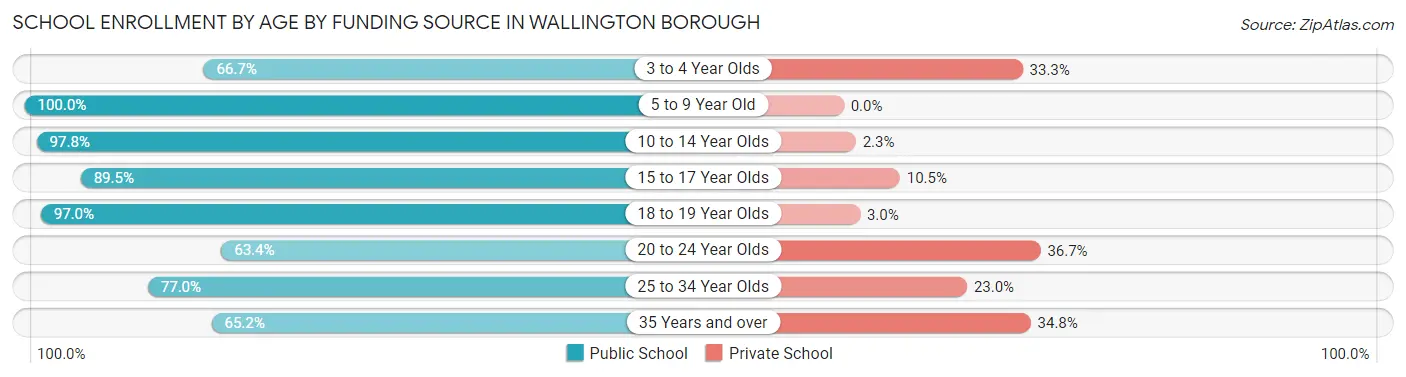
| Age Bracket | Public School | Private School |
| 3 to 4 Year Olds | 30 (66.7%) | 15 (33.3%) |
| 5 to 9 Year Old | 598 (100.0%) | 0 (0.0%) |
| 10 to 14 Year Olds | 521 (97.8%) | 12 (2.2%) |
| 15 to 17 Year Olds | 351 (89.5%) | 41 (10.5%) |
| 18 to 19 Year Olds | 128 (97.0%) | 4 (3.0%) |
| 20 to 24 Year Olds | 121 (63.3%) | 70 (36.6%) |
| 25 to 34 Year Olds | 151 (77.0%) | 45 (23.0%) |
| 35 Years and over | 73 (65.2%) | 39 (34.8%) |
| Total | 1,973 (89.7%) | 226 (10.3%) |
Educational Attainment by Field of Study in Wallington borough
Business (740 | 21.6%), education (673 | 19.7%), computers & mathematics (339 | 9.9%), engineering (286 | 8.4%), and science & technology (224 | 6.6%) are the most common fields of study among 3,422 individuals in Wallington borough who have obtained a bachelor's degree or higher.
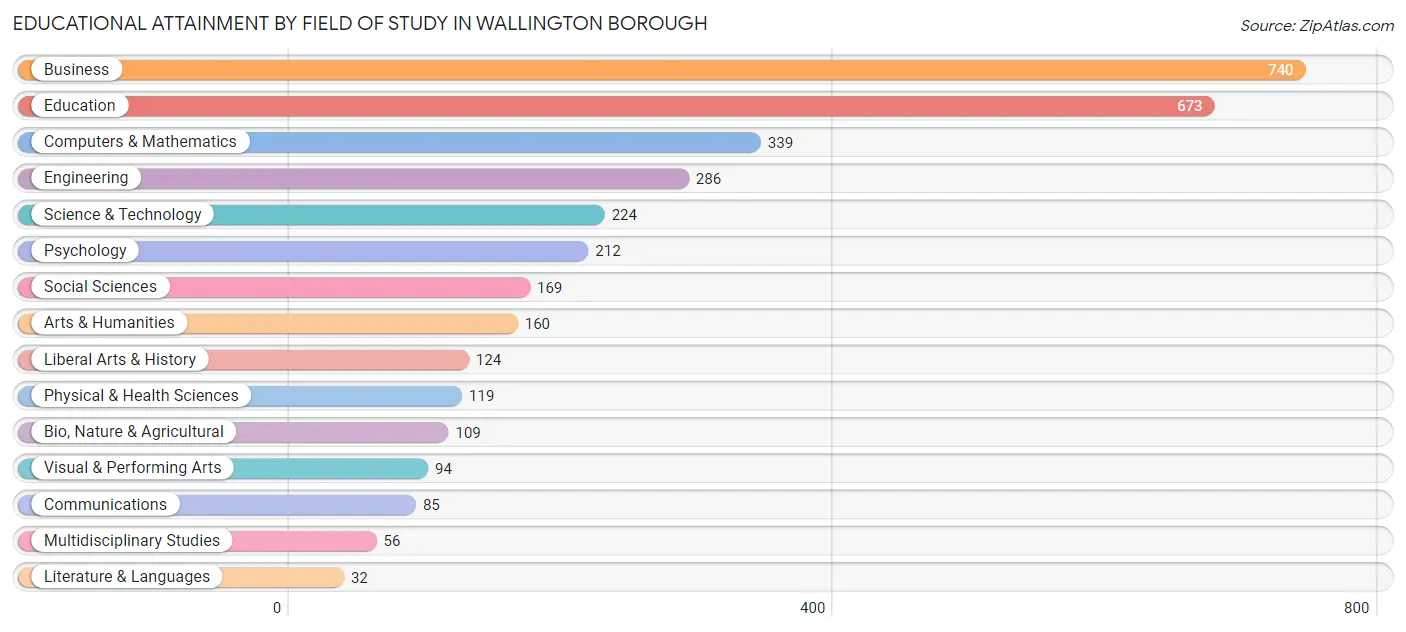
| Field of Study | # Graduates | % Graduates |
| Computers & Mathematics | 339 | 9.9% |
| Bio, Nature & Agricultural | 109 | 3.2% |
| Physical & Health Sciences | 119 | 3.5% |
| Psychology | 212 | 6.2% |
| Social Sciences | 169 | 4.9% |
| Engineering | 286 | 8.4% |
| Multidisciplinary Studies | 56 | 1.6% |
| Science & Technology | 224 | 6.6% |
| Business | 740 | 21.6% |
| Education | 673 | 19.7% |
| Literature & Languages | 32 | 0.9% |
| Liberal Arts & History | 124 | 3.6% |
| Visual & Performing Arts | 94 | 2.8% |
| Communications | 85 | 2.5% |
| Arts & Humanities | 160 | 4.7% |
| Total | 3,422 | 100.0% |
Transportation & Commute in Wallington borough
Vehicle Availability by Sex in Wallington borough
The most prevalent vehicle ownership categories in Wallington borough are males with 2 vehicles (1,587, accounting for 49.1%) and females with 2 vehicles (1,049, making up 62.8%).
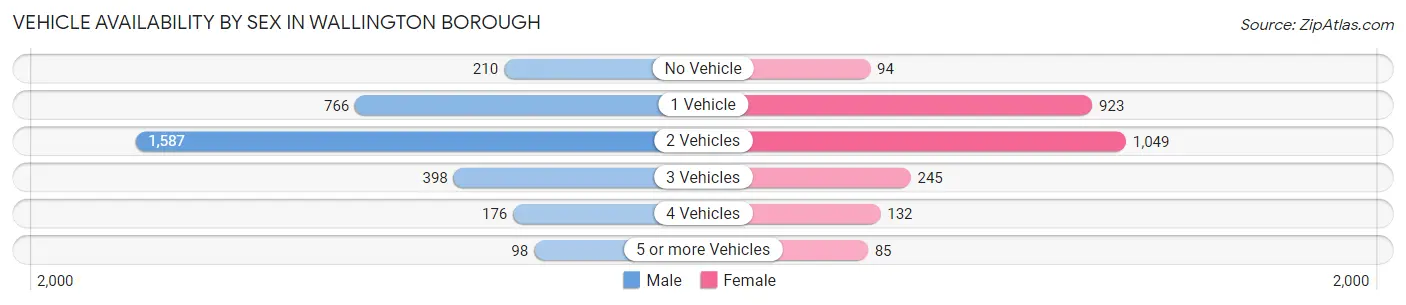
| Vehicles Available | Male | Female |
| No Vehicle | 210 (6.5%) | 94 (3.7%) |
| 1 Vehicle | 766 (23.7%) | 923 (36.5%) |
| 2 Vehicles | 1,587 (49.1%) | 1,049 (41.5%) |
| 3 Vehicles | 398 (12.3%) | 245 (9.7%) |
| 4 Vehicles | 176 (5.4%) | 132 (5.2%) |
| 5 or more Vehicles | 98 (3.0%) | 85 (3.4%) |
| Total | 3,235 (100.0%) | 2,528 (100.0%) |
Commute Time in Wallington borough
The most frequently occuring commute durations in Wallington borough are 30 to 34 minutes (1,179 commuters, 21.2%), 15 to 19 minutes (797 commuters, 14.3%), and 10 to 14 minutes (659 commuters, 11.8%).
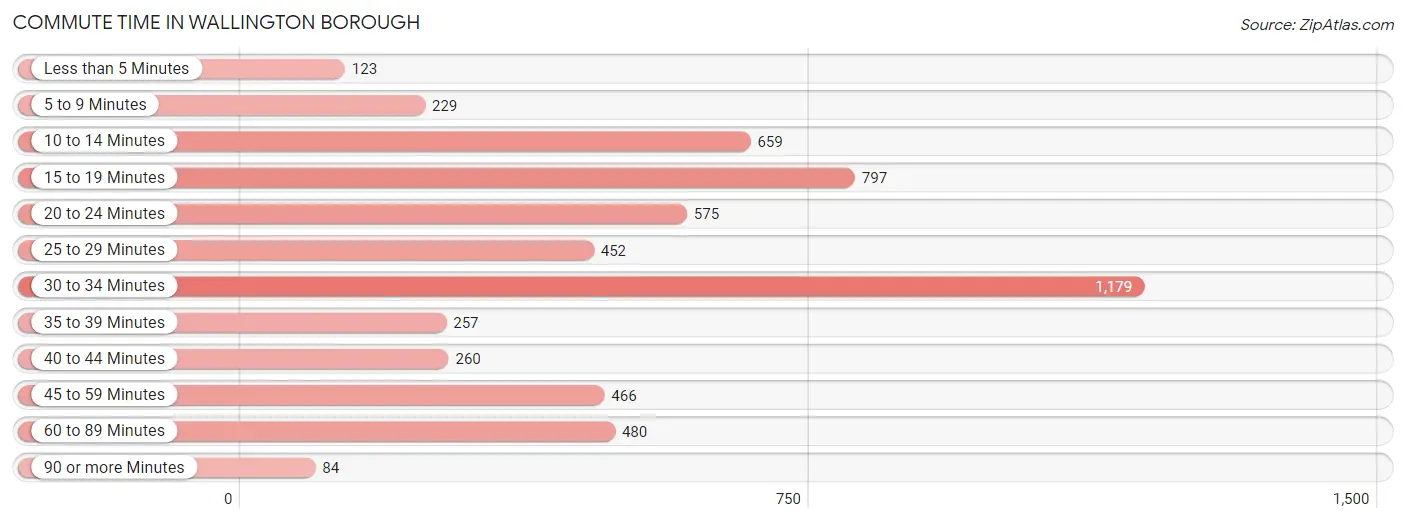
| Commute Time | # Commuters | % Commuters |
| Less than 5 Minutes | 123 | 2.2% |
| 5 to 9 Minutes | 229 | 4.1% |
| 10 to 14 Minutes | 659 | 11.8% |
| 15 to 19 Minutes | 797 | 14.3% |
| 20 to 24 Minutes | 575 | 10.3% |
| 25 to 29 Minutes | 452 | 8.1% |
| 30 to 34 Minutes | 1,179 | 21.2% |
| 35 to 39 Minutes | 257 | 4.6% |
| 40 to 44 Minutes | 260 | 4.7% |
| 45 to 59 Minutes | 466 | 8.4% |
| 60 to 89 Minutes | 480 | 8.6% |
| 90 or more Minutes | 84 | 1.5% |
Commute Time by Sex in Wallington borough
The most common commute times in Wallington borough are 30 to 34 minutes (819 commuters, 26.2%) for males and 15 to 19 minutes (459 commuters, 18.9%) for females.
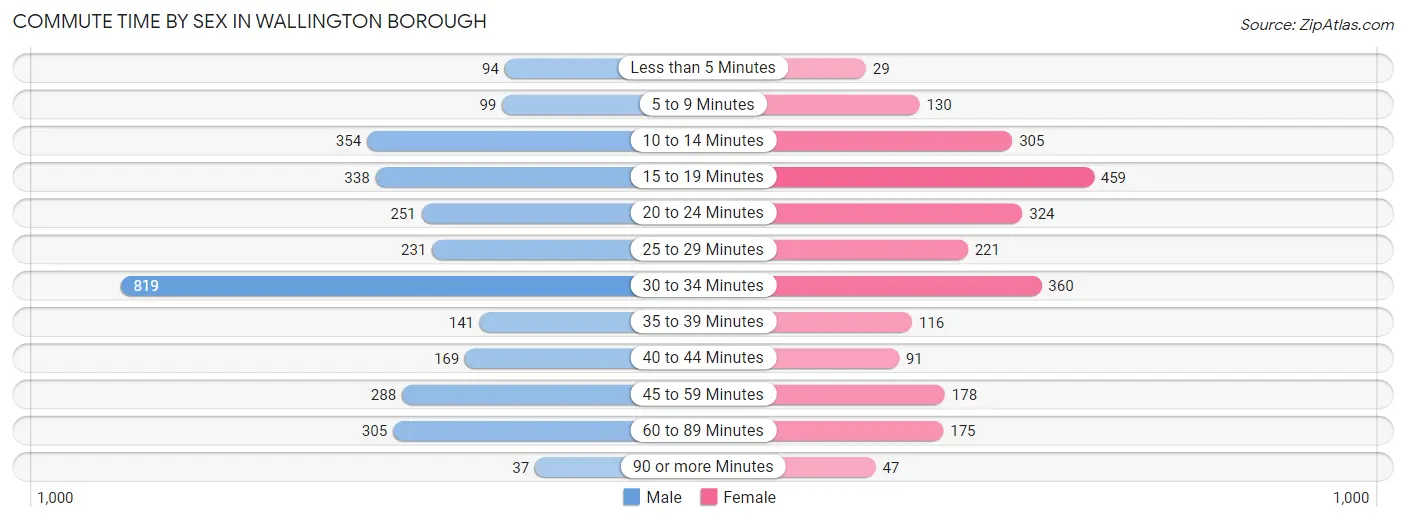
| Commute Time | Male | Female |
| Less than 5 Minutes | 94 (3.0%) | 29 (1.2%) |
| 5 to 9 Minutes | 99 (3.2%) | 130 (5.3%) |
| 10 to 14 Minutes | 354 (11.3%) | 305 (12.5%) |
| 15 to 19 Minutes | 338 (10.8%) | 459 (18.9%) |
| 20 to 24 Minutes | 251 (8.0%) | 324 (13.3%) |
| 25 to 29 Minutes | 231 (7.4%) | 221 (9.1%) |
| 30 to 34 Minutes | 819 (26.2%) | 360 (14.8%) |
| 35 to 39 Minutes | 141 (4.5%) | 116 (4.8%) |
| 40 to 44 Minutes | 169 (5.4%) | 91 (3.7%) |
| 45 to 59 Minutes | 288 (9.2%) | 178 (7.3%) |
| 60 to 89 Minutes | 305 (9.8%) | 175 (7.2%) |
| 90 or more Minutes | 37 (1.2%) | 47 (1.9%) |
Time of Departure to Work by Sex in Wallington borough
The most frequent times of departure to work in Wallington borough are 7:00 AM to 7:29 AM (628, 20.1%) for males and 7:00 AM to 7:29 AM (418, 17.2%) for females.
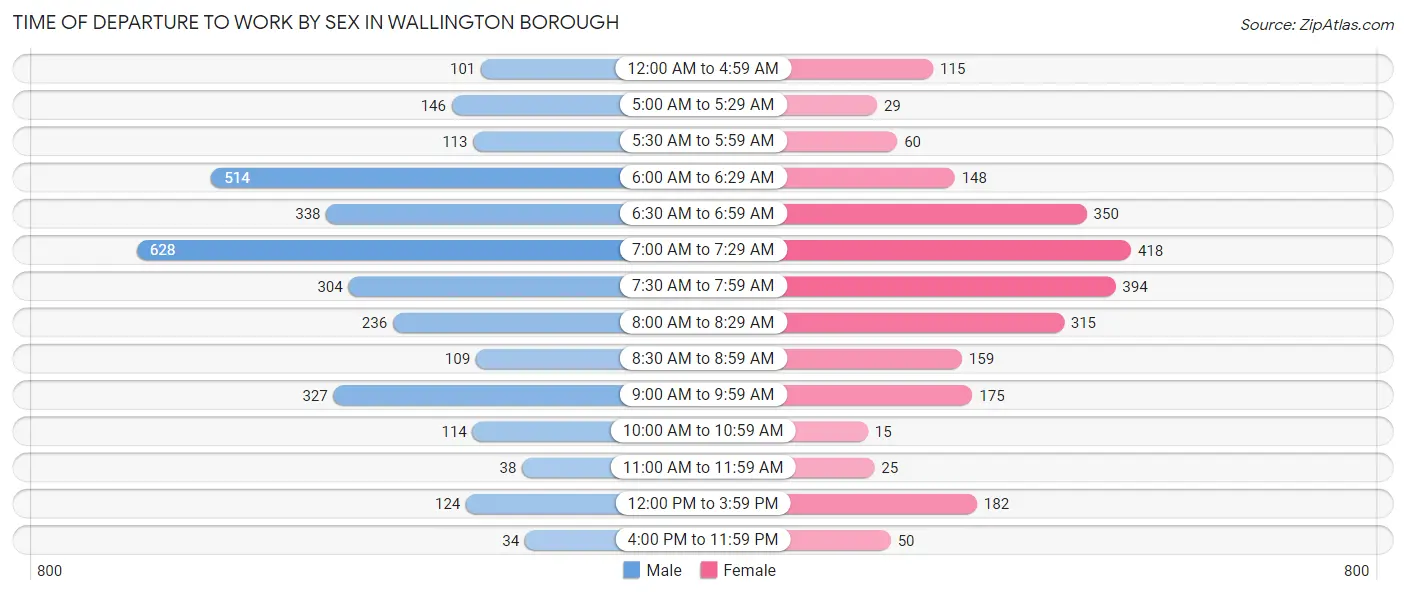
| Time of Departure | Male | Female |
| 12:00 AM to 4:59 AM | 101 (3.2%) | 115 (4.7%) |
| 5:00 AM to 5:29 AM | 146 (4.7%) | 29 (1.2%) |
| 5:30 AM to 5:59 AM | 113 (3.6%) | 60 (2.5%) |
| 6:00 AM to 6:29 AM | 514 (16.4%) | 148 (6.1%) |
| 6:30 AM to 6:59 AM | 338 (10.8%) | 350 (14.4%) |
| 7:00 AM to 7:29 AM | 628 (20.1%) | 418 (17.2%) |
| 7:30 AM to 7:59 AM | 304 (9.7%) | 394 (16.2%) |
| 8:00 AM to 8:29 AM | 236 (7.5%) | 315 (12.9%) |
| 8:30 AM to 8:59 AM | 109 (3.5%) | 159 (6.5%) |
| 9:00 AM to 9:59 AM | 327 (10.5%) | 175 (7.2%) |
| 10:00 AM to 10:59 AM | 114 (3.6%) | 15 (0.6%) |
| 11:00 AM to 11:59 AM | 38 (1.2%) | 25 (1.0%) |
| 12:00 PM to 3:59 PM | 124 (4.0%) | 182 (7.5%) |
| 4:00 PM to 11:59 PM | 34 (1.1%) | 50 (2.1%) |
| Total | 3,126 (100.0%) | 2,435 (100.0%) |
Housing Occupancy in Wallington borough
Occupancy by Ownership in Wallington borough
Of the total 4,994 dwellings in Wallington borough, owner-occupied units account for 1,720 (34.4%), while renter-occupied units make up 3,274 (65.6%).
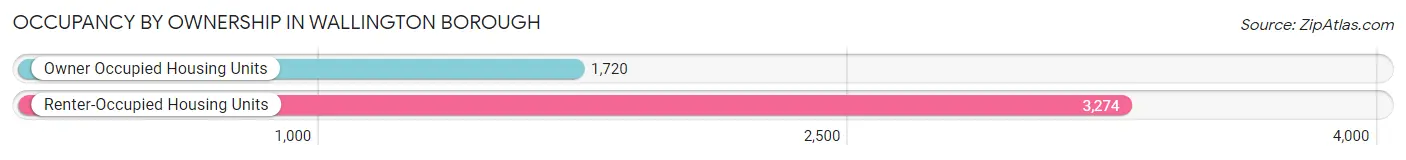
| Occupancy | # Housing Units | % Housing Units |
| Owner Occupied Housing Units | 1,720 | 34.4% |
| Renter-Occupied Housing Units | 3,274 | 65.6% |
| Total Occupied Housing Units | 4,994 | 100.0% |
Occupancy by Household Size in Wallington borough
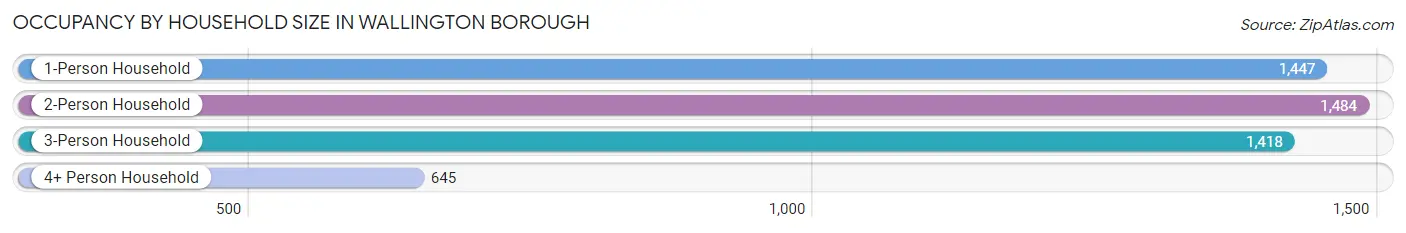
| Household Size | # Housing Units | % Housing Units |
| 1-Person Household | 1,447 | 29.0% |
| 2-Person Household | 1,484 | 29.7% |
| 3-Person Household | 1,418 | 28.4% |
| 4+ Person Household | 645 | 12.9% |
| Total Housing Units | 4,994 | 100.0% |
Occupancy by Ownership by Household Size in Wallington borough
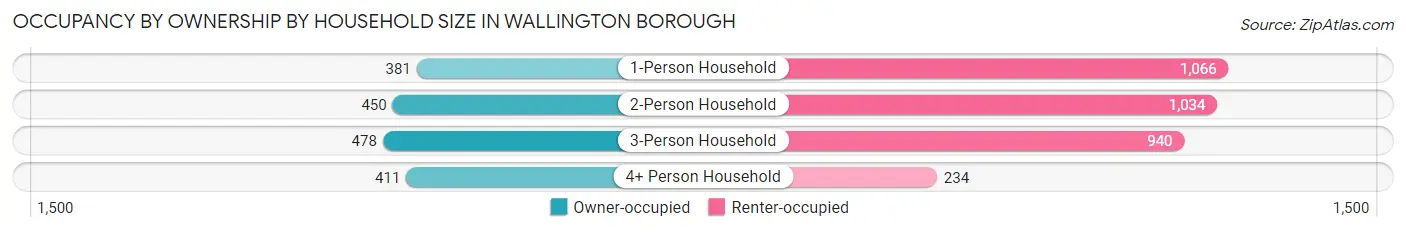
| Household Size | Owner-occupied | Renter-occupied |
| 1-Person Household | 381 (26.3%) | 1,066 (73.7%) |
| 2-Person Household | 450 (30.3%) | 1,034 (69.7%) |
| 3-Person Household | 478 (33.7%) | 940 (66.3%) |
| 4+ Person Household | 411 (63.7%) | 234 (36.3%) |
| Total Housing Units | 1,720 (34.4%) | 3,274 (65.6%) |
Occupancy by Educational Attainment in Wallington borough
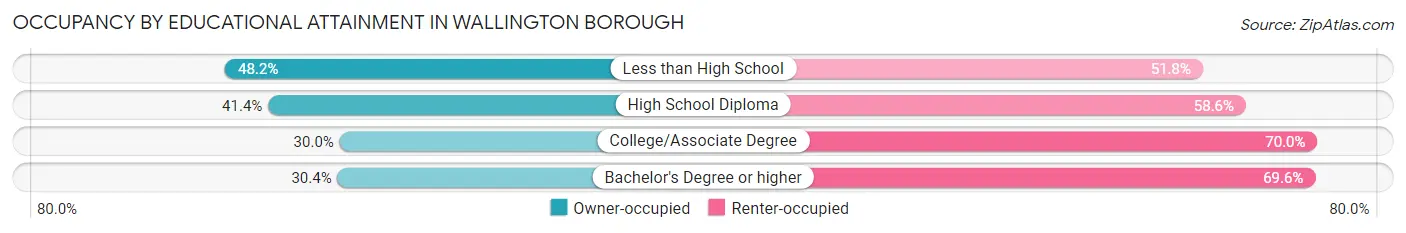
| Household Size | Owner-occupied | Renter-occupied |
| Less than High School | 134 (48.2%) | 144 (51.8%) |
| High School Diploma | 597 (41.4%) | 846 (58.6%) |
| College/Associate Degree | 439 (30.0%) | 1,023 (70.0%) |
| Bachelor's Degree or higher | 550 (30.4%) | 1,261 (69.6%) |
Occupancy by Age of Householder in Wallington borough
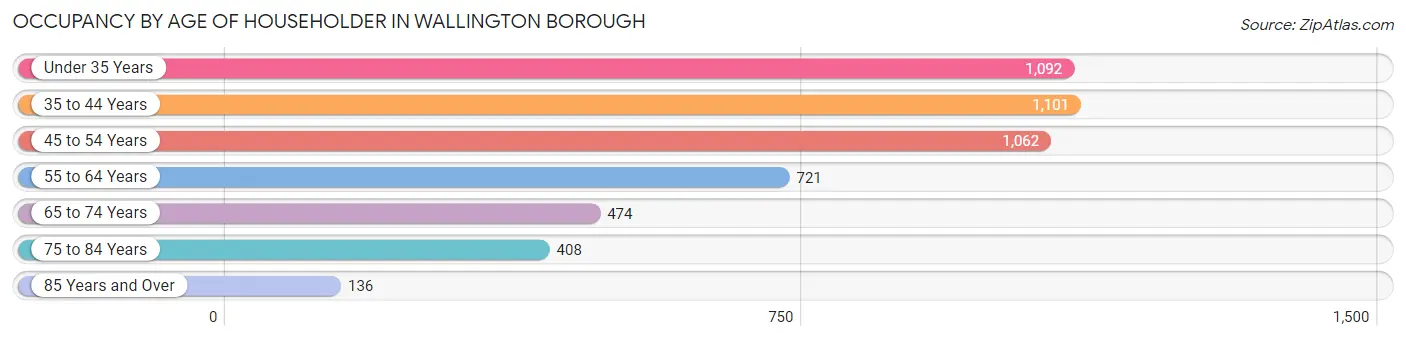
| Age Bracket | # Households | % Households |
| Under 35 Years | 1,092 | 21.9% |
| 35 to 44 Years | 1,101 | 22.1% |
| 45 to 54 Years | 1,062 | 21.3% |
| 55 to 64 Years | 721 | 14.4% |
| 65 to 74 Years | 474 | 9.5% |
| 75 to 84 Years | 408 | 8.2% |
| 85 Years and Over | 136 | 2.7% |
| Total | 4,994 | 100.0% |
Housing Finances in Wallington borough
Median Income by Occupancy in Wallington borough
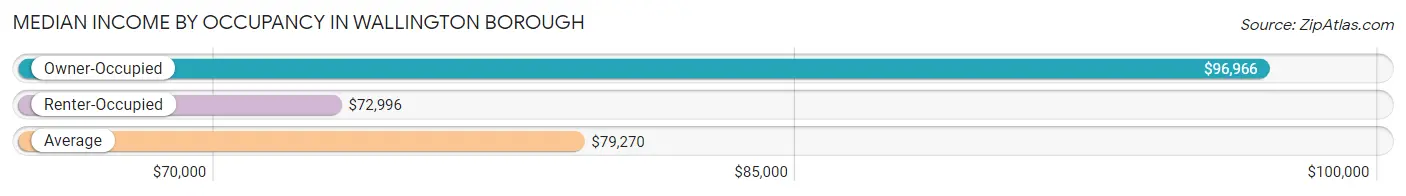
| Occupancy Type | # Households | Median Income |
| Owner-Occupied | 1,720 (34.4%) | $96,966 |
| Renter-Occupied | 3,274 (65.6%) | $72,996 |
| Average | 4,994 (100.0%) | $79,270 |
Occupancy by Householder Income Bracket in Wallington borough
| Income Bracket | Owner-occupied | Renter-occupied |
| Less than $5,000 | 9 (0.5%) | 87 (2.7%) |
| $5,000 to $9,999 | 23 (1.3%) | 35 (1.1%) |
| $10,000 to $14,999 | 45 (2.6%) | 155 (4.7%) |
| $15,000 to $19,999 | 13 (0.8%) | 119 (3.6%) |
| $20,000 to $24,999 | 110 (6.4%) | 108 (3.3%) |
| $25,000 to $34,999 | 96 (5.6%) | 138 (4.2%) |
| $35,000 to $49,999 | 141 (8.2%) | 457 (14.0%) |
| $50,000 to $74,999 | 186 (10.8%) | 635 (19.4%) |
| $75,000 to $99,999 | 303 (17.6%) | 696 (21.3%) |
| $100,000 to $149,999 | 224 (13.0%) | 440 (13.4%) |
| $150,000 or more | 570 (33.1%) | 404 (12.3%) |
| Total | 1,720 (100.0%) | 3,274 (100.0%) |
Monthly Housing Cost Tiers in Wallington borough
| Monthly Cost | Owner-occupied | Renter-occupied |
| Less than $300 | 147 (8.6%) | 0 (0.0%) |
| $300 to $499 | 26 (1.5%) | 25 (0.8%) |
| $500 to $799 | 112 (6.5%) | 36 (1.1%) |
| $800 to $999 | 127 (7.4%) | 185 (5.7%) |
| $1,000 to $1,499 | 409 (23.8%) | 1,459 (44.6%) |
| $1,500 to $1,999 | 110 (6.4%) | 977 (29.8%) |
| $2,000 to $2,499 | 206 (12.0%) | 434 (13.3%) |
| $2,500 to $2,999 | 189 (11.0%) | 27 (0.8%) |
| $3,000 or more | 394 (22.9%) | 0 (0.0%) |
| Total | 1,720 (100.0%) | 3,274 (100.0%) |
Physical Housing Characteristics in Wallington borough
Housing Structures in Wallington borough
| Structure Type | # Housing Units | % Housing Units |
| Single Unit, Detached | 1,082 | 21.7% |
| Single Unit, Attached | 136 | 2.7% |
| 2 Unit Apartments | 1,719 | 34.4% |
| 3 or 4 Unit Apartments | 494 | 9.9% |
| 5 to 9 Unit Apartments | 430 | 8.6% |
| 10 or more Apartments | 1,133 | 22.7% |
| Mobile Home / Other | 0 | 0.0% |
| Total | 4,994 | 100.0% |
Housing Structures by Occupancy in Wallington borough
| Structure Type | Owner-occupied | Renter-occupied |
| Single Unit, Detached | 807 (74.6%) | 275 (25.4%) |
| Single Unit, Attached | 50 (36.8%) | 86 (63.2%) |
| 2 Unit Apartments | 777 (45.2%) | 942 (54.8%) |
| 3 or 4 Unit Apartments | 79 (16.0%) | 415 (84.0%) |
| 5 to 9 Unit Apartments | 7 (1.6%) | 423 (98.4%) |
| 10 or more Apartments | 0 (0.0%) | 1,133 (100.0%) |
| Mobile Home / Other | 0 (0.0%) | 0 (0.0%) |
| Total | 1,720 (34.4%) | 3,274 (65.6%) |
Housing Structures by Number of Rooms in Wallington borough
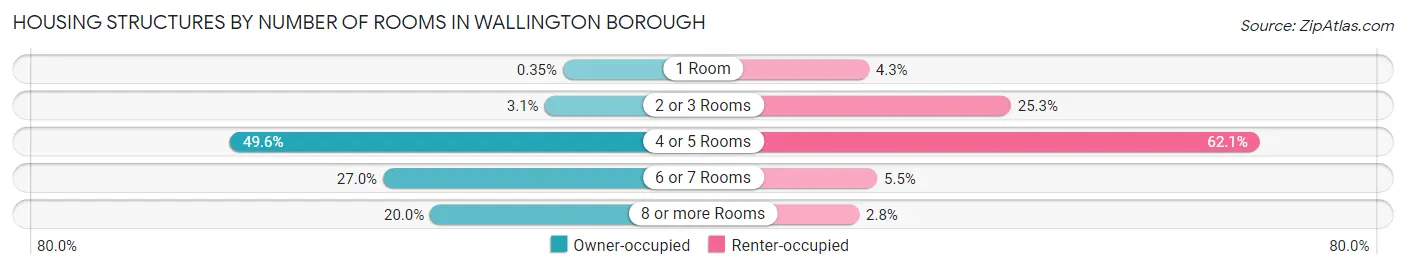
| Number of Rooms | Owner-occupied | Renter-occupied |
| 1 Room | 6 (0.4%) | 140 (4.3%) |
| 2 or 3 Rooms | 53 (3.1%) | 828 (25.3%) |
| 4 or 5 Rooms | 853 (49.6%) | 2,033 (62.1%) |
| 6 or 7 Rooms | 464 (27.0%) | 180 (5.5%) |
| 8 or more Rooms | 344 (20.0%) | 93 (2.8%) |
| Total | 1,720 (100.0%) | 3,274 (100.0%) |
Housing Structure by Heating Type in Wallington borough
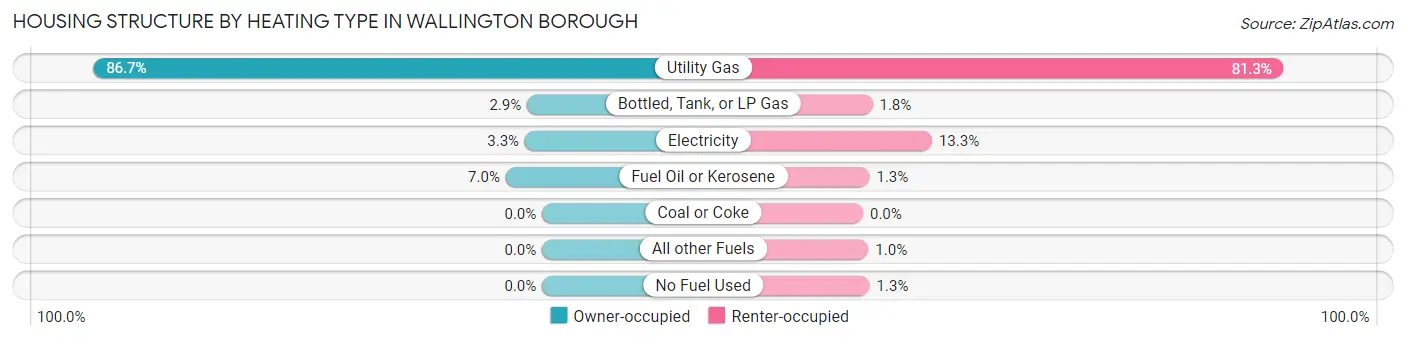
| Heating Type | Owner-occupied | Renter-occupied |
| Utility Gas | 1,492 (86.7%) | 2,661 (81.3%) |
| Bottled, Tank, or LP Gas | 50 (2.9%) | 60 (1.8%) |
| Electricity | 57 (3.3%) | 436 (13.3%) |
| Fuel Oil or Kerosene | 121 (7.0%) | 41 (1.3%) |
| Coal or Coke | 0 (0.0%) | 0 (0.0%) |
| All other Fuels | 0 (0.0%) | 34 (1.0%) |
| No Fuel Used | 0 (0.0%) | 42 (1.3%) |
| Total | 1,720 (100.0%) | 3,274 (100.0%) |
Household Vehicle Usage in Wallington borough
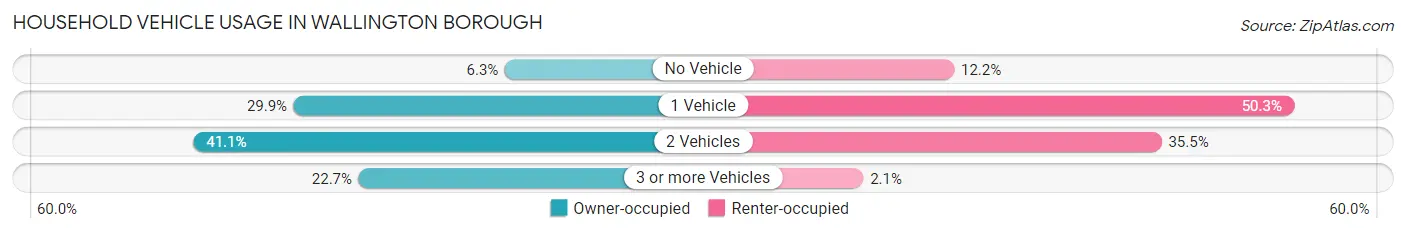
| Vehicles per Household | Owner-occupied | Renter-occupied |
| No Vehicle | 108 (6.3%) | 400 (12.2%) |
| 1 Vehicle | 515 (29.9%) | 1,646 (50.3%) |
| 2 Vehicles | 707 (41.1%) | 1,161 (35.5%) |
| 3 or more Vehicles | 390 (22.7%) | 67 (2.1%) |
| Total | 1,720 (100.0%) | 3,274 (100.0%) |
Real Estate & Mortgages in Wallington borough
Real Estate and Mortgage Overview in Wallington borough
| Characteristic | Without Mortgage | With Mortgage |
| Housing Units | 921 | 799 |
| Median Property Value | $401,200 | $539,500 |
| Median Household Income | $81,719 | $406 |
| Monthly Housing Costs | $1,066 | $394 |
| Real Estate Taxes | $8,511 | $12 |
Property Value by Mortgage Status in Wallington borough
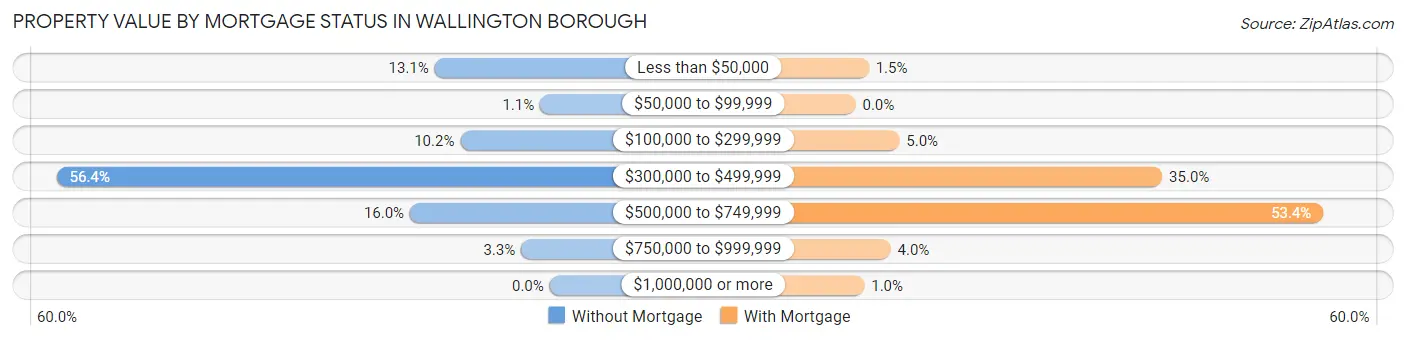
| Property Value | Without Mortgage | With Mortgage |
| Less than $50,000 | 121 (13.1%) | 12 (1.5%) |
| $50,000 to $99,999 | 10 (1.1%) | 0 (0.0%) |
| $100,000 to $299,999 | 94 (10.2%) | 40 (5.0%) |
| $300,000 to $499,999 | 519 (56.4%) | 280 (35.0%) |
| $500,000 to $749,999 | 147 (16.0%) | 427 (53.4%) |
| $750,000 to $999,999 | 30 (3.3%) | 32 (4.0%) |
| $1,000,000 or more | 0 (0.0%) | 8 (1.0%) |
| Total | 921 (100.0%) | 799 (100.0%) |
Household Income by Mortgage Status in Wallington borough
| Household Income | Without Mortgage | With Mortgage |
| Less than $10,000 | 25 (2.7%) | 19 (2.4%) |
| $10,000 to $24,999 | 151 (16.4%) | 7 (0.9%) |
| $25,000 to $34,999 | 59 (6.4%) | 17 (2.1%) |
| $35,000 to $49,999 | 91 (9.9%) | 37 (4.6%) |
| $50,000 to $74,999 | 100 (10.9%) | 50 (6.3%) |
| $75,000 to $99,999 | 223 (24.2%) | 86 (10.8%) |
| $100,000 to $149,999 | 108 (11.7%) | 80 (10.0%) |
| $150,000 or more | 164 (17.8%) | 116 (14.5%) |
| Total | 921 (100.0%) | 799 (100.0%) |
Property Value to Household Income Ratio in Wallington borough
| Value-to-Income Ratio | Without Mortgage | With Mortgage |
| Less than 2.0x | 211 (22.9%) | 151,625 (18,976.8%) |
| 2.0x to 2.9x | 138 (15.0%) | 112 (14.0%) |
| 3.0x to 3.9x | 83 (9.0%) | 185 (23.2%) |
| 4.0x or more | 489 (53.1%) | 154 (19.3%) |
| Total | 921 (100.0%) | 799 (100.0%) |
Real Estate Taxes by Mortgage Status in Wallington borough
| Property Taxes | Without Mortgage | With Mortgage |
| Less than $800 | 121 (13.1%) | 0 (0.0%) |
| $800 to $1,499 | 8 (0.9%) | 0 (0.0%) |
| $800 to $1,499 | 766 (83.2%) | 0 (0.0%) |
| Total | 921 (100.0%) | 799 (100.0%) |
Health & Disability in Wallington borough
Health Insurance Coverage by Age in Wallington borough
| Age Bracket | With Coverage | Without Coverage |
| Under 6 Years | 656 (87.2%) | 96 (12.8%) |
| 6 to 18 Years | 1,526 (95.4%) | 73 (4.6%) |
| 19 to 25 Years | 667 (85.8%) | 110 (14.2%) |
| 26 to 34 Years | 1,443 (76.8%) | 437 (23.2%) |
| 35 to 44 Years | 1,172 (61.5%) | 735 (38.5%) |
| 45 to 54 Years | 1,628 (88.7%) | 208 (11.3%) |
| 55 to 64 Years | 1,177 (84.3%) | 219 (15.7%) |
| 65 to 74 Years | 805 (100.0%) | 0 (0.0%) |
| 75 Years and older | 886 (100.0%) | 0 (0.0%) |
| Total | 9,960 (84.1%) | 1,878 (15.9%) |
Health Insurance Coverage by Citizenship Status in Wallington borough
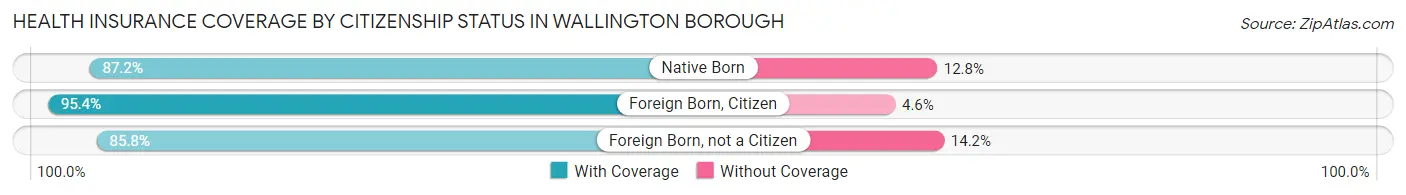
| Citizenship Status | With Coverage | Without Coverage |
| Native Born | 656 (87.2%) | 96 (12.8%) |
| Foreign Born, Citizen | 1,526 (95.4%) | 73 (4.6%) |
| Foreign Born, not a Citizen | 667 (85.8%) | 110 (14.2%) |
Health Insurance Coverage by Household Income in Wallington borough
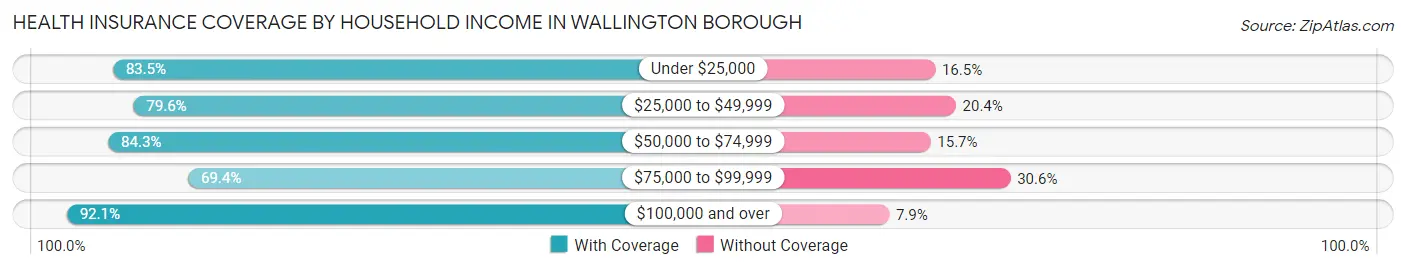
| Household Income | With Coverage | Without Coverage |
| Under $25,000 | 1,142 (83.5%) | 226 (16.5%) |
| $25,000 to $49,999 | 1,335 (79.6%) | 342 (20.4%) |
| $50,000 to $74,999 | 1,400 (84.3%) | 260 (15.7%) |
| $75,000 to $99,999 | 1,484 (69.4%) | 655 (30.6%) |
| $100,000 and over | 4,591 (92.1%) | 394 (7.9%) |
Public vs Private Health Insurance Coverage by Age in Wallington borough
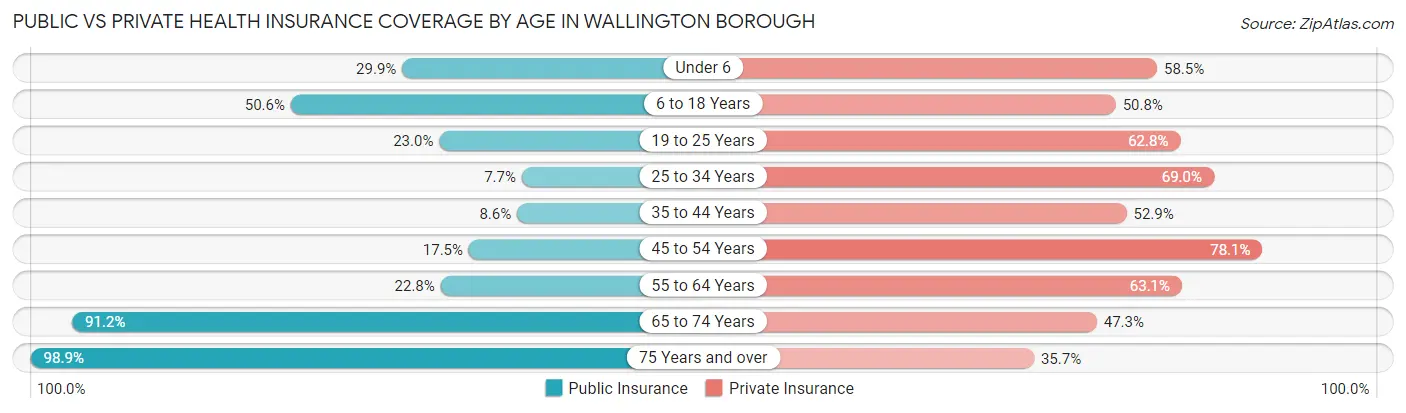
| Age Bracket | Public Insurance | Private Insurance |
| Under 6 | 225 (29.9%) | 440 (58.5%) |
| 6 to 18 Years | 809 (50.6%) | 813 (50.8%) |
| 19 to 25 Years | 179 (23.0%) | 488 (62.8%) |
| 25 to 34 Years | 145 (7.7%) | 1,298 (69.0%) |
| 35 to 44 Years | 164 (8.6%) | 1,008 (52.9%) |
| 45 to 54 Years | 322 (17.5%) | 1,433 (78.0%) |
| 55 to 64 Years | 318 (22.8%) | 881 (63.1%) |
| 65 to 74 Years | 734 (91.2%) | 381 (47.3%) |
| 75 Years and over | 876 (98.9%) | 316 (35.7%) |
| Total | 3,772 (31.9%) | 7,058 (59.6%) |
Disability Status by Sex by Age in Wallington borough
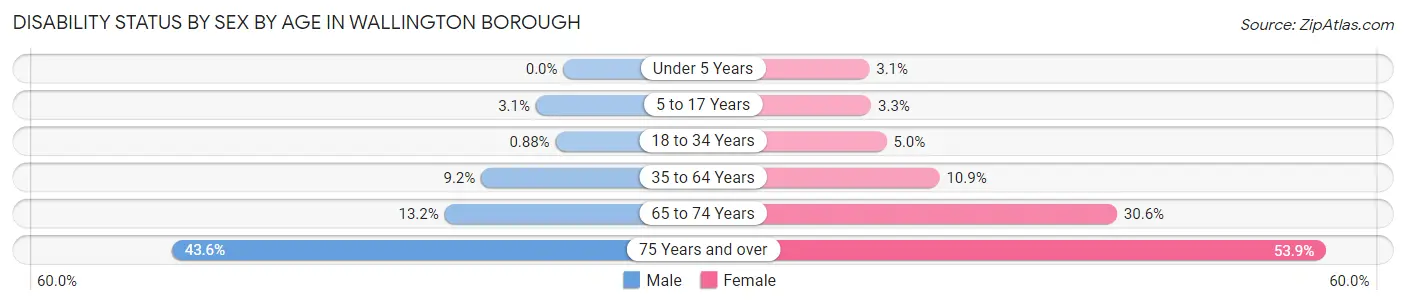
| Age Bracket | Male | Female |
| Under 5 Years | 0 (0.0%) | 11 (3.1%) |
| 5 to 17 Years | 31 (3.1%) | 20 (3.3%) |
| 18 to 34 Years | 13 (0.9%) | 62 (5.0%) |
| 35 to 64 Years | 235 (9.2%) | 280 (10.9%) |
| 65 to 74 Years | 59 (13.2%) | 110 (30.6%) |
| 75 Years and over | 92 (43.6%) | 364 (53.9%) |
Disability Class by Sex by Age in Wallington borough
Disability Class: Hearing Difficulty
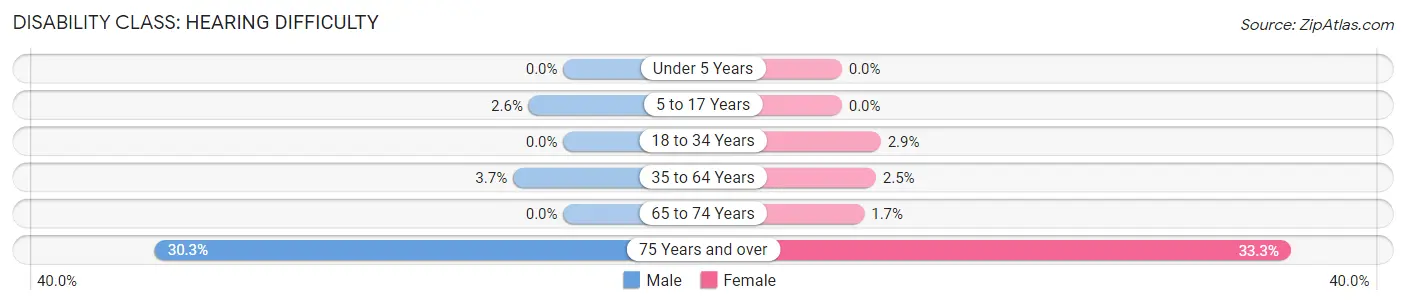
| Age Bracket | Male | Female |
| Under 5 Years | 0 (0.0%) | 0 (0.0%) |
| 5 to 17 Years | 26 (2.6%) | 0 (0.0%) |
| 18 to 34 Years | 0 (0.0%) | 36 (2.9%) |
| 35 to 64 Years | 96 (3.7%) | 65 (2.5%) |
| 65 to 74 Years | 0 (0.0%) | 6 (1.7%) |
| 75 Years and over | 64 (30.3%) | 225 (33.3%) |
Disability Class: Vision Difficulty
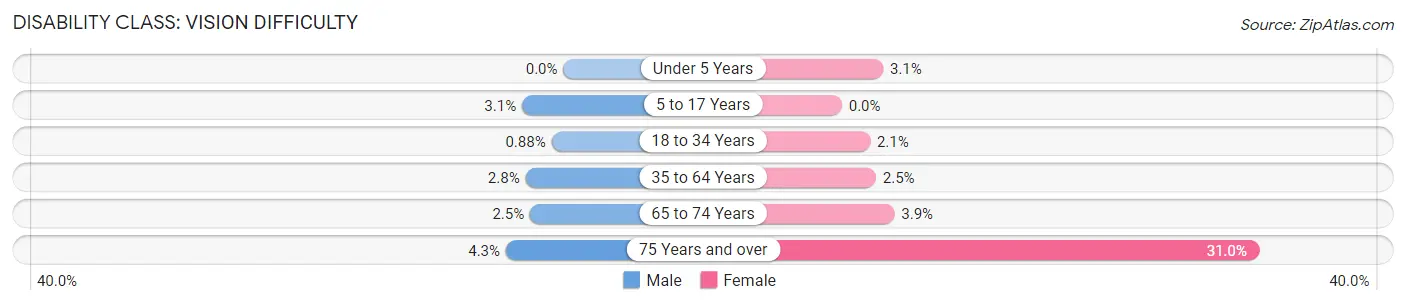
| Age Bracket | Male | Female |
| Under 5 Years | 0 (0.0%) | 11 (3.1%) |
| 5 to 17 Years | 31 (3.1%) | 0 (0.0%) |
| 18 to 34 Years | 13 (0.9%) | 26 (2.1%) |
| 35 to 64 Years | 72 (2.8%) | 65 (2.5%) |
| 65 to 74 Years | 11 (2.5%) | 14 (3.9%) |
| 75 Years and over | 9 (4.3%) | 209 (31.0%) |
Disability Class: Cognitive Difficulty
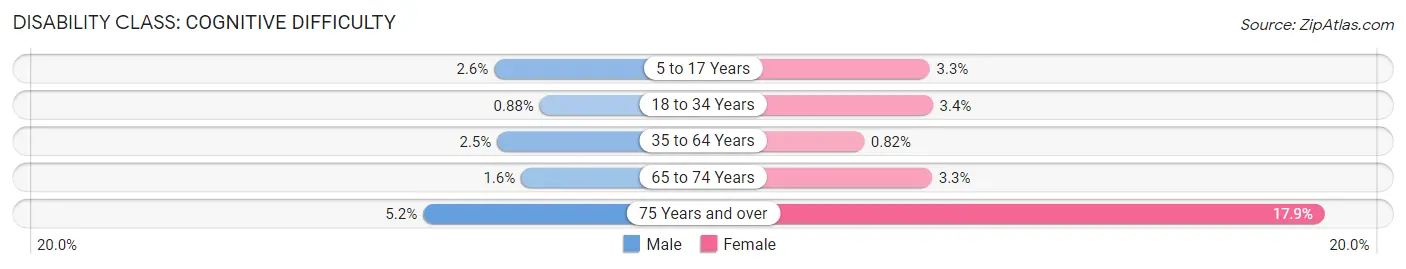
| Age Bracket | Male | Female |
| 5 to 17 Years | 26 (2.6%) | 20 (3.3%) |
| 18 to 34 Years | 13 (0.9%) | 42 (3.4%) |
| 35 to 64 Years | 63 (2.5%) | 21 (0.8%) |
| 65 to 74 Years | 7 (1.6%) | 12 (3.3%) |
| 75 Years and over | 11 (5.2%) | 121 (17.9%) |
Disability Class: Ambulatory Difficulty
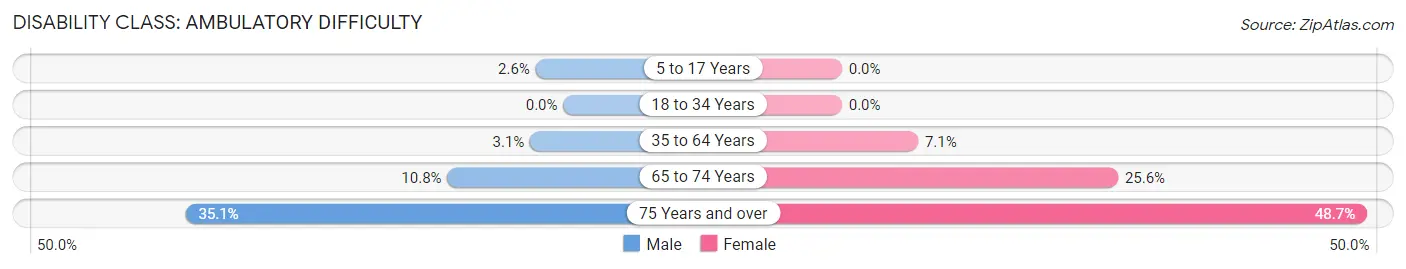
| Age Bracket | Male | Female |
| 5 to 17 Years | 26 (2.6%) | 0 (0.0%) |
| 18 to 34 Years | 0 (0.0%) | 0 (0.0%) |
| 35 to 64 Years | 79 (3.1%) | 182 (7.1%) |
| 65 to 74 Years | 48 (10.8%) | 92 (25.6%) |
| 75 Years and over | 74 (35.1%) | 329 (48.7%) |
Disability Class: Self-Care Difficulty
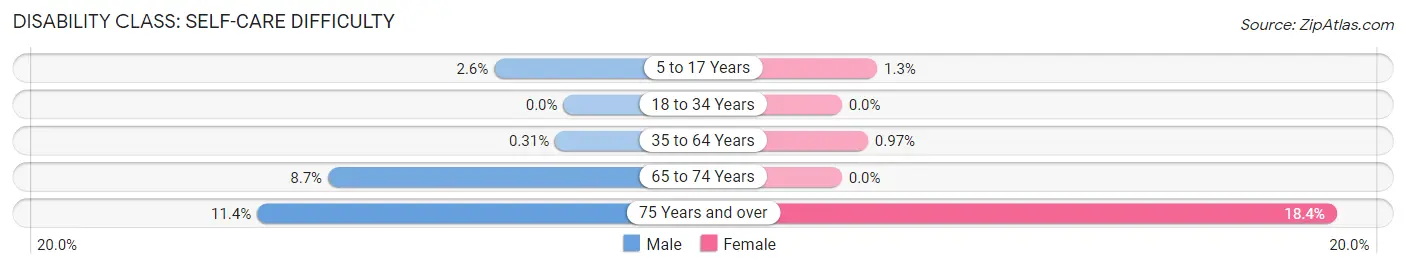
| Age Bracket | Male | Female |
| 5 to 17 Years | 26 (2.6%) | 8 (1.3%) |
| 18 to 34 Years | 0 (0.0%) | 0 (0.0%) |
| 35 to 64 Years | 8 (0.3%) | 25 (1.0%) |
| 65 to 74 Years | 39 (8.7%) | 0 (0.0%) |
| 75 Years and over | 24 (11.4%) | 124 (18.4%) |
Technology Access in Wallington borough
Computing Device Access in Wallington borough
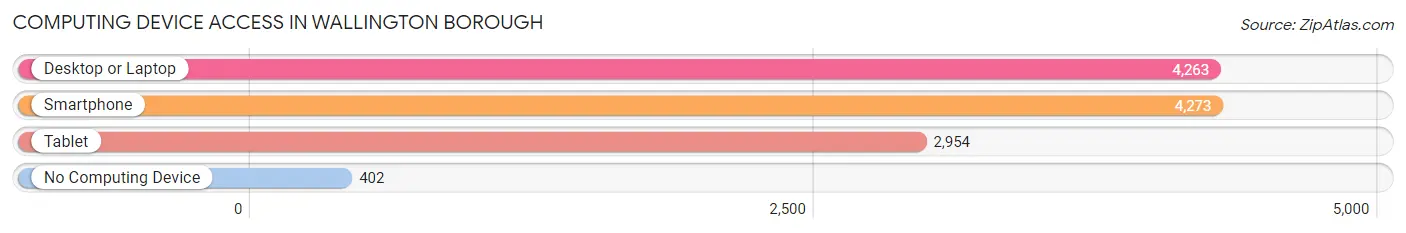
| Device Type | # Households | % Households |
| Desktop or Laptop | 4,263 | 85.4% |
| Smartphone | 4,273 | 85.6% |
| Tablet | 2,954 | 59.2% |
| No Computing Device | 402 | 8.1% |
| Total | 4,994 | 100.0% |
Internet Access in Wallington borough
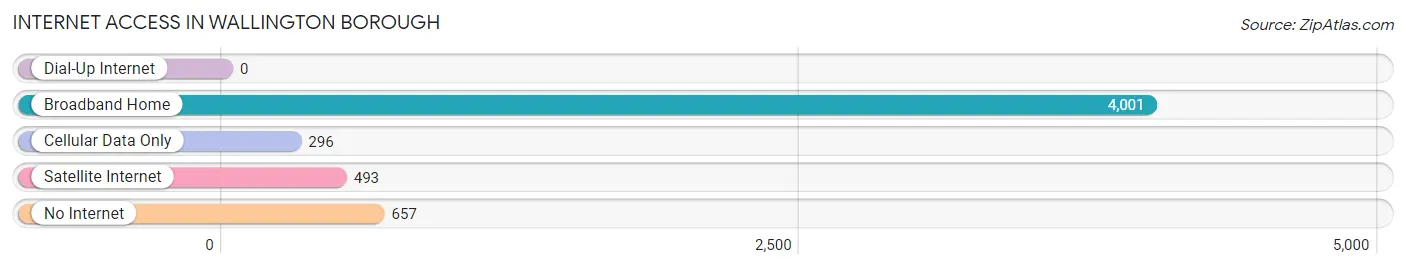
| Internet Type | # Households | % Households |
| Dial-Up Internet | 0 | 0.0% |
| Broadband Home | 4,001 | 80.1% |
| Cellular Data Only | 296 | 5.9% |
| Satellite Internet | 493 | 9.9% |
| No Internet | 657 | 13.2% |
| Total | 4,994 | 100.0% |
Wallington borough Summary
Wallington Borough is a small borough located in Bergen County, New Jersey. It is situated in the northern part of the state, just south of the Passaic River and is bordered by the towns of Garfield, Saddle Brook, and East Rutherford. The borough has a population of approximately 11,000 people and covers an area of 1.3 square miles.
History
Wallington Borough was originally part of the Township of Saddle River, which was established in 1716. In 1894, the area was incorporated as the Borough of Wallington. The name of the borough is derived from the Wallington family, who were among the first settlers in the area. The Wallington family owned a large tract of land in the area and operated a mill on the Passaic River.
The borough was primarily a rural area until the early 20th century, when it began to experience rapid growth due to its proximity to New York City. The borough was home to several factories, including a silk mill, a paper mill, and a brickyard. The borough also had a thriving agricultural industry, with farms producing a variety of crops, including potatoes, onions, and tomatoes.
Geography
Wallington Borough is located in the northern part of Bergen County, New Jersey. It is situated just south of the Passaic River and is bordered by the towns of Garfield, Saddle Brook, and East Rutherford. The borough has a total area of 1.3 square miles, all of which is land.
The borough is located in the Hackensack River watershed and is home to several small streams, including the Wallington Brook and the Saddle River. The borough is also home to several parks, including the Wallington Park, the Wallington Green, and the Wallington Playground.
Economy
The economy of Wallington Borough is largely based on the service industry. The borough is home to several small businesses, including restaurants, retail stores, and professional services. The borough also has a thriving manufacturing sector, with several factories producing a variety of products, including paper, plastics, and textiles.
The borough is also home to several large employers, including the Wallington Public Schools, the Wallington Police Department, and the Wallington Fire Department. The borough also has a thriving tourism industry, with several hotels and restaurants located in the area.
Demographics
As of the 2010 census, the population of Wallington Borough was 11,335. The racial makeup of the borough was 79.3% White, 8.2% African American, 0.3% Native American, 5.2% Asian, and 6.9% from other races. Hispanic or Latino of any race were 16.3% of the population.
The median household income in Wallington Borough was $60,945, and the median family income was $71,917. The per capita income in the borough was $27,945. About 8.2% of families and 10.2% of the population were below the poverty line, including 14.2% of those under age 18 and 8.2% of those age 65 or over.
Conclusion
Wallington Borough is a small borough located in Bergen County, New Jersey. It is situated in the northern part of the state, just south of the Passaic River and is bordered by the towns of Garfield, Saddle Brook, and East Rutherford. The borough has a population of approximately 11,000 people and covers an area of 1.3 square miles. The economy of Wallington Borough is largely based on the service industry, with several small businesses, factories, and large employers located in the area. The borough also has a thriving tourism industry, with several hotels and restaurants located in the area. The racial makeup of the borough is 79.3% White, 8.2% African American, 0.3% Native American, 5.2% Asian, and 6.9% from other races. The median household income in Wallington Borough was $60,945, and the median family income was $71,917.
Common Questions
What is Per Capita Income in Wallington borough?
Per Capita income in Wallington borough is $42,203.
What is the Median Family Income in Wallington borough?
Median Family Income in Wallington borough is $85,745.
What is the Median Household income in Wallington borough?
Median Household Income in Wallington borough is $79,270.
What is Income or Wage Gap in Wallington borough?
Income or Wage Gap in Wallington borough is 42.7%.
Women in Wallington borough earn 57.3 cents for every dollar earned by a man.
What is Inequality or Gini Index in Wallington borough?
Inequality or Gini Index in Wallington borough is 0.43.
What is the Total Population of Wallington borough?
Total Population of Wallington borough is 11,838.
What is the Total Male Population of Wallington borough?
Total Male Population of Wallington borough is 6,014.
What is the Total Female Population of Wallington borough?
Total Female Population of Wallington borough is 5,824.
What is the Ratio of Males per 100 Females in Wallington borough?
There are 103.26 Males per 100 Females in Wallington borough.
What is the Ratio of Females per 100 Males in Wallington borough?
There are 96.84 Females per 100 Males in Wallington borough.
What is the Median Population Age in Wallington borough?
Median Population Age in Wallington borough is 39.3 Years.
What is the Average Family Size in Wallington borough
Average Family Size in Wallington borough is 2.9 People.
What is the Average Household Size in Wallington borough
Average Household Size in Wallington borough is 2.4 People.
How Large is the Labor Force in Wallington borough?
There are 6,538 People in the Labor Forcein in Wallington borough.
What is the Percentage of People in the Labor Force in Wallington borough?
66.4% of People are in the Labor Force in Wallington borough.
What is the Unemployment Rate in Wallington borough?
Unemployment Rate in Wallington borough is 7.6%.