Collingswood borough, NJ Map & Demographics
Collingswood borough Overview
$54,456
PER CAPITA INCOME
$121,544
AVG FAMILY INCOME
$78,909
AVG HOUSEHOLD INCOME
20.2%
WAGE / INCOME GAP [ % ]
79.8¢/ $1
WAGE / INCOME GAP [ $ ]
0.50
INEQUALITY / GINI INDEX
14,135
TOTAL POPULATION
6,874
MALE POPULATION
7,261
FEMALE POPULATION
94.67
MALES / 100 FEMALES
105.63
FEMALES / 100 MALES
39.8
MEDIAN AGE
2.9
AVG FAMILY SIZE
2.1
AVG HOUSEHOLD SIZE
8,630
LABOR FORCE [ PEOPLE ]
71.6%
PERCENT IN LABOR FORCE
8.1%
UNEMPLOYMENT RATE
Income in Collingswood borough
Income Overview in Collingswood borough
Per Capita Income in Collingswood borough is $54,456, while median incomes of families and households are $121,544 and $78,909 respectively.
| Characteristic | Number | Measure |
| Per Capita Income | 14,135 | $54,456 |
| Median Family Income | 3,355 | $121,544 |
| Mean Family Income | 3,355 | $147,753 |
| Median Household Income | 6,698 | $78,909 |
| Mean Household Income | 6,698 | $113,440 |
| Income Deficit | 3,355 | $0 |
| Wage / Income Gap (%) | 14,135 | 20.17% |
| Wage / Income Gap ($) | 14,135 | 79.83¢ per $1 |
| Gini / Inequality Index | 14,135 | 0.50 |
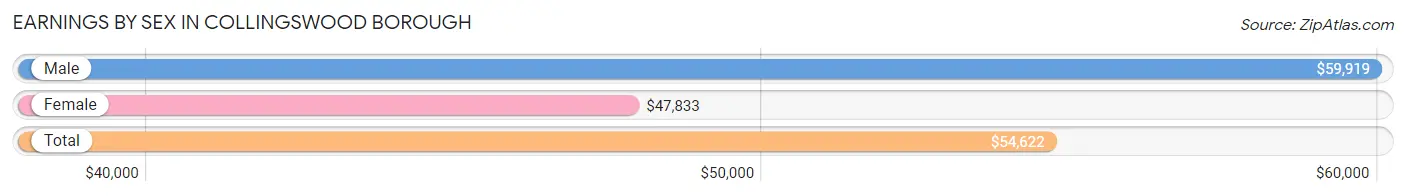
Earnings by Sex in Collingswood borough
Average Earnings in Collingswood borough are $54,622, $59,919 for men and $47,833 for women, a difference of 20.2%.
| Sex | Number | Average Earnings |
| Male | 4,654 (51.9%) | $59,919 |
| Female | 4,310 (48.1%) | $47,833 |
| Total | 8,964 (100.0%) | $54,622 |
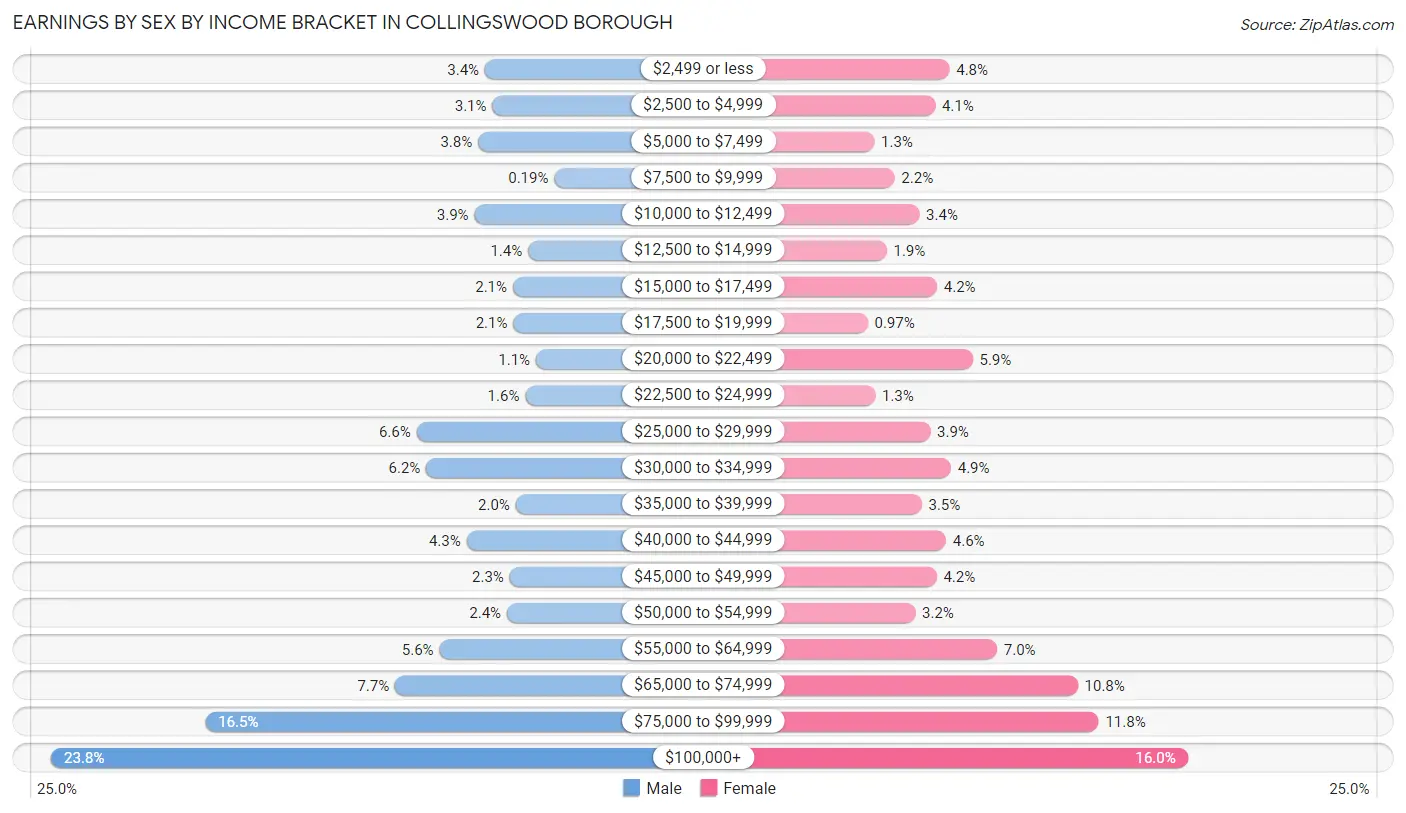
Earnings by Sex by Income Bracket in Collingswood borough
The most common earnings brackets in Collingswood borough are $100,000+ for men (1,106 | 23.8%) and $100,000+ for women (688 | 16.0%).
| Income | Male | Female |
| $2,499 or less | 160 (3.4%) | 207 (4.8%) |
| $2,500 to $4,999 | 144 (3.1%) | 178 (4.1%) |
| $5,000 to $7,499 | 175 (3.8%) | 55 (1.3%) |
| $7,500 to $9,999 | 9 (0.2%) | 96 (2.2%) |
| $10,000 to $12,499 | 183 (3.9%) | 146 (3.4%) |
| $12,500 to $14,999 | 66 (1.4%) | 80 (1.9%) |
| $15,000 to $17,499 | 99 (2.1%) | 182 (4.2%) |
| $17,500 to $19,999 | 98 (2.1%) | 42 (1.0%) |
| $20,000 to $22,499 | 49 (1.1%) | 254 (5.9%) |
| $22,500 to $24,999 | 72 (1.5%) | 57 (1.3%) |
| $25,000 to $29,999 | 309 (6.6%) | 168 (3.9%) |
| $30,000 to $34,999 | 288 (6.2%) | 210 (4.9%) |
| $35,000 to $39,999 | 93 (2.0%) | 151 (3.5%) |
| $40,000 to $44,999 | 200 (4.3%) | 200 (4.6%) |
| $45,000 to $49,999 | 106 (2.3%) | 181 (4.2%) |
| $50,000 to $54,999 | 112 (2.4%) | 138 (3.2%) |
| $55,000 to $64,999 | 259 (5.6%) | 303 (7.0%) |
| $65,000 to $74,999 | 356 (7.6%) | 466 (10.8%) |
| $75,000 to $99,999 | 770 (16.5%) | 508 (11.8%) |
| $100,000+ | 1,106 (23.8%) | 688 (16.0%) |
| Total | 4,654 (100.0%) | 4,310 (100.0%) |
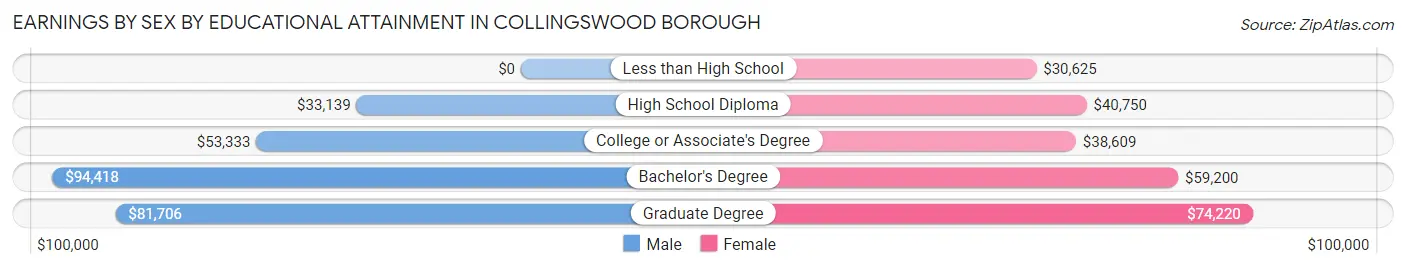
Earnings by Sex by Educational Attainment in Collingswood borough
Average earnings in Collingswood borough are $68,234 for men and $57,208 for women, a difference of 16.2%. Men with an educational attainment of bachelor's degree enjoy the highest average annual earnings of $94,418, while those with high school diploma education earn the least with $33,139. Women with an educational attainment of graduate degree earn the most with the average annual earnings of $74,220, while those with less than high school education have the smallest earnings of $30,625.
| Educational Attainment | Male Income | Female Income |
| Less than High School | - | - |
| High School Diploma | $33,139 | $40,750 |
| College or Associate's Degree | $53,333 | $38,609 |
| Bachelor's Degree | $94,418 | $59,200 |
| Graduate Degree | $81,706 | $74,220 |
| Total | $68,234 | $57,208 |
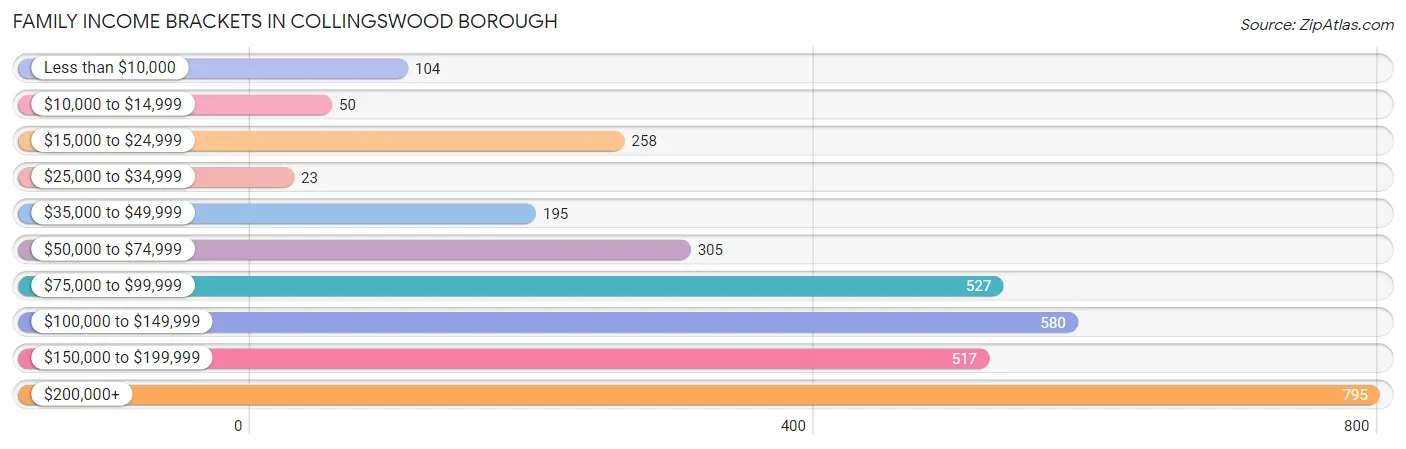
Family Income in Collingswood borough
Family Income Brackets in Collingswood borough
According to the Collingswood borough family income data, there are 795 families falling into the $200,000+ income range, which is the most common income bracket and makes up 23.7% of all families. Conversely, the $25,000 to $34,999 income bracket is the least frequent group with only 23 families (0.7%) belonging to this category.
| Income Bracket | # Families | % Families |
| Less than $10,000 | 104 | 3.1% |
| $10,000 to $14,999 | 50 | 1.5% |
| $15,000 to $24,999 | 258 | 7.7% |
| $25,000 to $34,999 | 23 | 0.7% |
| $35,000 to $49,999 | 195 | 5.8% |
| $50,000 to $74,999 | 305 | 9.1% |
| $75,000 to $99,999 | 527 | 15.7% |
| $100,000 to $149,999 | 580 | 17.3% |
| $150,000 to $199,999 | 517 | 15.4% |
| $200,000+ | 795 | 23.7% |
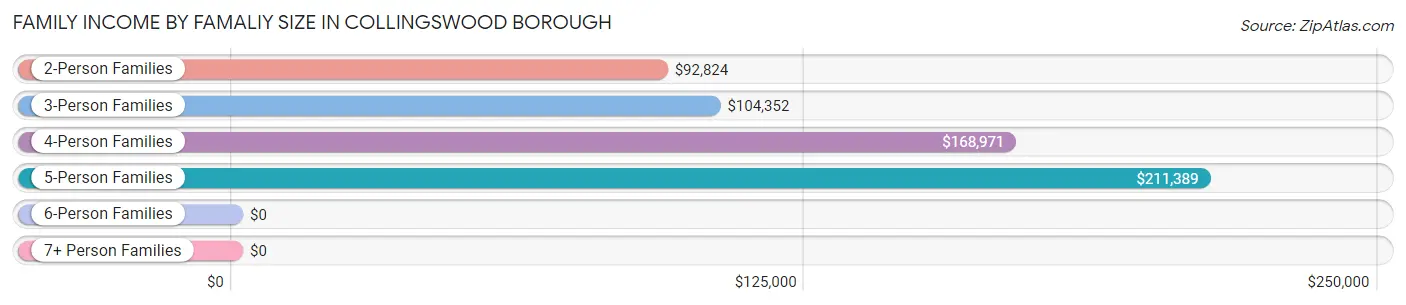
Family Income by Famaliy Size in Collingswood borough
5-person families (116 | 3.5%) account for the highest median family income in Collingswood borough with $211,389 per family, while 2-person families (1,746 | 52.0%) have the highest median income of $46,412 per family member.
| Income Bracket | # Families | Median Income |
| 2-Person Families | 1,746 (52.0%) | $92,824 |
| 3-Person Families | 784 (23.4%) | $104,352 |
| 4-Person Families | 640 (19.1%) | $168,971 |
| 5-Person Families | 116 (3.5%) | $211,389 |
| 6-Person Families | 45 (1.3%) | $0 |
| 7+ Person Families | 24 (0.7%) | $0 |
| Total | 3,355 (100.0%) | $121,544 |
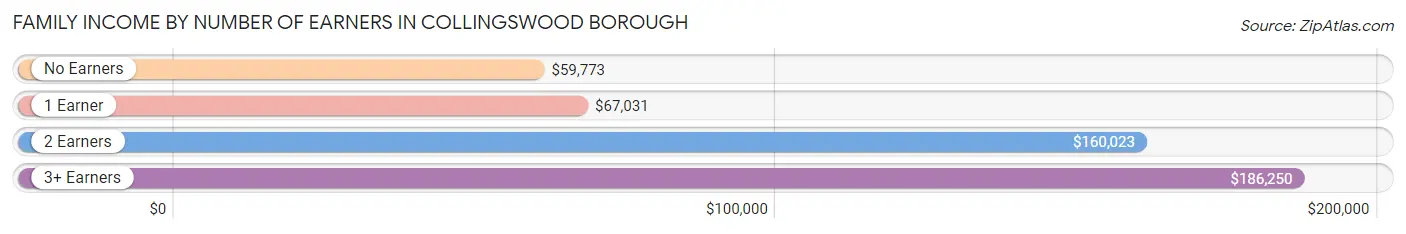
Family Income by Number of Earners in Collingswood borough
The median family income in Collingswood borough is $121,544, with families comprising 3+ earners (423) having the highest median family income of $186,250, while families with no earners (332) have the lowest median family income of $59,773, accounting for 12.6% and 9.9% of families, respectively.
| Number of Earners | # Families | Median Income |
| No Earners | 332 (9.9%) | $59,773 |
| 1 Earner | 911 (27.2%) | $67,031 |
| 2 Earners | 1,689 (50.3%) | $160,023 |
| 3+ Earners | 423 (12.6%) | $186,250 |
| Total | 3,355 (100.0%) | $121,544 |
Household Income in Collingswood borough
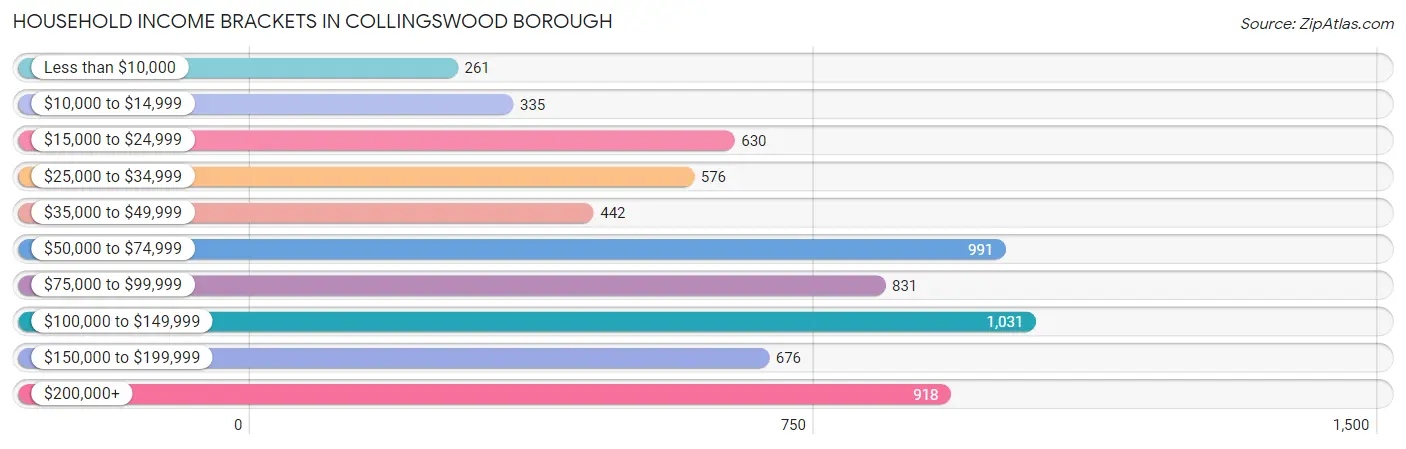
Household Income Brackets in Collingswood borough
With 1,031 households falling in the category, the $100,000 to $149,999 income range is the most frequent in Collingswood borough, accounting for 15.4% of all households. In contrast, only 261 households (3.9%) fall into the less than $10,000 income bracket, making it the least populous group.
| Income Bracket | # Households | % Households |
| Less than $10,000 | 261 | 3.9% |
| $10,000 to $14,999 | 335 | 5.0% |
| $15,000 to $24,999 | 630 | 9.4% |
| $25,000 to $34,999 | 576 | 8.6% |
| $35,000 to $49,999 | 442 | 6.6% |
| $50,000 to $74,999 | 991 | 14.8% |
| $75,000 to $99,999 | 831 | 12.4% |
| $100,000 to $149,999 | 1,031 | 15.4% |
| $150,000 to $199,999 | 676 | 10.1% |
| $200,000+ | 918 | 13.7% |
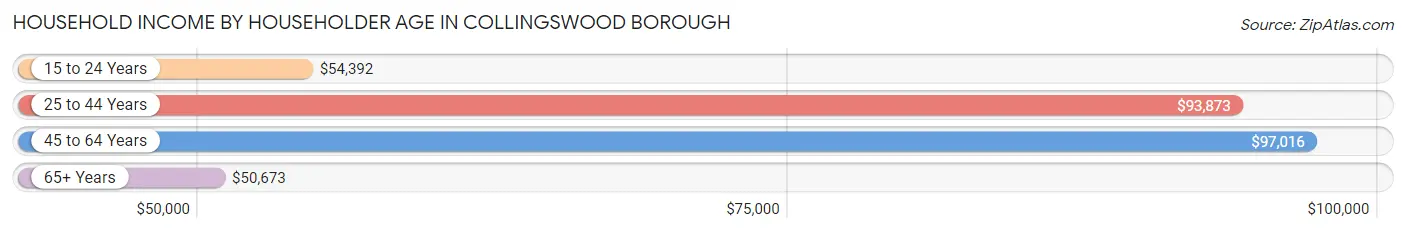
Household Income by Householder Age in Collingswood borough
The median household income in Collingswood borough is $78,909, with the highest median household income of $97,016 found in the 45 to 64 years age bracket for the primary householder. A total of 2,170 households (32.4%) fall into this category. Meanwhile, the 65+ years age bracket for the primary householder has the lowest median household income of $50,673, with 1,689 households (25.2%) in this group.
| Income Bracket | # Households | Median Income |
| 15 to 24 Years | 260 (3.9%) | $54,392 |
| 25 to 44 Years | 2,579 (38.5%) | $93,873 |
| 45 to 64 Years | 2,170 (32.4%) | $97,016 |
| 65+ Years | 1,689 (25.2%) | $50,673 |
| Total | 6,698 (100.0%) | $78,909 |
Poverty in Collingswood borough
Income Below Poverty by Sex and Age in Collingswood borough
With 11.7% poverty level for males and 12.0% for females among the residents of Collingswood borough, 18 to 24 year old males and 16 and 17 year old females are the most vulnerable to poverty, with 92 males (24.0%) and 49 females (40.8%) in their respective age groups living below the poverty level.
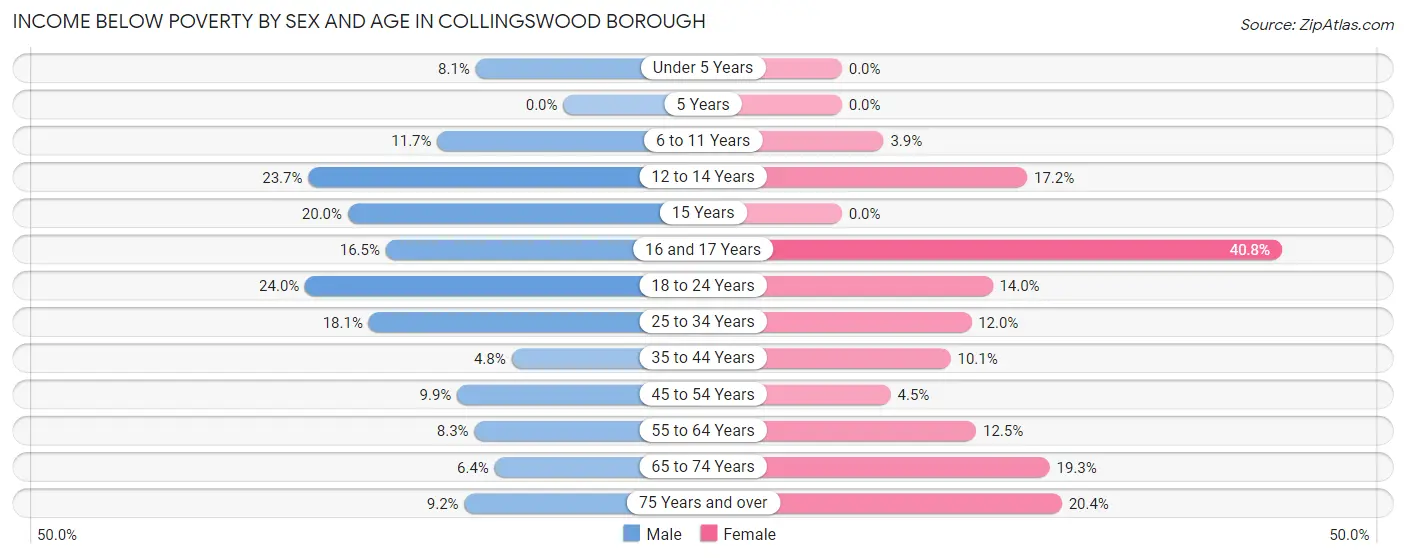
| Age Bracket | Male | Female |
| Under 5 Years | 24 (8.1%) | 0 (0.0%) |
| 5 Years | 0 (0.0%) | 0 (0.0%) |
| 6 to 11 Years | 54 (11.7%) | 13 (3.9%) |
| 12 to 14 Years | 49 (23.7%) | 22 (17.2%) |
| 15 Years | 13 (20.0%) | 0 (0.0%) |
| 16 and 17 Years | 43 (16.5%) | 49 (40.8%) |
| 18 to 24 Years | 92 (24.0%) | 91 (14.0%) |
| 25 to 34 Years | 240 (18.1%) | 135 (12.0%) |
| 35 to 44 Years | 55 (4.8%) | 113 (10.1%) |
| 45 to 54 Years | 87 (9.9%) | 41 (4.5%) |
| 55 to 64 Years | 67 (8.3%) | 122 (12.5%) |
| 65 to 74 Years | 37 (6.4%) | 118 (19.3%) |
| 75 Years and over | 28 (9.2%) | 161 (20.4%) |
| Total | 789 (11.7%) | 865 (12.0%) |
Income Above Poverty by Sex and Age in Collingswood borough
According to the poverty statistics in Collingswood borough, males aged 5 years and females aged under 5 years are the age groups that are most secure financially, with 100.0% of males and 100.0% of females in these age groups living above the poverty line.
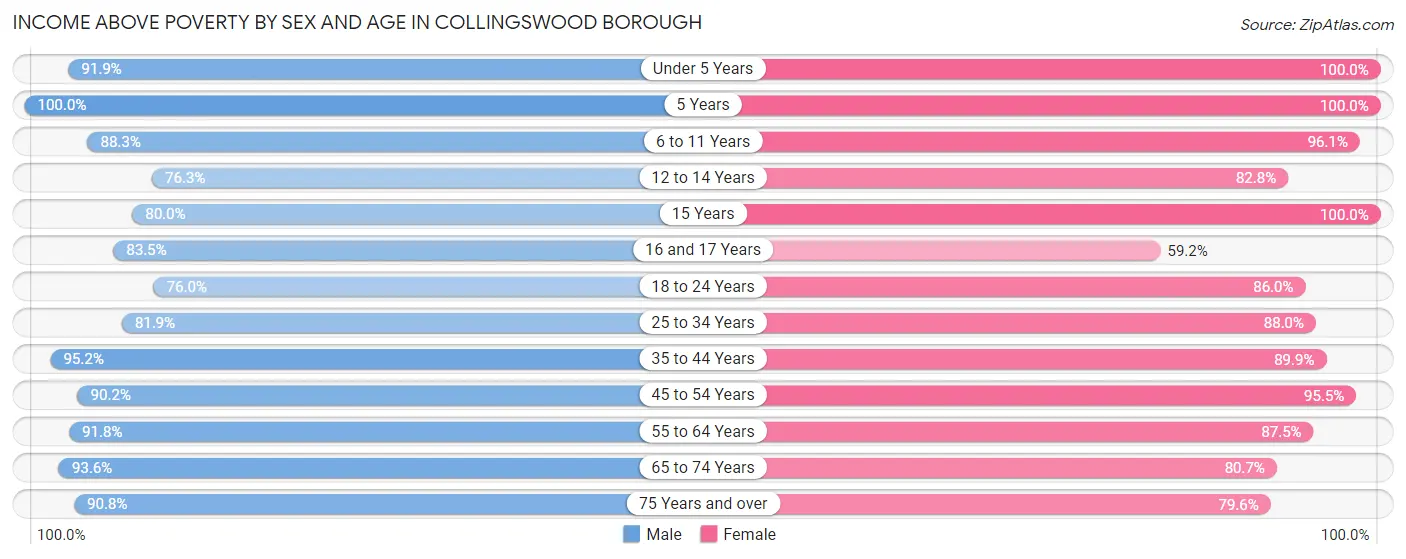
| Age Bracket | Male | Female |
| Under 5 Years | 271 (91.9%) | 281 (100.0%) |
| 5 Years | 18 (100.0%) | 119 (100.0%) |
| 6 to 11 Years | 408 (88.3%) | 323 (96.1%) |
| 12 to 14 Years | 158 (76.3%) | 106 (82.8%) |
| 15 Years | 52 (80.0%) | 52 (100.0%) |
| 16 and 17 Years | 218 (83.5%) | 71 (59.2%) |
| 18 to 24 Years | 292 (76.0%) | 560 (86.0%) |
| 25 to 34 Years | 1,089 (81.9%) | 989 (88.0%) |
| 35 to 44 Years | 1,089 (95.2%) | 1,007 (89.9%) |
| 45 to 54 Years | 796 (90.1%) | 864 (95.5%) |
| 55 to 64 Years | 745 (91.7%) | 857 (87.5%) |
| 65 to 74 Years | 544 (93.6%) | 494 (80.7%) |
| 75 Years and over | 277 (90.8%) | 628 (79.6%) |
| Total | 5,957 (88.3%) | 6,351 (88.0%) |
Income Below Poverty Among Married-Couple Families in Collingswood borough
The poverty statistics for married-couple families in Collingswood borough show that 5.1% or 133 of the total 2,609 families live below the poverty line. Families with 3 or 4 children have the highest poverty rate of 20.0%, comprising of 16 families. On the other hand, families with 1 or 2 children have the lowest poverty rate of 0.0%, which includes 0 families.
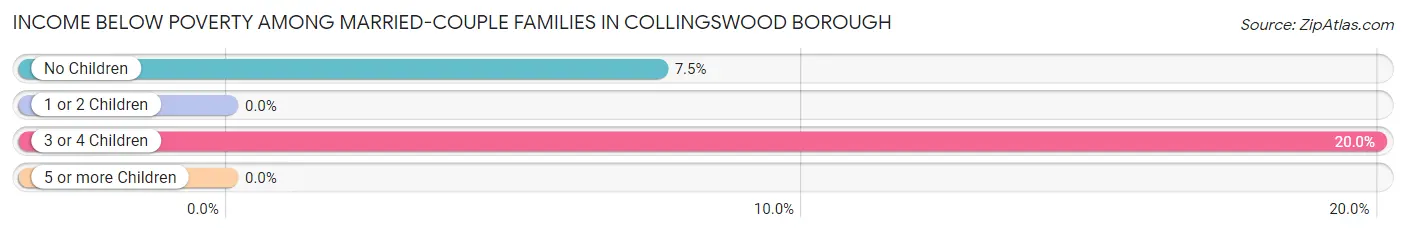
| Children | Above Poverty | Below Poverty |
| No Children | 1,447 (92.5%) | 117 (7.5%) |
| 1 or 2 Children | 965 (100.0%) | 0 (0.0%) |
| 3 or 4 Children | 64 (80.0%) | 16 (20.0%) |
| 5 or more Children | 0 (0.0%) | 0 (0.0%) |
| Total | 2,476 (94.9%) | 133 (5.1%) |
Income Below Poverty Among Single-Parent Households in Collingswood borough
According to the poverty data in Collingswood borough, 37.9% or 61 single-father households and 32.1% or 188 single-mother households are living below the poverty line. Among single-father households, those with 1 or 2 children have the highest poverty rate, with 61 households (70.9%) experiencing poverty. Likewise, among single-mother households, those with 1 or 2 children have the highest poverty rate, with 96 households (37.3%) falling below the poverty line.
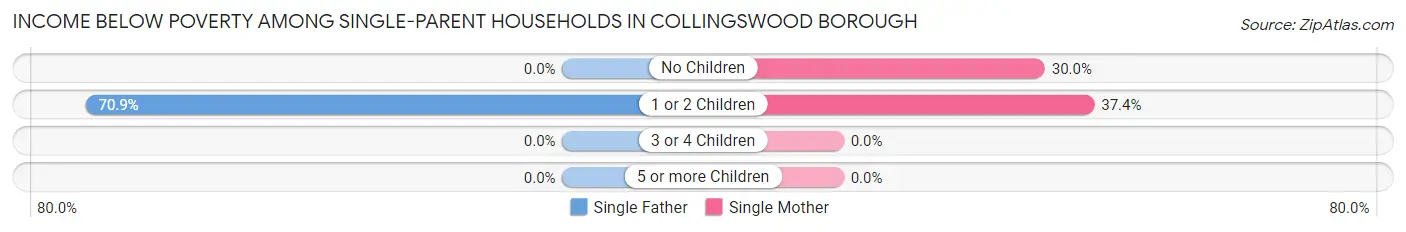
| Children | Single Father | Single Mother |
| No Children | 0 (0.0%) | 92 (30.0%) |
| 1 or 2 Children | 61 (70.9%) | 96 (37.3%) |
| 3 or 4 Children | 0 (0.0%) | 0 (0.0%) |
| 5 or more Children | 0 (0.0%) | 0 (0.0%) |
| Total | 61 (37.9%) | 188 (32.1%) |
Income Below Poverty Among Married-Couple vs Single-Parent Households in Collingswood borough
The poverty data for Collingswood borough shows that 133 of the married-couple family households (5.1%) and 249 of the single-parent households (33.4%) are living below the poverty level. Within the married-couple family households, those with 3 or 4 children have the highest poverty rate, with 16 households (20.0%) falling below the poverty line. Among the single-parent households, those with 1 or 2 children have the highest poverty rate, with 157 household (45.8%) living below poverty.
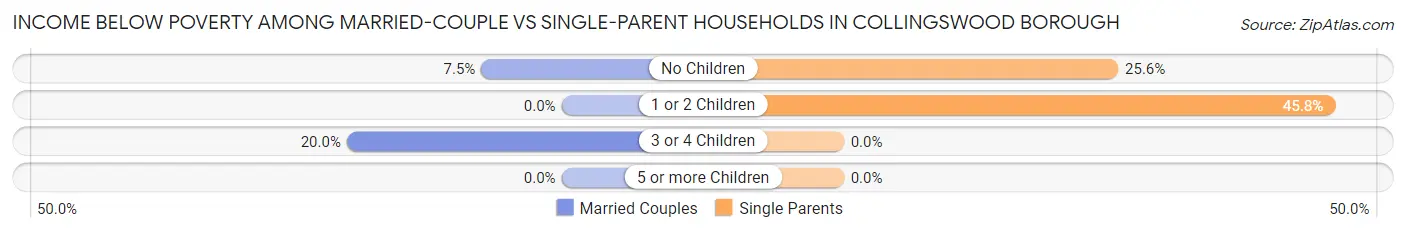
| Children | Married-Couple Families | Single-Parent Households |
| No Children | 117 (7.5%) | 92 (25.6%) |
| 1 or 2 Children | 0 (0.0%) | 157 (45.8%) |
| 3 or 4 Children | 16 (20.0%) | 0 (0.0%) |
| 5 or more Children | 0 (0.0%) | 0 (0.0%) |
| Total | 133 (5.1%) | 249 (33.4%) |
Race in Collingswood borough
The most populous races in Collingswood borough are White / Caucasian (11,313 | 80.0%), Black / African American (1,788 | 12.7%), and Hispanic or Latino (907 | 6.4%).
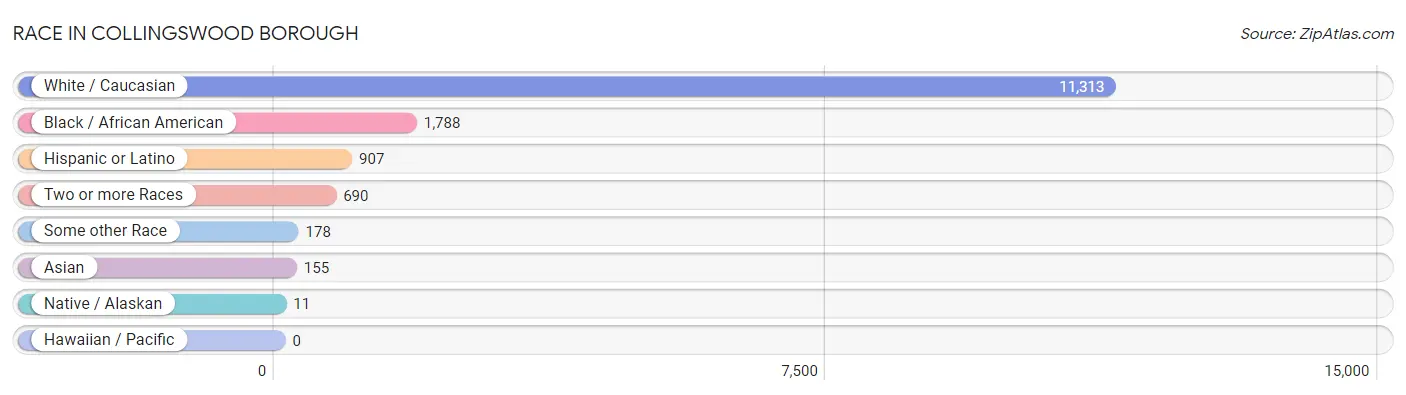
| Race | # Population | % Population |
| Asian | 155 | 1.1% |
| Black / African American | 1,788 | 12.7% |
| Hawaiian / Pacific | 0 | 0.0% |
| Hispanic or Latino | 907 | 6.4% |
| Native / Alaskan | 11 | 0.1% |
| White / Caucasian | 11,313 | 80.0% |
| Two or more Races | 690 | 4.9% |
| Some other Race | 178 | 1.3% |
| Total | 14,135 | 100.0% |
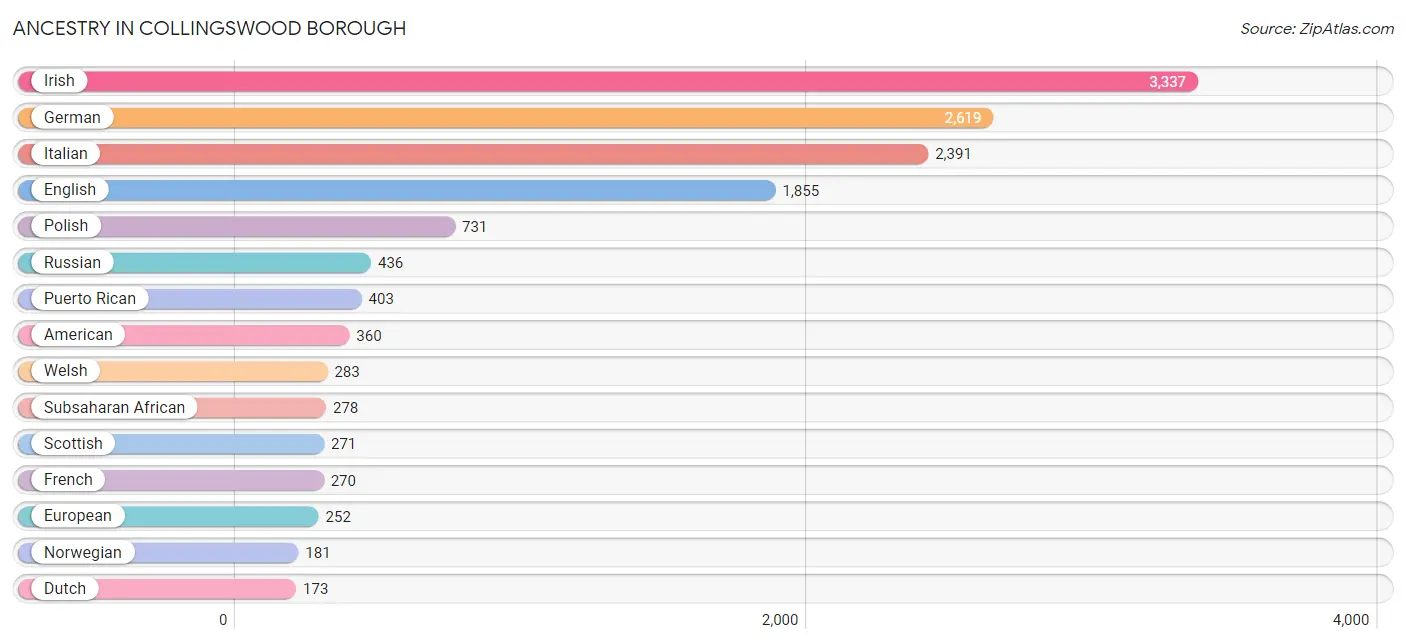
Ancestry in Collingswood borough
The most populous ancestries reported in Collingswood borough are Irish (3,337 | 23.6%), German (2,619 | 18.5%), Italian (2,391 | 16.9%), English (1,855 | 13.1%), and Polish (731 | 5.2%), together accounting for 77.3% of all Collingswood borough residents.
| Ancestry | # Population | % Population |
| African | 16 | 0.1% |
| Albanian | 27 | 0.2% |
| American | 360 | 2.5% |
| Arab | 20 | 0.1% |
| Armenian | 9 | 0.1% |
| Austrian | 25 | 0.2% |
| Bhutanese | 71 | 0.5% |
| Bolivian | 9 | 0.1% |
| Brazilian | 24 | 0.2% |
| British | 71 | 0.5% |
| Canadian | 8 | 0.1% |
| Celtic | 11 | 0.1% |
| Central American | 122 | 0.9% |
| Central American Indian | 29 | 0.2% |
| Cherokee | 19 | 0.1% |
| Chilean | 8 | 0.1% |
| Colombian | 57 | 0.4% |
| Costa Rican | 15 | 0.1% |
| Croatian | 8 | 0.1% |
| Cuban | 62 | 0.4% |
| Czech | 61 | 0.4% |
| Czechoslovakian | 12 | 0.1% |
| Danish | 6 | 0.0% |
| Dominican | 58 | 0.4% |
| Dutch | 173 | 1.2% |
| Eastern European | 119 | 0.8% |
| Ecuadorian | 19 | 0.1% |
| English | 1,855 | 13.1% |
| Estonian | 57 | 0.4% |
| Ethiopian | 157 | 1.1% |
| European | 252 | 1.8% |
| Finnish | 32 | 0.2% |
| French | 270 | 1.9% |
| French Canadian | 106 | 0.7% |
| German | 2,619 | 18.5% |
| Ghanaian | 59 | 0.4% |
| Greek | 120 | 0.9% |
| Guatemalan | 27 | 0.2% |
| Haitian | 83 | 0.6% |
| Honduran | 7 | 0.1% |
| Hungarian | 77 | 0.5% |
| Indian (Asian) | 134 | 0.9% |
| Irish | 3,337 | 23.6% |
| Italian | 2,391 | 16.9% |
| Jamaican | 35 | 0.3% |
| Korean | 113 | 0.8% |
| Laotian | 41 | 0.3% |
| Lithuanian | 53 | 0.4% |
| Mexican | 132 | 0.9% |
| Mexican American Indian | 27 | 0.2% |
| Nicaraguan | 32 | 0.2% |
| Nigerian | 46 | 0.3% |
| Northern European | 51 | 0.4% |
| Norwegian | 181 | 1.3% |
| Palestinian | 5 | 0.0% |
| Polish | 731 | 5.2% |
| Portuguese | 26 | 0.2% |
| Puerto Rican | 403 | 2.9% |
| Romanian | 17 | 0.1% |
| Russian | 436 | 3.1% |
| Salvadoran | 41 | 0.3% |
| Scandinavian | 22 | 0.2% |
| Scotch-Irish | 106 | 0.7% |
| Scottish | 271 | 1.9% |
| Slavic | 5 | 0.0% |
| Slovak | 19 | 0.1% |
| South American | 93 | 0.7% |
| South American Indian | 9 | 0.1% |
| Spaniard | 16 | 0.1% |
| Spanish | 7 | 0.1% |
| Sri Lankan | 1 | 0.0% |
| Subsaharan African | 278 | 2.0% |
| Swedish | 120 | 0.9% |
| Swiss | 55 | 0.4% |
| Syrian | 15 | 0.1% |
| Thai | 63 | 0.4% |
| Ukrainian | 119 | 0.8% |
| Welsh | 283 | 2.0% |
| Yugoslavian | 98 | 0.7% | View All 79 Rows |
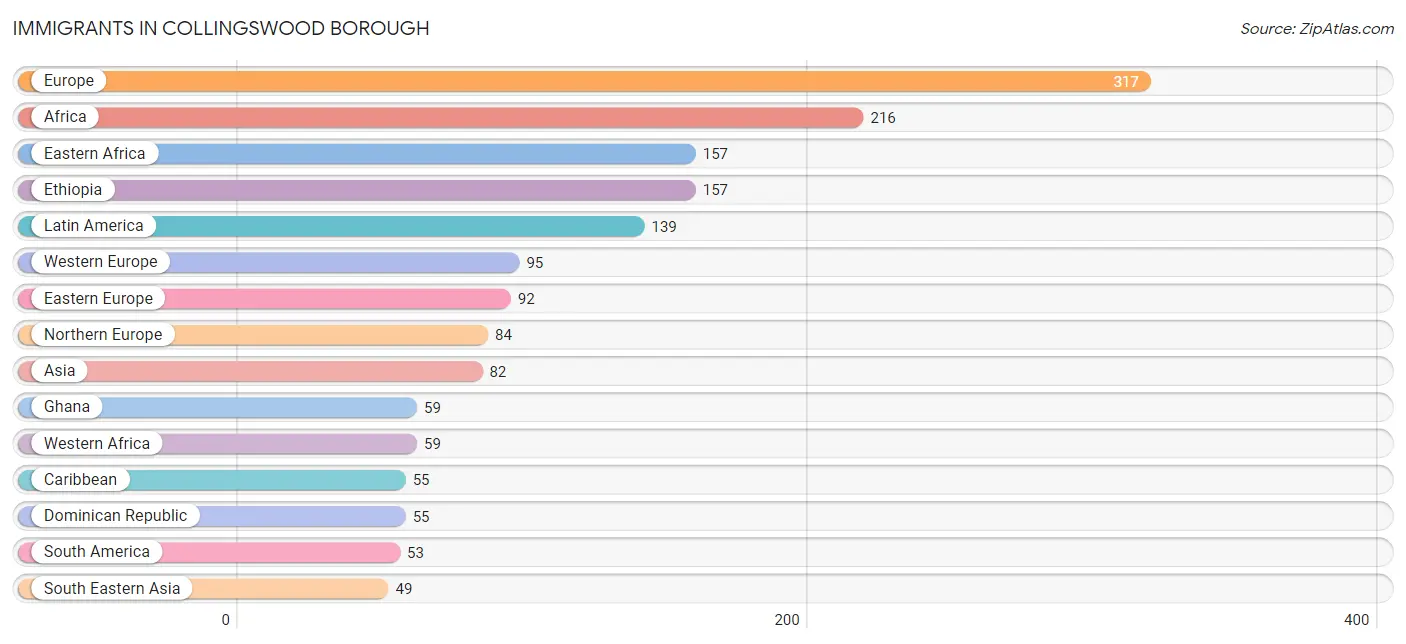
Immigrants in Collingswood borough
The most numerous immigrant groups reported in Collingswood borough came from Europe (317 | 2.2%), Africa (216 | 1.5%), Eastern Africa (157 | 1.1%), Ethiopia (157 | 1.1%), and Latin America (139 | 1.0%), together accounting for 7.0% of all Collingswood borough residents.
| Immigration Origin | # Population | % Population |
| Africa | 216 | 1.5% |
| Argentina | 8 | 0.1% |
| Asia | 82 | 0.6% |
| Australia | 7 | 0.1% |
| Bolivia | 9 | 0.1% |
| Bosnia and Herzegovina | 33 | 0.2% |
| Brazil | 10 | 0.1% |
| Canada | 43 | 0.3% |
| Caribbean | 55 | 0.4% |
| Central America | 31 | 0.2% |
| China | 28 | 0.2% |
| Colombia | 7 | 0.1% |
| Dominican Republic | 55 | 0.4% |
| Eastern Africa | 157 | 1.1% |
| Eastern Asia | 28 | 0.2% |
| Eastern Europe | 92 | 0.6% |
| Ecuador | 19 | 0.1% |
| England | 19 | 0.1% |
| Ethiopia | 157 | 1.1% |
| Europe | 317 | 2.2% |
| France | 19 | 0.1% |
| Germany | 12 | 0.1% |
| Ghana | 59 | 0.4% |
| Greece | 7 | 0.1% |
| Honduras | 7 | 0.1% |
| Israel | 5 | 0.0% |
| Italy | 23 | 0.2% |
| Latin America | 139 | 1.0% |
| Netherlands | 15 | 0.1% |
| Nicaragua | 24 | 0.2% |
| Northern Europe | 84 | 0.6% |
| Oceania | 18 | 0.1% |
| Philippines | 22 | 0.2% |
| Poland | 27 | 0.2% |
| Romania | 7 | 0.1% |
| South America | 53 | 0.4% |
| South Eastern Asia | 49 | 0.4% |
| Southern Europe | 46 | 0.3% |
| Spain | 16 | 0.1% |
| Sweden | 11 | 0.1% |
| Switzerland | 49 | 0.4% |
| Ukraine | 11 | 0.1% |
| Vietnam | 27 | 0.2% |
| Western Africa | 59 | 0.4% |
| Western Asia | 5 | 0.0% |
| Western Europe | 95 | 0.7% | View All 46 Rows |
Sex and Age in Collingswood borough
Sex and Age in Collingswood borough
The most populous age groups in Collingswood borough are 30 to 34 Years (717 | 10.4%) for men and 30 to 34 Years (737 | 10.2%) for women.
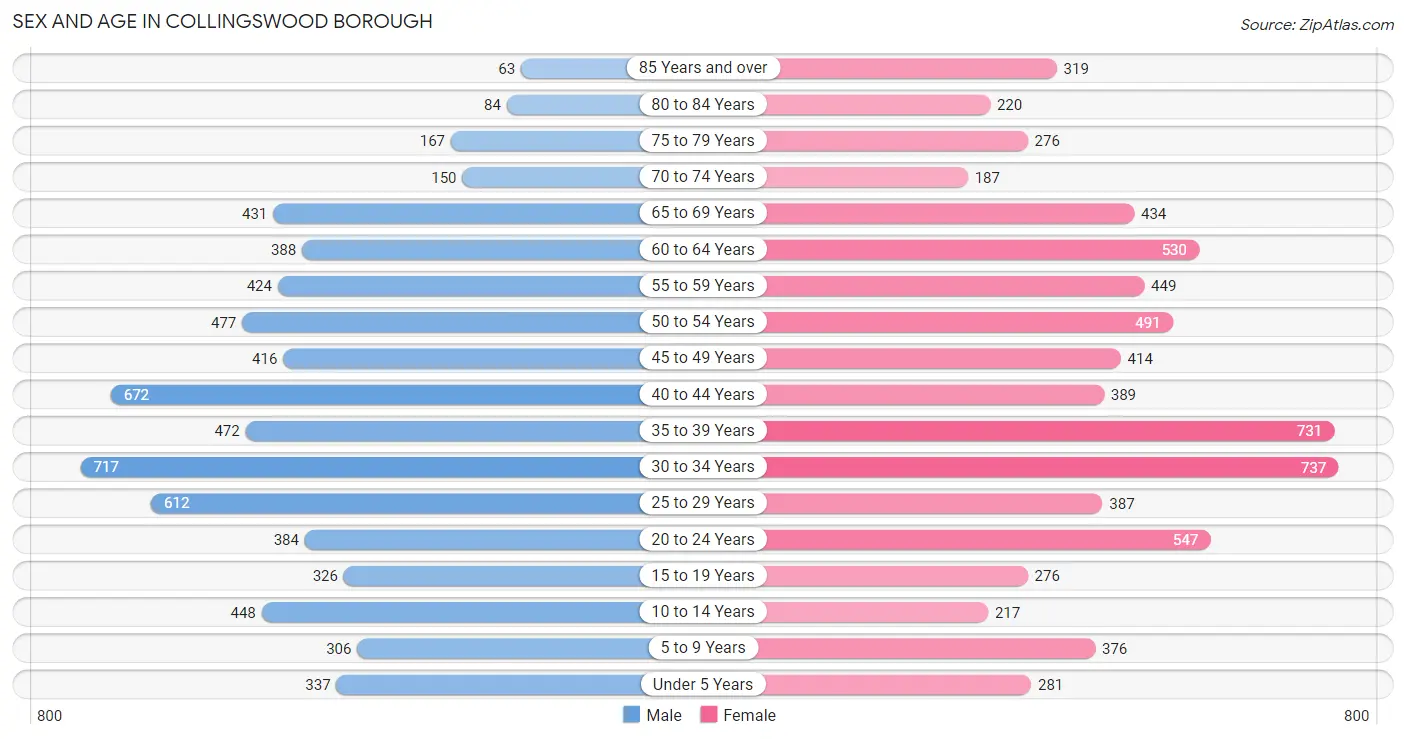
| Age Bracket | Male | Female |
| Under 5 Years | 337 (4.9%) | 281 (3.9%) |
| 5 to 9 Years | 306 (4.4%) | 376 (5.2%) |
| 10 to 14 Years | 448 (6.5%) | 217 (3.0%) |
| 15 to 19 Years | 326 (4.7%) | 276 (3.8%) |
| 20 to 24 Years | 384 (5.6%) | 547 (7.5%) |
| 25 to 29 Years | 612 (8.9%) | 387 (5.3%) |
| 30 to 34 Years | 717 (10.4%) | 737 (10.2%) |
| 35 to 39 Years | 472 (6.9%) | 731 (10.1%) |
| 40 to 44 Years | 672 (9.8%) | 389 (5.4%) |
| 45 to 49 Years | 416 (6.0%) | 414 (5.7%) |
| 50 to 54 Years | 477 (6.9%) | 491 (6.8%) |
| 55 to 59 Years | 424 (6.2%) | 449 (6.2%) |
| 60 to 64 Years | 388 (5.6%) | 530 (7.3%) |
| 65 to 69 Years | 431 (6.3%) | 434 (6.0%) |
| 70 to 74 Years | 150 (2.2%) | 187 (2.6%) |
| 75 to 79 Years | 167 (2.4%) | 276 (3.8%) |
| 80 to 84 Years | 84 (1.2%) | 220 (3.0%) |
| 85 Years and over | 63 (0.9%) | 319 (4.4%) |
| Total | 6,874 (100.0%) | 7,261 (100.0%) |
Families and Households in Collingswood borough
Median Family Size in Collingswood borough
The median family size in Collingswood borough is 2.90 persons per family, with married-couple families (2,609 | 77.8%) accounting for the largest median family size of 2.99 persons per family. On the other hand, single female/mother families (585 | 17.4%) represent the smallest median family size with 2.55 persons per family.
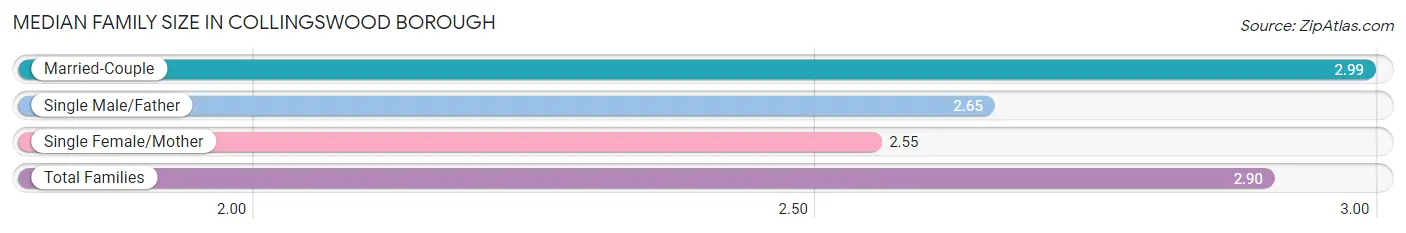
| Family Type | # Families | Family Size |
| Married-Couple | 2,609 (77.8%) | 2.99 |
| Single Male/Father | 161 (4.8%) | 2.65 |
| Single Female/Mother | 585 (17.4%) | 2.55 |
| Total Families | 3,355 (100.0%) | 2.90 |
Median Household Size in Collingswood borough
The median household size in Collingswood borough is 2.10 persons per household, with married-couple households (2,609 | 39.0%) accounting for the largest median household size of 3.01 persons per household. non-family households (3,343 | 49.9%) represent the smallest median household size with 1.26 persons per household.
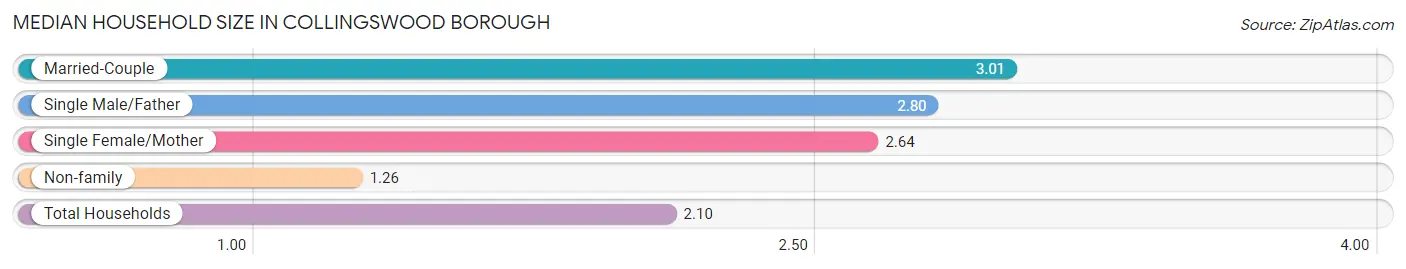
| Household Type | # Households | Household Size |
| Married-Couple | 2,609 (39.0%) | 3.01 |
| Single Male/Father | 161 (2.4%) | 2.80 |
| Single Female/Mother | 585 (8.7%) | 2.64 |
| Non-family | 3,343 (49.9%) | 1.26 |
| Total Households | 6,698 (100.0%) | 2.10 |
Household Size by Marriage Status in Collingswood borough
Out of a total of 6,698 households in Collingswood borough, 3,355 (50.1%) are family households, while 3,343 (49.9%) are nonfamily households. The most numerous type of family households are 2-person households, comprising 1,720, and the most common type of nonfamily households are 1-person households, comprising 2,591.
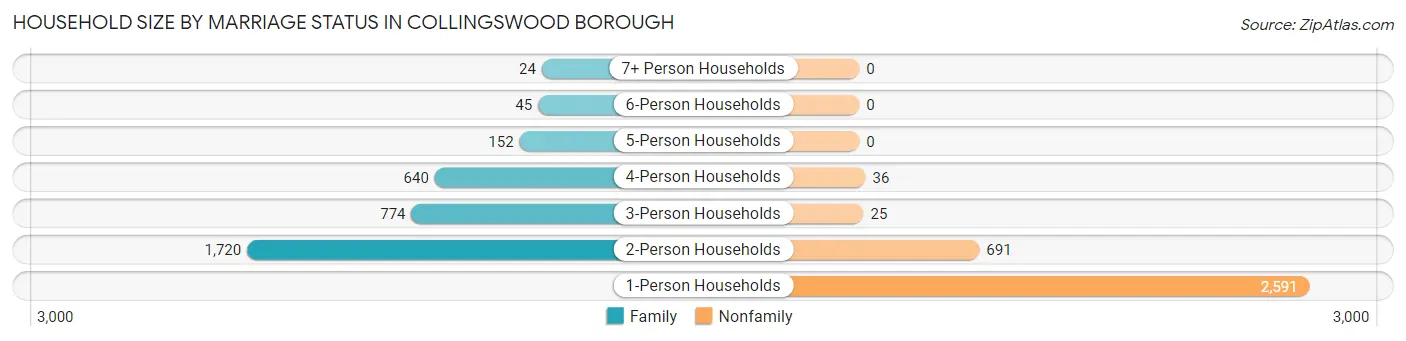
| Household Size | Family Households | Nonfamily Households |
| 1-Person Households | - | 2,591 (38.7%) |
| 2-Person Households | 1,720 (25.7%) | 691 (10.3%) |
| 3-Person Households | 774 (11.6%) | 25 (0.4%) |
| 4-Person Households | 640 (9.6%) | 36 (0.5%) |
| 5-Person Households | 152 (2.3%) | 0 (0.0%) |
| 6-Person Households | 45 (0.7%) | 0 (0.0%) |
| 7+ Person Households | 24 (0.4%) | 0 (0.0%) |
| Total | 3,355 (50.1%) | 3,343 (49.9%) |
Female Fertility in Collingswood borough
Fertility by Age in Collingswood borough
Average fertility rate in Collingswood borough is 17.0 births per 1,000 women. Women in the age bracket of 35 to 50 years have the highest fertility rate with 38.0 births per 1,000 women. Women in the age bracket of 35 to 50 years acount for 100.0% of all women with births.
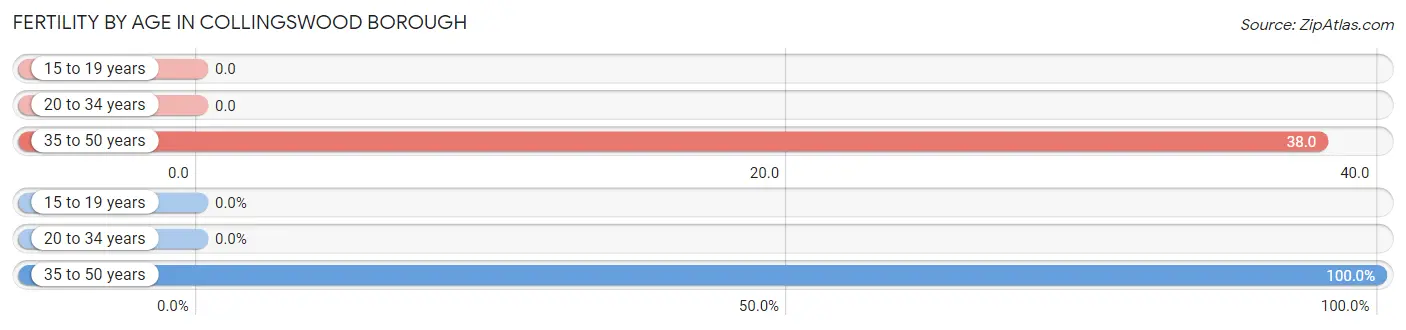
| Age Bracket | Women with Births | Births / 1,000 Women |
| 15 to 19 years | 0 (0.0%) | 0.0 |
| 20 to 34 years | 0 (0.0%) | 0.0 |
| 35 to 50 years | 62 (100.0%) | 38.0 |
| Total | 62 (100.0%) | 17.0 |
Fertility by Age by Marriage Status in Collingswood borough
62.9% of women with births (62) in Collingswood borough are married. The highest percentage of unmarried women with births falls into 35 to 50 years age bracket with 37.1% of them unmarried at the time of birth, while the lowest percentage of unmarried women with births belong to 35 to 50 years age bracket with 37.1% of them unmarried.
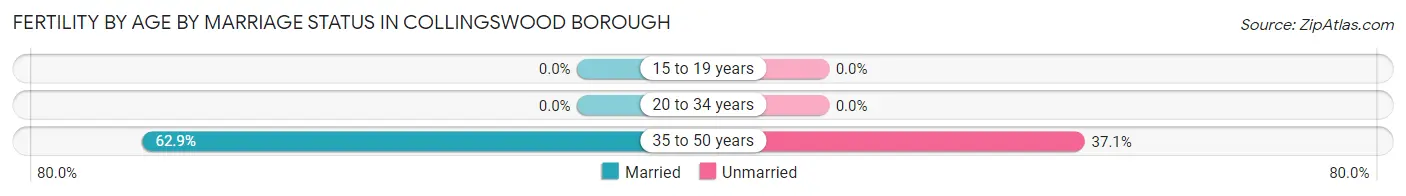
| Age Bracket | Married | Unmarried |
| 15 to 19 years | 0 (0.0%) | 0 (0.0%) |
| 20 to 34 years | 0 (0.0%) | 0 (0.0%) |
| 35 to 50 years | 39 (62.9%) | 23 (37.1%) |
| Total | 39 (62.9%) | 23 (37.1%) |
Fertility by Education in Collingswood borough
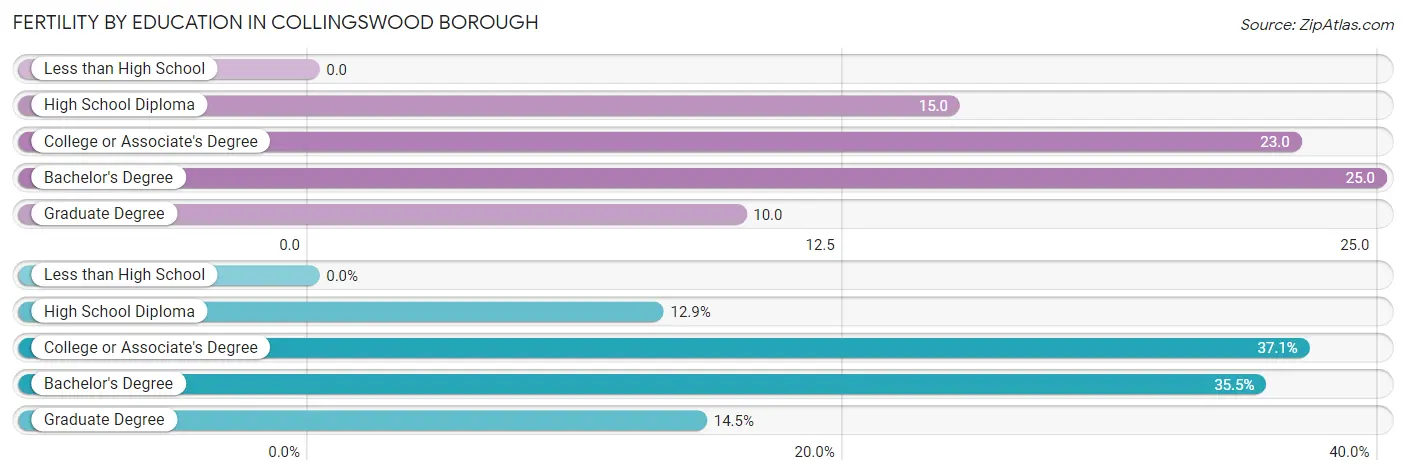
| Educational Attainment | Women with Births | Births / 1,000 Women |
| Less than High School | 0 (0.0%) | 0.0 |
| High School Diploma | 8 (12.9%) | 15.0 |
| College or Associate's Degree | 23 (37.1%) | 23.0 |
| Bachelor's Degree | 22 (35.5%) | 25.0 |
| Graduate Degree | 9 (14.5%) | 10.0 |
| Total | 62 (100.0%) | 17.0 |
Fertility by Education by Marriage Status in Collingswood borough
37.1% of women with births in Collingswood borough are unmarried. Women with the educational attainment of high school diploma are most likely to be married with 100.0% of them married at childbirth, while women with the educational attainment of bachelor's degree are least likely to be married with 63.6% of them unmarried at childbirth.
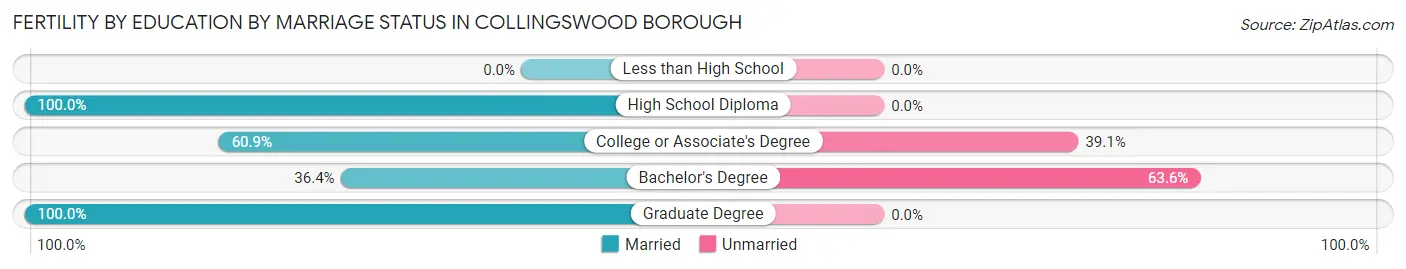
| Educational Attainment | Married | Unmarried |
| Less than High School | 0 (0.0%) | 0 (0.0%) |
| High School Diploma | 8 (100.0%) | 0 (0.0%) |
| College or Associate's Degree | 14 (60.9%) | 9 (39.1%) |
| Bachelor's Degree | 8 (36.4%) | 14 (63.6%) |
| Graduate Degree | 9 (100.0%) | 0 (0.0%) |
| Total | 39 (62.9%) | 23 (37.1%) |
Employment Characteristics in Collingswood borough
Employment by Class of Employer in Collingswood borough
Among the 7,718 employed individuals in Collingswood borough, private company employees (4,710 | 61.0%), not-for-profit organizations (931 | 12.1%), and local government employees (684 | 8.9%) make up the most common classes of employment.
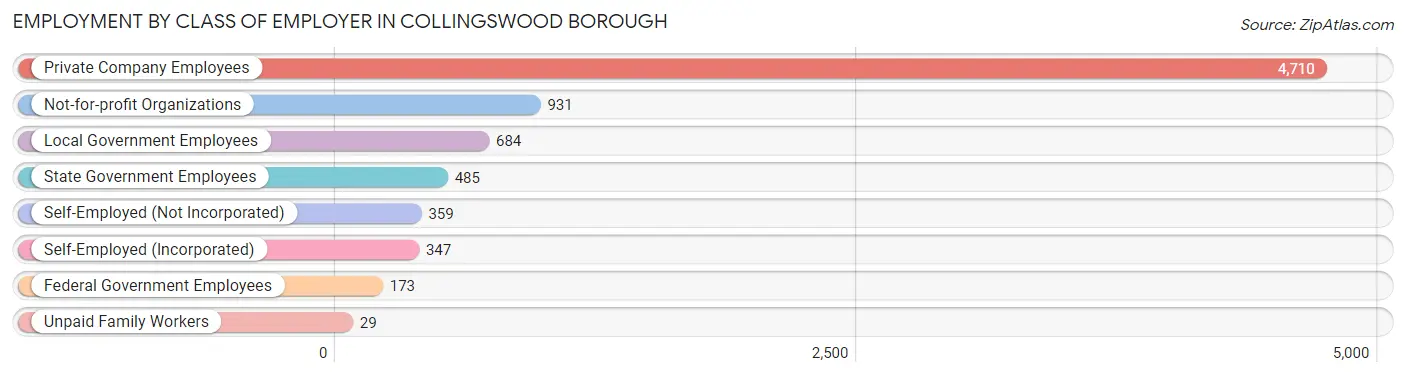
| Employer Class | # Employees | % Employees |
| Private Company Employees | 4,710 | 61.0% |
| Self-Employed (Incorporated) | 347 | 4.5% |
| Self-Employed (Not Incorporated) | 359 | 4.6% |
| Not-for-profit Organizations | 931 | 12.1% |
| Local Government Employees | 684 | 8.9% |
| State Government Employees | 485 | 6.3% |
| Federal Government Employees | 173 | 2.2% |
| Unpaid Family Workers | 29 | 0.4% |
| Total | 7,718 | 100.0% |
Employment Status by Age in Collingswood borough
According to the labor force statistics for Collingswood borough, out of the total population over 16 years of age (12,053), 71.6% or 8,630 individuals are in the labor force, with 8.1% or 699 of them unemployed. The age group with the highest labor force participation rate is 25 to 29 years, with 95.2% or 951 individuals in the labor force. Within the labor force, the 60 to 64 years age range has the highest percentage of unemployed individuals, with 17.1% or 95 of them being unemployed.
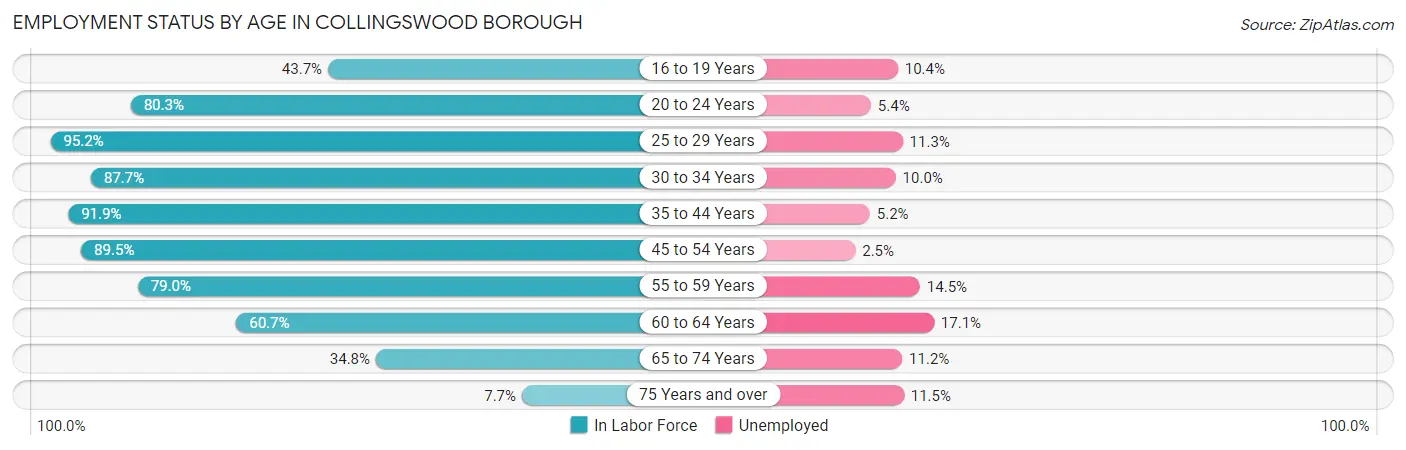
| Age Bracket | In Labor Force | Unemployed |
| 16 to 19 Years | 212 (43.7%) | 22 (10.4%) |
| 20 to 24 Years | 748 (80.3%) | 40 (5.4%) |
| 25 to 29 Years | 951 (95.2%) | 107 (11.3%) |
| 30 to 34 Years | 1,275 (87.7%) | 128 (10.0%) |
| 35 to 44 Years | 2,081 (91.9%) | 108 (5.2%) |
| 45 to 54 Years | 1,609 (89.5%) | 40 (2.5%) |
| 55 to 59 Years | 690 (79.0%) | 100 (14.5%) |
| 60 to 64 Years | 557 (60.7%) | 95 (17.1%) |
| 65 to 74 Years | 418 (34.8%) | 47 (11.2%) |
| 75 Years and over | 87 (7.7%) | 10 (11.5%) |
| Total | 8,630 (71.6%) | 699 (8.1%) |
Employment Status by Educational Attainment in Collingswood borough
According to labor force statistics for Collingswood borough, 86.3% of individuals (7,168) out of the total population between 25 and 64 years of age (8,306) are in the labor force, with 8.1% or 581 of them being unemployed. The group with the highest labor force participation rate are those with the educational attainment of bachelor's degree or higher, with 94.1% or 4,265 individuals in the labor force. Within the labor force, individuals with less than high school education have the highest percentage of unemployment, with 22.8% or 41 of them being unemployed.
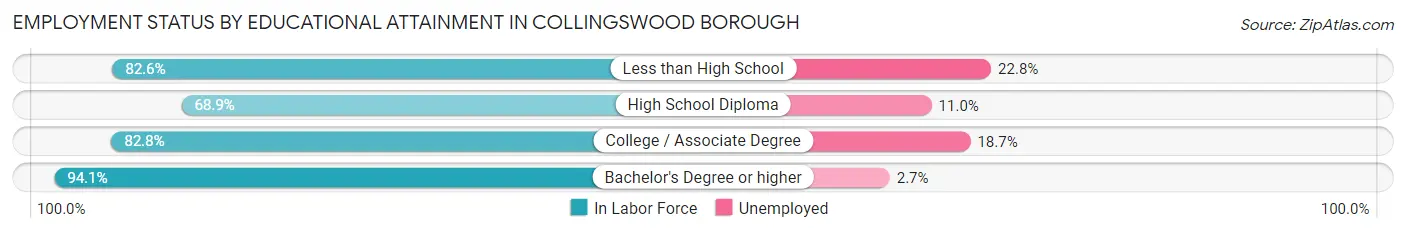
| Educational Attainment | In Labor Force | Unemployed |
| Less than High School | 180 (82.6%) | 50 (22.8%) |
| High School Diploma | 1,120 (68.9%) | 179 (11.0%) |
| College / Associate Degree | 1,599 (82.8%) | 361 (18.7%) |
| Bachelor's Degree or higher | 4,265 (94.1%) | 122 (2.7%) |
| Total | 7,168 (86.3%) | 673 (8.1%) |
Employment Occupations by Sex in Collingswood borough
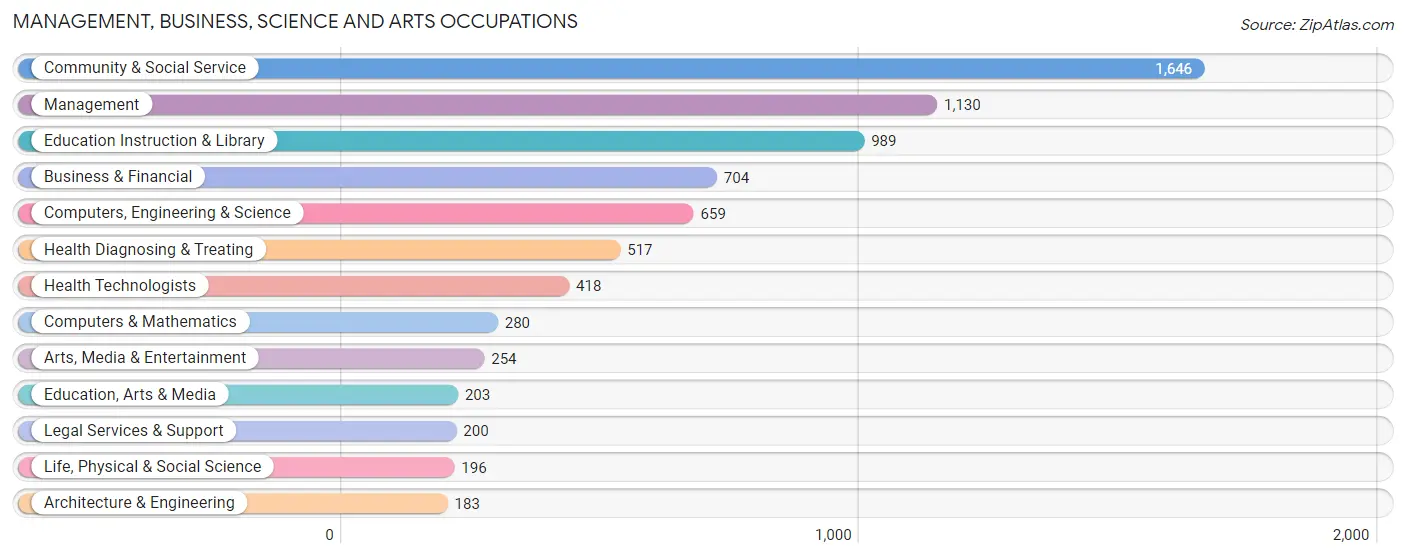
Management, Business, Science and Arts Occupations
The most common Management, Business, Science and Arts occupations in Collingswood borough are Community & Social Service (1,646 | 20.8%), Management (1,130 | 14.3%), Education Instruction & Library (989 | 12.5%), Business & Financial (704 | 8.9%), and Computers, Engineering & Science (659 | 8.3%).
Management, Business, Science and Arts Occupations by Sex
Within the Management, Business, Science and Arts occupations in Collingswood borough, the most male-oriented occupations are Computers & Mathematics (76.4%), Legal Services & Support (71.0%), and Architecture & Engineering (65.0%), while the most female-oriented occupations are Education, Arts & Media (80.8%), Health Diagnosing & Treating (79.3%), and Health Technologists (74.4%).
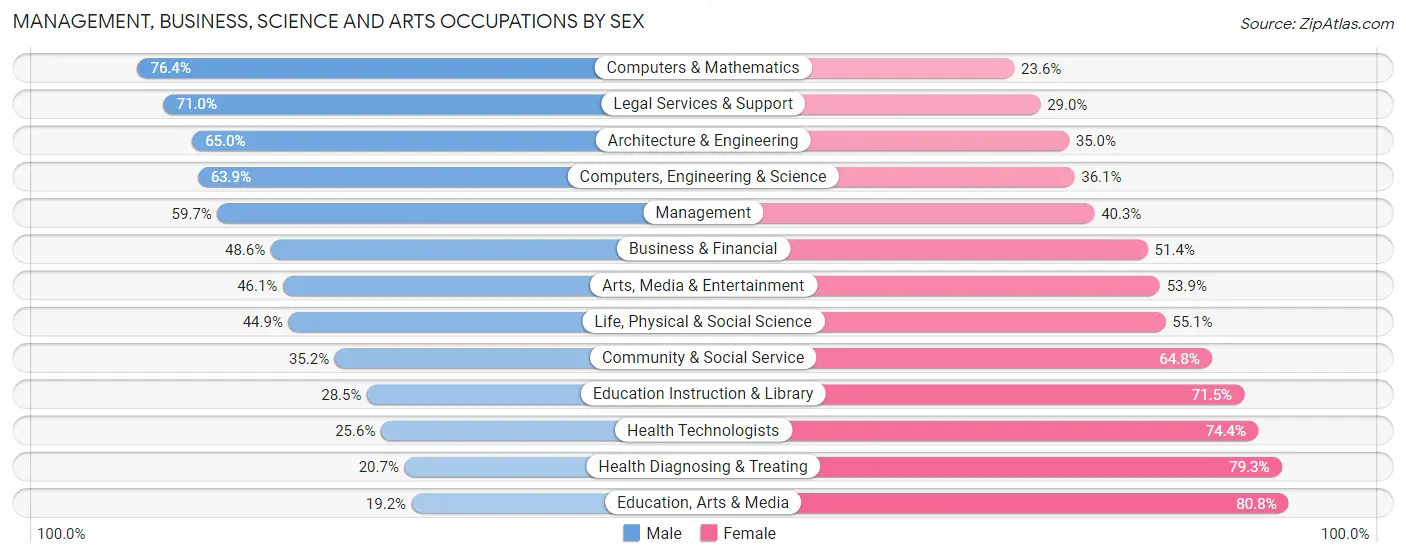
| Occupation | Male | Female |
| Management | 675 (59.7%) | 455 (40.3%) |
| Business & Financial | 342 (48.6%) | 362 (51.4%) |
| Computers, Engineering & Science | 421 (63.9%) | 238 (36.1%) |
| Computers & Mathematics | 214 (76.4%) | 66 (23.6%) |
| Architecture & Engineering | 119 (65.0%) | 64 (35.0%) |
| Life, Physical & Social Science | 88 (44.9%) | 108 (55.1%) |
| Community & Social Service | 580 (35.2%) | 1,066 (64.8%) |
| Education, Arts & Media | 39 (19.2%) | 164 (80.8%) |
| Legal Services & Support | 142 (71.0%) | 58 (29.0%) |
| Education Instruction & Library | 282 (28.5%) | 707 (71.5%) |
| Arts, Media & Entertainment | 117 (46.1%) | 137 (53.9%) |
| Health Diagnosing & Treating | 107 (20.7%) | 410 (79.3%) |
| Health Technologists | 107 (25.6%) | 311 (74.4%) |
| Total (Category) | 2,125 (45.6%) | 2,531 (54.4%) |
| Total (Overall) | 3,953 (49.9%) | 3,968 (50.1%) |
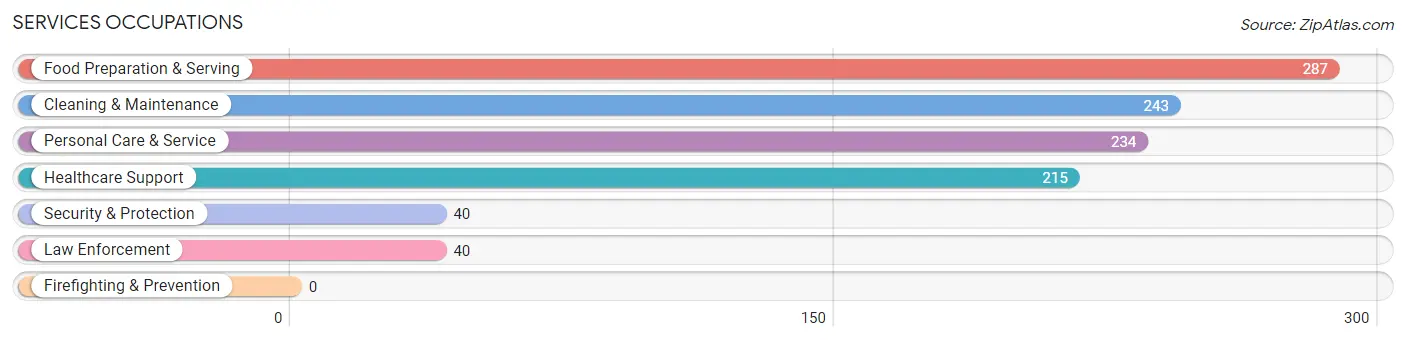
Services Occupations
The most common Services occupations in Collingswood borough are Food Preparation & Serving (287 | 3.6%), Cleaning & Maintenance (243 | 3.1%), Personal Care & Service (234 | 2.9%), Healthcare Support (215 | 2.7%), and Security & Protection (40 | 0.5%).
Services Occupations by Sex
Within the Services occupations in Collingswood borough, the most male-oriented occupations are Security & Protection (100.0%), Law Enforcement (100.0%), and Cleaning & Maintenance (84.8%), while the most female-oriented occupations are Healthcare Support (88.4%), Personal Care & Service (85.5%), and Food Preparation & Serving (42.2%).
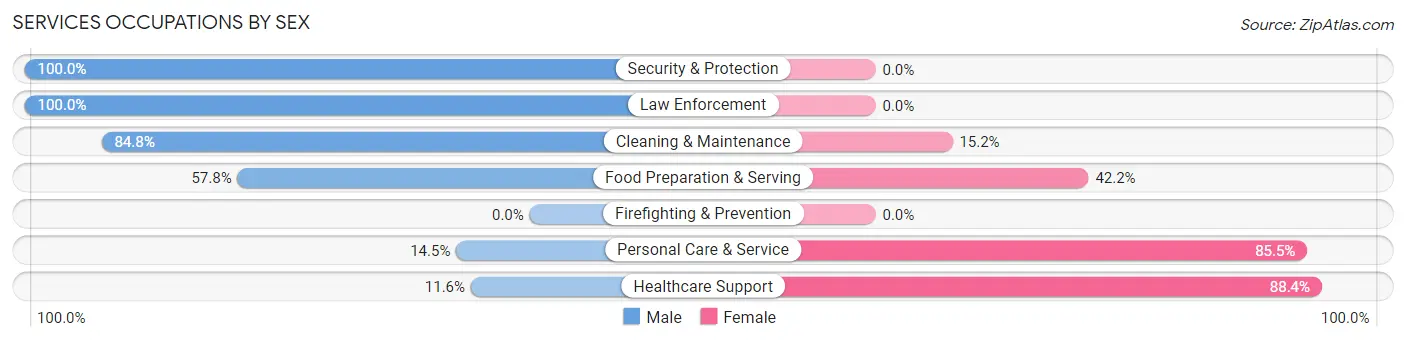
| Occupation | Male | Female |
| Healthcare Support | 25 (11.6%) | 190 (88.4%) |
| Security & Protection | 40 (100.0%) | 0 (0.0%) |
| Firefighting & Prevention | 0 (0.0%) | 0 (0.0%) |
| Law Enforcement | 40 (100.0%) | 0 (0.0%) |
| Food Preparation & Serving | 166 (57.8%) | 121 (42.2%) |
| Cleaning & Maintenance | 206 (84.8%) | 37 (15.2%) |
| Personal Care & Service | 34 (14.5%) | 200 (85.5%) |
| Total (Category) | 471 (46.2%) | 548 (53.8%) |
| Total (Overall) | 3,953 (49.9%) | 3,968 (50.1%) |
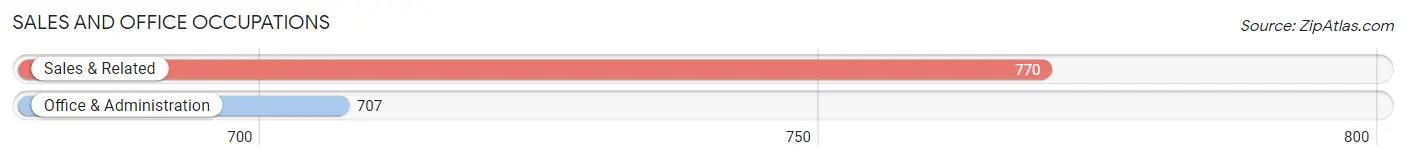
Sales and Office Occupations
The most common Sales and Office occupations in Collingswood borough are Sales & Related (770 | 9.7%), and Office & Administration (707 | 8.9%).
Sales and Office Occupations by Sex
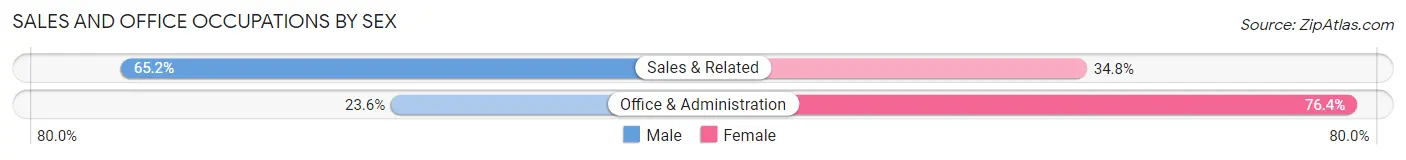
| Occupation | Male | Female |
| Sales & Related | 502 (65.2%) | 268 (34.8%) |
| Office & Administration | 167 (23.6%) | 540 (76.4%) |
| Total (Category) | 669 (45.3%) | 808 (54.7%) |
| Total (Overall) | 3,953 (49.9%) | 3,968 (50.1%) |
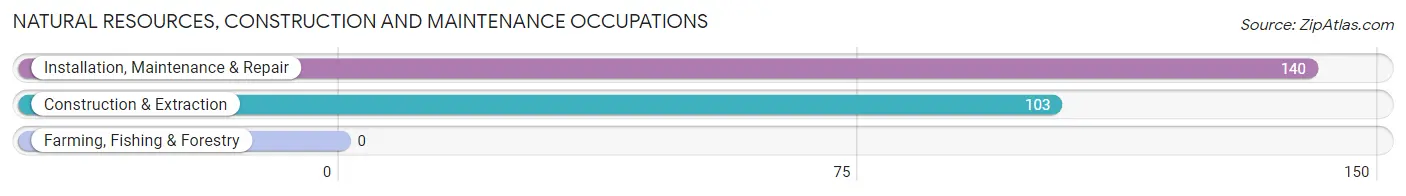
Natural Resources, Construction and Maintenance Occupations
The most common Natural Resources, Construction and Maintenance occupations in Collingswood borough are Installation, Maintenance & Repair (140 | 1.8%), and Construction & Extraction (103 | 1.3%).
Natural Resources, Construction and Maintenance Occupations by Sex
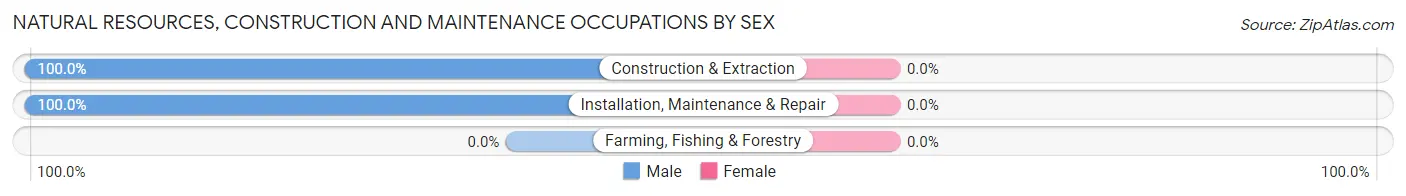
| Occupation | Male | Female |
| Farming, Fishing & Forestry | 0 (0.0%) | 0 (0.0%) |
| Construction & Extraction | 103 (100.0%) | 0 (0.0%) |
| Installation, Maintenance & Repair | 140 (100.0%) | 0 (0.0%) |
| Total (Category) | 243 (100.0%) | 0 (0.0%) |
| Total (Overall) | 3,953 (49.9%) | 3,968 (50.1%) |
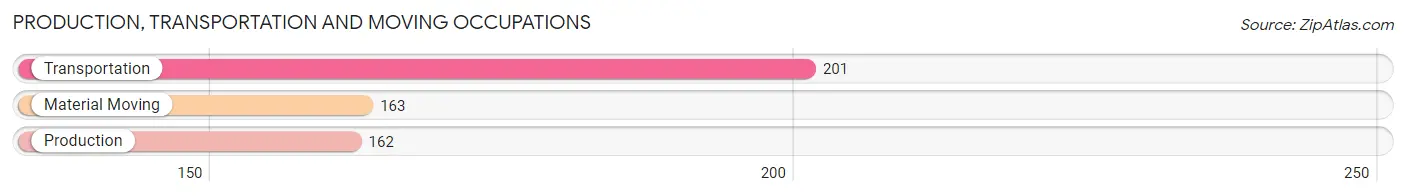
Production, Transportation and Moving Occupations
The most common Production, Transportation and Moving occupations in Collingswood borough are Transportation (201 | 2.5%), Material Moving (163 | 2.1%), and Production (162 | 2.1%).
Production, Transportation and Moving Occupations by Sex
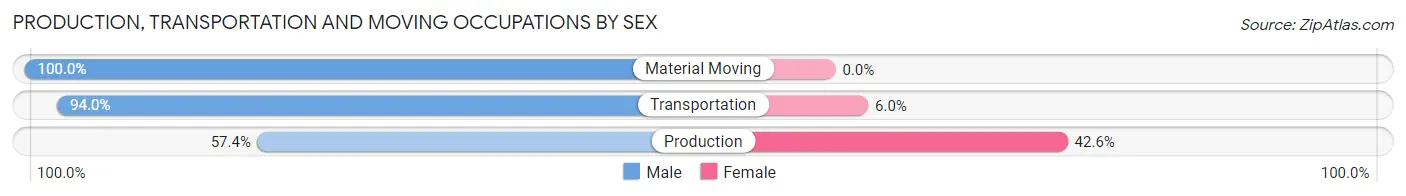
| Occupation | Male | Female |
| Production | 93 (57.4%) | 69 (42.6%) |
| Transportation | 189 (94.0%) | 12 (6.0%) |
| Material Moving | 163 (100.0%) | 0 (0.0%) |
| Total (Category) | 445 (84.6%) | 81 (15.4%) |
| Total (Overall) | 3,953 (49.9%) | 3,968 (50.1%) |
Employment Industries by Sex in Collingswood borough
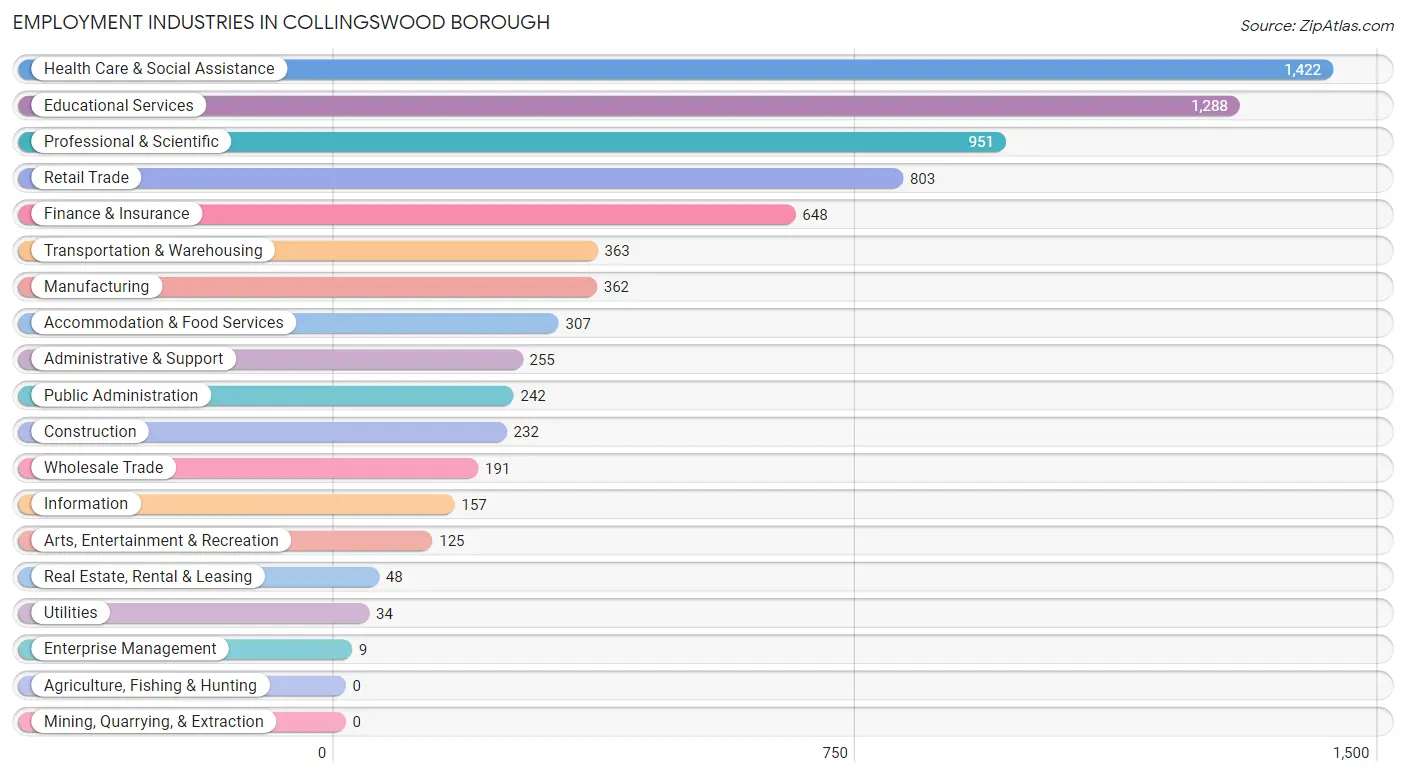
Employment Industries in Collingswood borough
The major employment industries in Collingswood borough include Health Care & Social Assistance (1,422 | 17.9%), Educational Services (1,288 | 16.3%), Professional & Scientific (951 | 12.0%), Retail Trade (803 | 10.1%), and Finance & Insurance (648 | 8.2%).
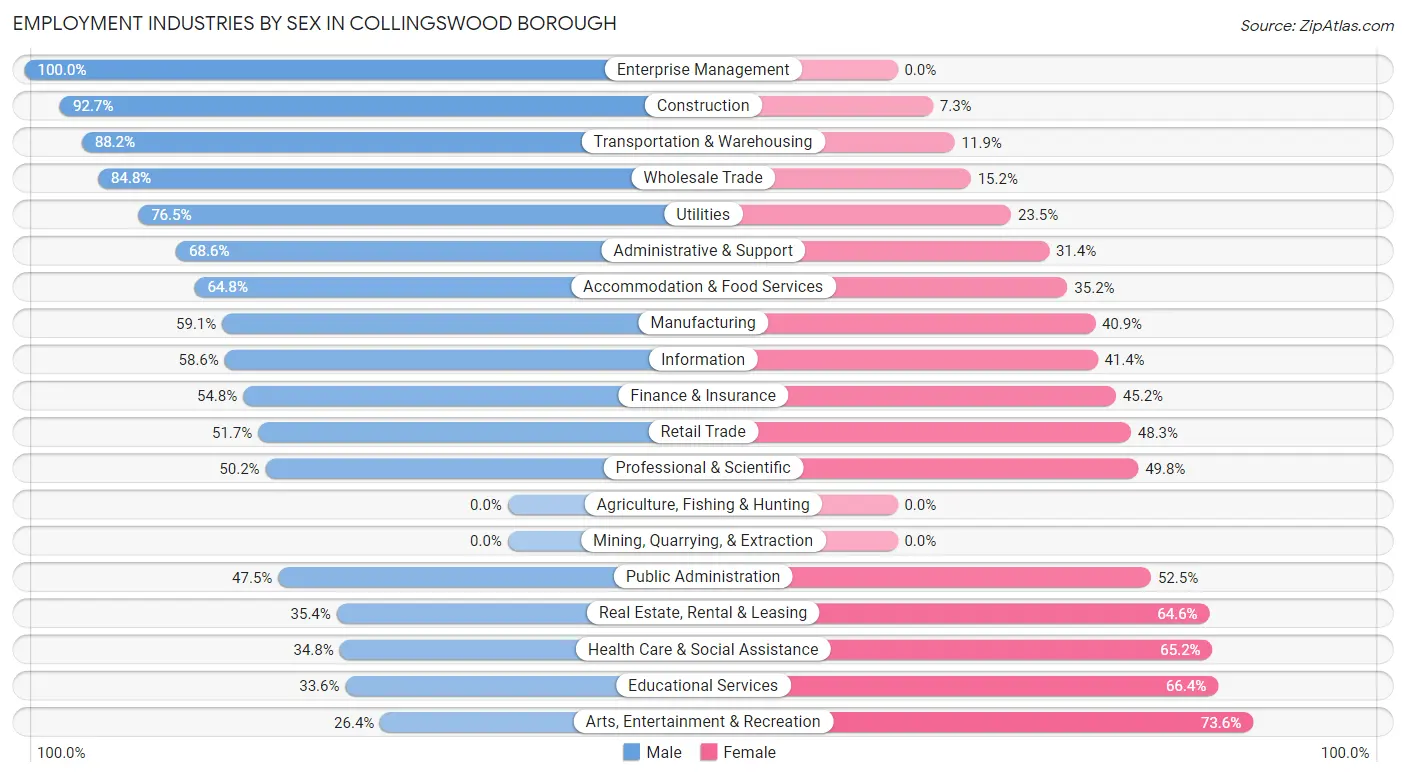
Employment Industries by Sex in Collingswood borough
The Collingswood borough industries that see more men than women are Enterprise Management (100.0%), Construction (92.7%), and Transportation & Warehousing (88.1%), whereas the industries that tend to have a higher number of women are Arts, Entertainment & Recreation (73.6%), Educational Services (66.4%), and Health Care & Social Assistance (65.2%).
| Industry | Male | Female |
| Agriculture, Fishing & Hunting | 0 (0.0%) | 0 (0.0%) |
| Mining, Quarrying, & Extraction | 0 (0.0%) | 0 (0.0%) |
| Construction | 215 (92.7%) | 17 (7.3%) |
| Manufacturing | 214 (59.1%) | 148 (40.9%) |
| Wholesale Trade | 162 (84.8%) | 29 (15.2%) |
| Retail Trade | 415 (51.7%) | 388 (48.3%) |
| Transportation & Warehousing | 320 (88.1%) | 43 (11.8%) |
| Utilities | 26 (76.5%) | 8 (23.5%) |
| Information | 92 (58.6%) | 65 (41.4%) |
| Finance & Insurance | 355 (54.8%) | 293 (45.2%) |
| Real Estate, Rental & Leasing | 17 (35.4%) | 31 (64.6%) |
| Professional & Scientific | 477 (50.2%) | 474 (49.8%) |
| Enterprise Management | 9 (100.0%) | 0 (0.0%) |
| Administrative & Support | 175 (68.6%) | 80 (31.4%) |
| Educational Services | 433 (33.6%) | 855 (66.4%) |
| Health Care & Social Assistance | 495 (34.8%) | 927 (65.2%) |
| Arts, Entertainment & Recreation | 33 (26.4%) | 92 (73.6%) |
| Accommodation & Food Services | 199 (64.8%) | 108 (35.2%) |
| Public Administration | 115 (47.5%) | 127 (52.5%) |
| Total | 3,953 (49.9%) | 3,968 (50.1%) |
Education in Collingswood borough
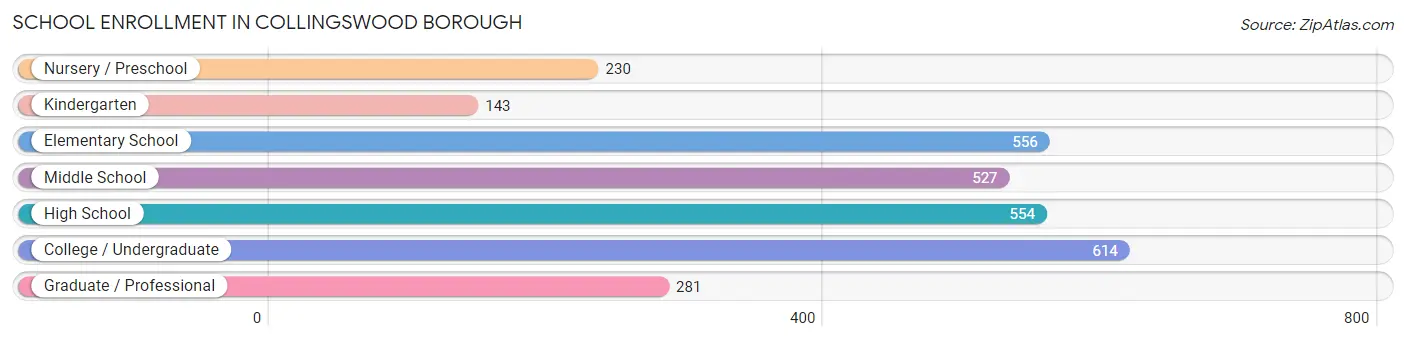
School Enrollment in Collingswood borough
The most common levels of schooling among the 2,905 students in Collingswood borough are college / undergraduate (614 | 21.1%), elementary school (556 | 19.1%), and high school (554 | 19.1%).
| School Level | # Students | % Students |
| Nursery / Preschool | 230 | 7.9% |
| Kindergarten | 143 | 4.9% |
| Elementary School | 556 | 19.1% |
| Middle School | 527 | 18.1% |
| High School | 554 | 19.1% |
| College / Undergraduate | 614 | 21.1% |
| Graduate / Professional | 281 | 9.7% |
| Total | 2,905 | 100.0% |
School Enrollment by Age by Funding Source in Collingswood borough
Out of a total of 2,905 students who are enrolled in schools in Collingswood borough, 375 (12.9%) attend a private institution, while the remaining 2,530 (87.1%) are enrolled in public schools. The age group of 3 to 4 year olds has the highest likelihood of being enrolled in private schools, with 102 (55.4% in the age bracket) enrolled. Conversely, the age group of 15 to 17 year olds has the lowest likelihood of being enrolled in a private school, with 490 (98.4% in the age bracket) attending a public institution.
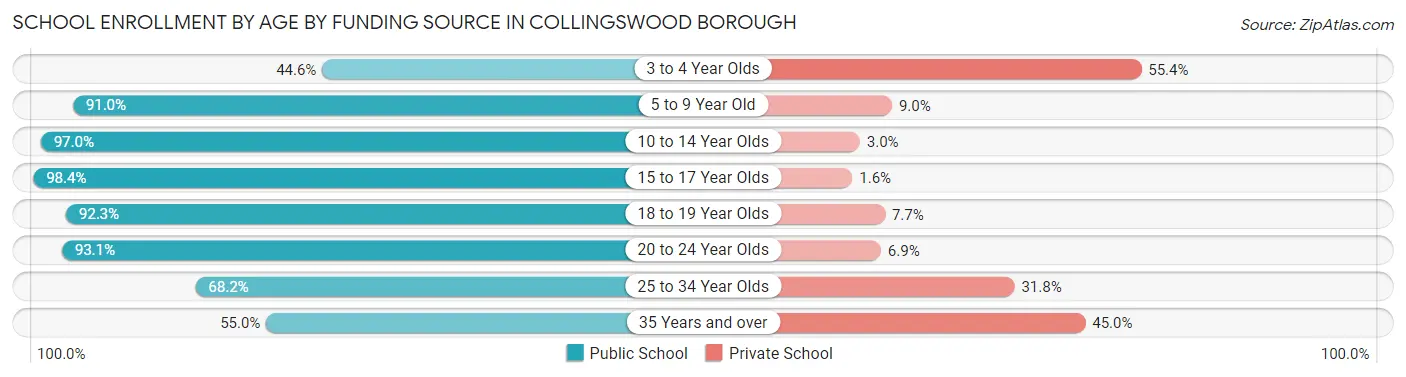
| Age Bracket | Public School | Private School |
| 3 to 4 Year Olds | 82 (44.6%) | 102 (55.4%) |
| 5 to 9 Year Old | 566 (91.0%) | 56 (9.0%) |
| 10 to 14 Year Olds | 645 (97.0%) | 20 (3.0%) |
| 15 to 17 Year Olds | 490 (98.4%) | 8 (1.6%) |
| 18 to 19 Year Olds | 96 (92.3%) | 8 (7.7%) |
| 20 to 24 Year Olds | 402 (93.1%) | 30 (6.9%) |
| 25 to 34 Year Olds | 150 (68.2%) | 70 (31.8%) |
| 35 Years and over | 99 (55.0%) | 81 (45.0%) |
| Total | 2,530 (87.1%) | 375 (12.9%) |
Educational Attainment by Field of Study in Collingswood borough
Business (818 | 14.0%), social sciences (599 | 10.2%), literature & languages (558 | 9.5%), liberal arts & history (545 | 9.3%), and science & technology (530 | 9.1%) are the most common fields of study among 5,851 individuals in Collingswood borough who have obtained a bachelor's degree or higher.
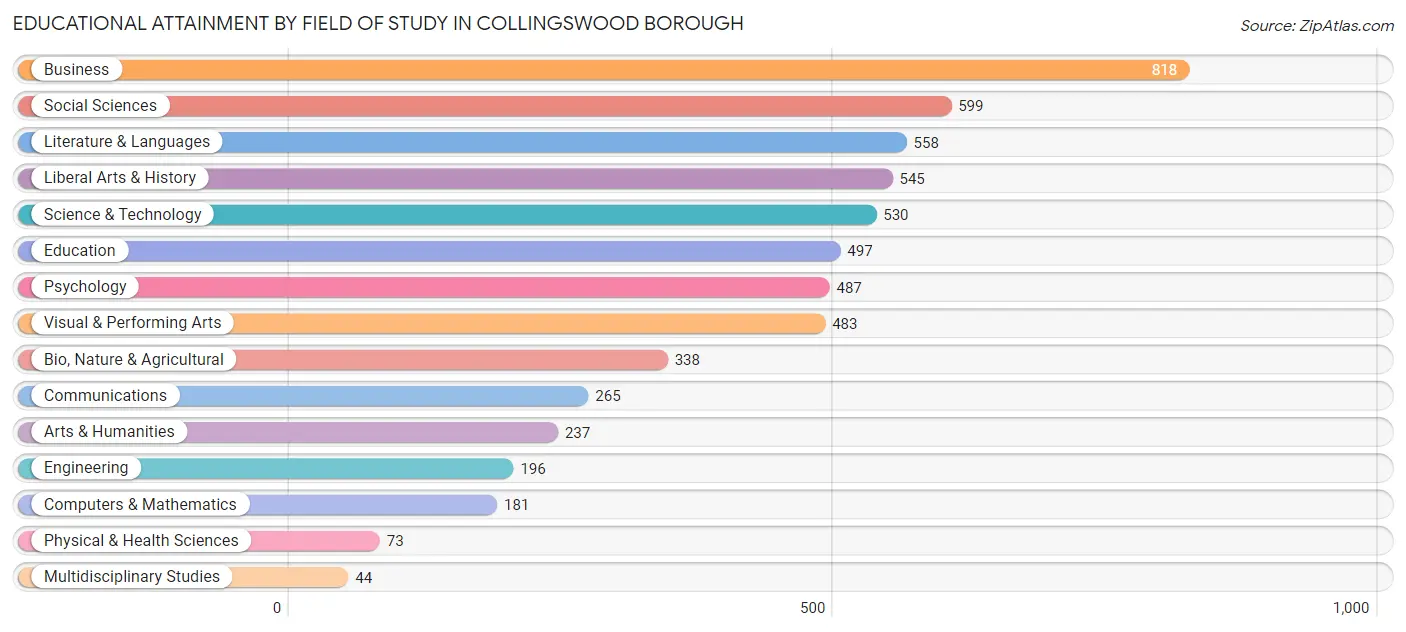
| Field of Study | # Graduates | % Graduates |
| Computers & Mathematics | 181 | 3.1% |
| Bio, Nature & Agricultural | 338 | 5.8% |
| Physical & Health Sciences | 73 | 1.3% |
| Psychology | 487 | 8.3% |
| Social Sciences | 599 | 10.2% |
| Engineering | 196 | 3.4% |
| Multidisciplinary Studies | 44 | 0.7% |
| Science & Technology | 530 | 9.1% |
| Business | 818 | 14.0% |
| Education | 497 | 8.5% |
| Literature & Languages | 558 | 9.5% |
| Liberal Arts & History | 545 | 9.3% |
| Visual & Performing Arts | 483 | 8.3% |
| Communications | 265 | 4.5% |
| Arts & Humanities | 237 | 4.1% |
| Total | 5,851 | 100.0% |
Transportation & Commute in Collingswood borough
Vehicle Availability by Sex in Collingswood borough
The most prevalent vehicle ownership categories in Collingswood borough are males with 2 vehicles (1,782, accounting for 45.8%) and females with 2 vehicles (1,569, making up 46.6%).
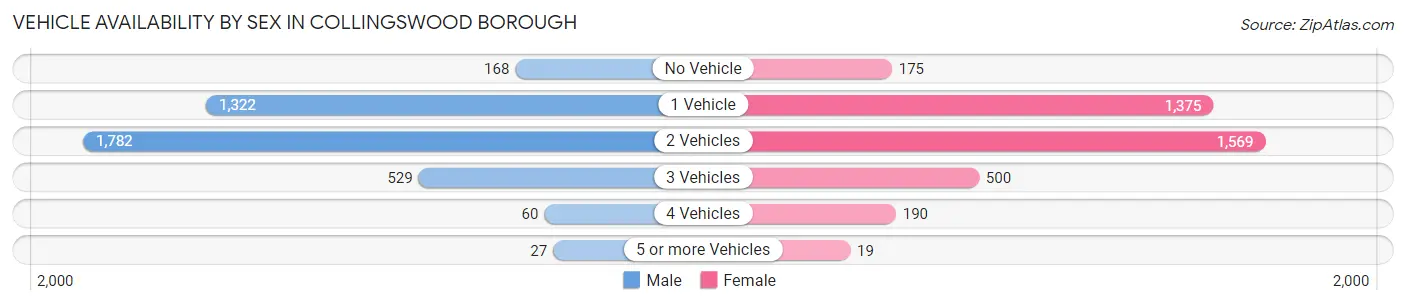
| Vehicles Available | Male | Female |
| No Vehicle | 168 (4.3%) | 175 (4.6%) |
| 1 Vehicle | 1,322 (34.0%) | 1,375 (35.9%) |
| 2 Vehicles | 1,782 (45.8%) | 1,569 (41.0%) |
| 3 Vehicles | 529 (13.6%) | 500 (13.1%) |
| 4 Vehicles | 60 (1.5%) | 190 (5.0%) |
| 5 or more Vehicles | 27 (0.7%) | 19 (0.5%) |
| Total | 3,888 (100.0%) | 3,828 (100.0%) |
Commute Time in Collingswood borough
The most frequently occuring commute durations in Collingswood borough are 30 to 34 minutes (954 commuters, 15.3%), 20 to 24 minutes (917 commuters, 14.7%), and 15 to 19 minutes (896 commuters, 14.4%).
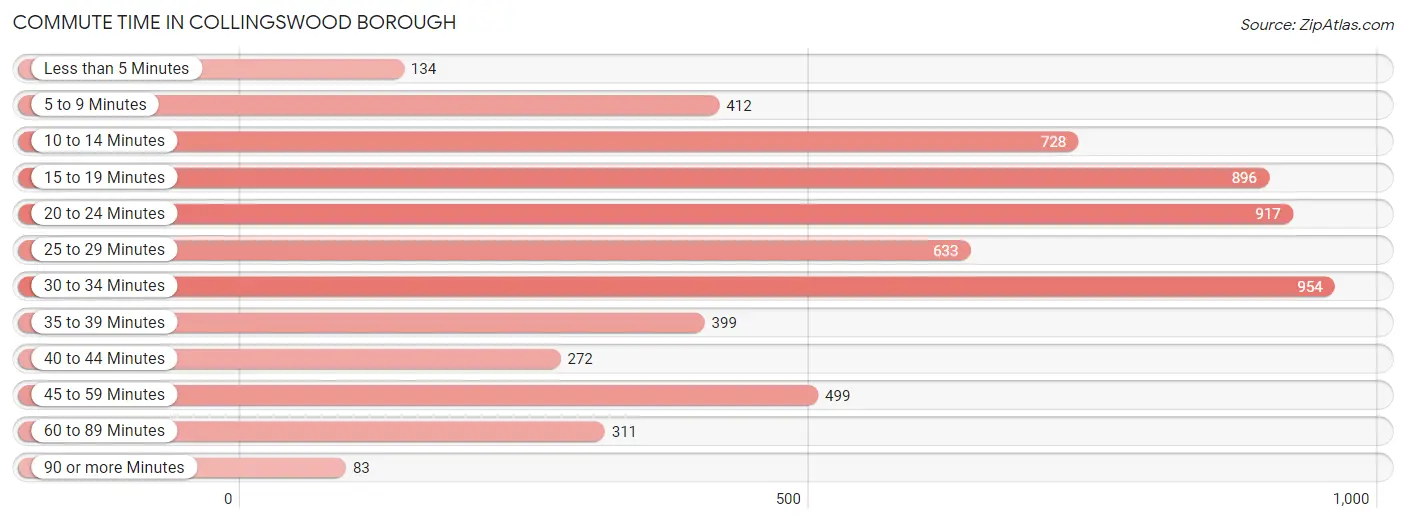
| Commute Time | # Commuters | % Commuters |
| Less than 5 Minutes | 134 | 2.1% |
| 5 to 9 Minutes | 412 | 6.6% |
| 10 to 14 Minutes | 728 | 11.7% |
| 15 to 19 Minutes | 896 | 14.4% |
| 20 to 24 Minutes | 917 | 14.7% |
| 25 to 29 Minutes | 633 | 10.2% |
| 30 to 34 Minutes | 954 | 15.3% |
| 35 to 39 Minutes | 399 | 6.4% |
| 40 to 44 Minutes | 272 | 4.4% |
| 45 to 59 Minutes | 499 | 8.0% |
| 60 to 89 Minutes | 311 | 5.0% |
| 90 or more Minutes | 83 | 1.3% |
Commute Time by Sex in Collingswood borough
The most common commute times in Collingswood borough are 30 to 34 minutes (528 commuters, 17.1%) for males and 20 to 24 minutes (504 commuters, 16.0%) for females.
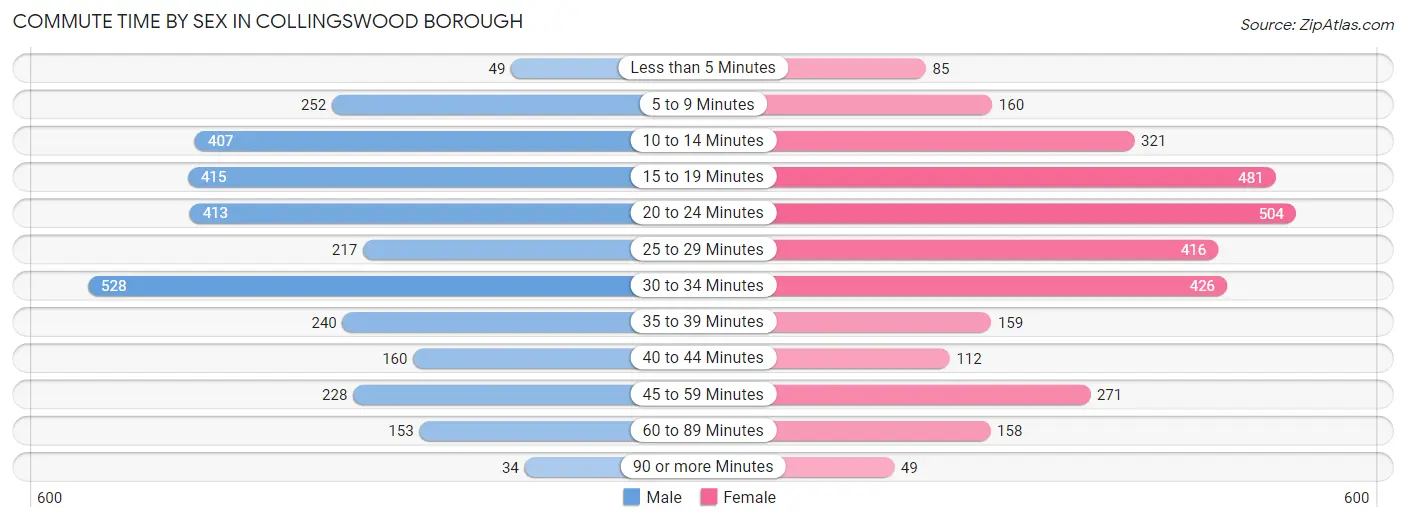
| Commute Time | Male | Female |
| Less than 5 Minutes | 49 (1.6%) | 85 (2.7%) |
| 5 to 9 Minutes | 252 (8.1%) | 160 (5.1%) |
| 10 to 14 Minutes | 407 (13.2%) | 321 (10.2%) |
| 15 to 19 Minutes | 415 (13.4%) | 481 (15.3%) |
| 20 to 24 Minutes | 413 (13.3%) | 504 (16.0%) |
| 25 to 29 Minutes | 217 (7.0%) | 416 (13.2%) |
| 30 to 34 Minutes | 528 (17.1%) | 426 (13.6%) |
| 35 to 39 Minutes | 240 (7.7%) | 159 (5.1%) |
| 40 to 44 Minutes | 160 (5.2%) | 112 (3.6%) |
| 45 to 59 Minutes | 228 (7.4%) | 271 (8.6%) |
| 60 to 89 Minutes | 153 (4.9%) | 158 (5.0%) |
| 90 or more Minutes | 34 (1.1%) | 49 (1.6%) |
Time of Departure to Work by Sex in Collingswood borough
The most frequent times of departure to work in Collingswood borough are 7:00 AM to 7:29 AM (471, 15.2%) for males and 8:00 AM to 8:29 AM (593, 18.9%) for females.
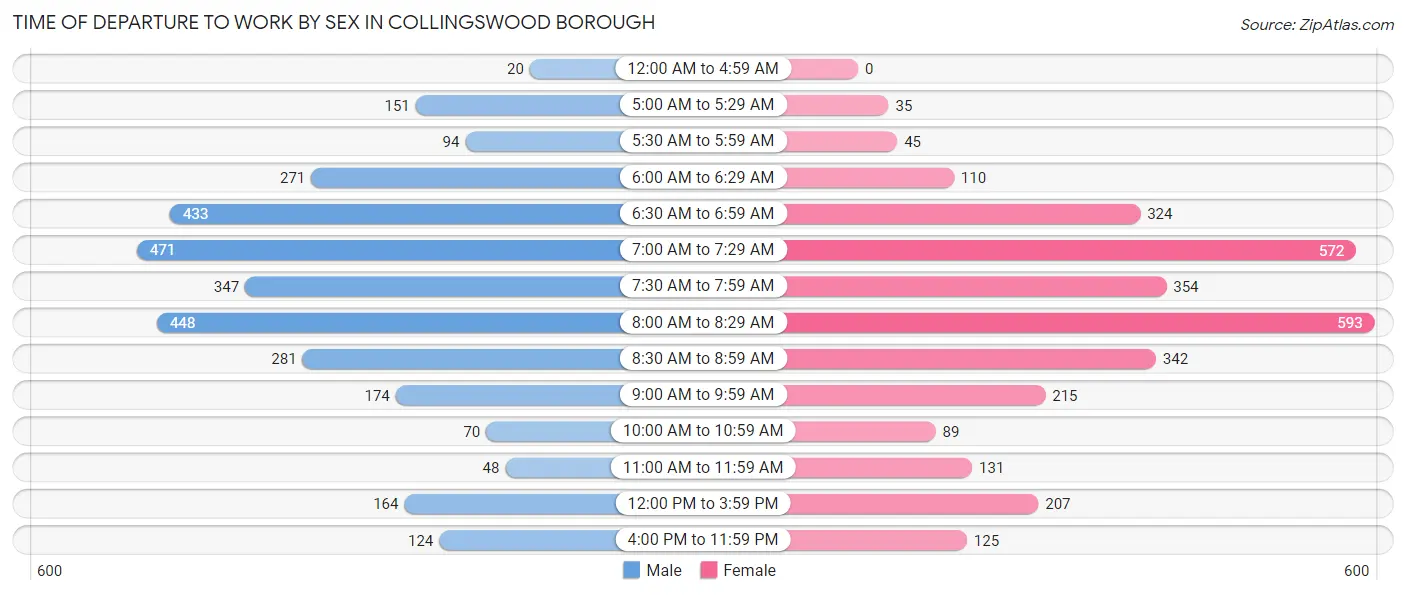
| Time of Departure | Male | Female |
| 12:00 AM to 4:59 AM | 20 (0.6%) | 0 (0.0%) |
| 5:00 AM to 5:29 AM | 151 (4.9%) | 35 (1.1%) |
| 5:30 AM to 5:59 AM | 94 (3.0%) | 45 (1.4%) |
| 6:00 AM to 6:29 AM | 271 (8.7%) | 110 (3.5%) |
| 6:30 AM to 6:59 AM | 433 (14.0%) | 324 (10.3%) |
| 7:00 AM to 7:29 AM | 471 (15.2%) | 572 (18.2%) |
| 7:30 AM to 7:59 AM | 347 (11.2%) | 354 (11.3%) |
| 8:00 AM to 8:29 AM | 448 (14.5%) | 593 (18.9%) |
| 8:30 AM to 8:59 AM | 281 (9.1%) | 342 (10.9%) |
| 9:00 AM to 9:59 AM | 174 (5.6%) | 215 (6.8%) |
| 10:00 AM to 10:59 AM | 70 (2.3%) | 89 (2.8%) |
| 11:00 AM to 11:59 AM | 48 (1.5%) | 131 (4.2%) |
| 12:00 PM to 3:59 PM | 164 (5.3%) | 207 (6.6%) |
| 4:00 PM to 11:59 PM | 124 (4.0%) | 125 (4.0%) |
| Total | 3,096 (100.0%) | 3,142 (100.0%) |
Housing Occupancy in Collingswood borough
Occupancy by Ownership in Collingswood borough
Of the total 6,698 dwellings in Collingswood borough, owner-occupied units account for 3,558 (53.1%), while renter-occupied units make up 3,140 (46.9%).
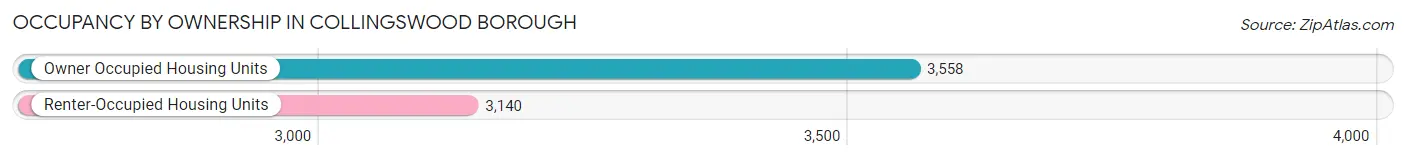
| Occupancy | # Housing Units | % Housing Units |
| Owner Occupied Housing Units | 3,558 | 53.1% |
| Renter-Occupied Housing Units | 3,140 | 46.9% |
| Total Occupied Housing Units | 6,698 | 100.0% |
Occupancy by Household Size in Collingswood borough
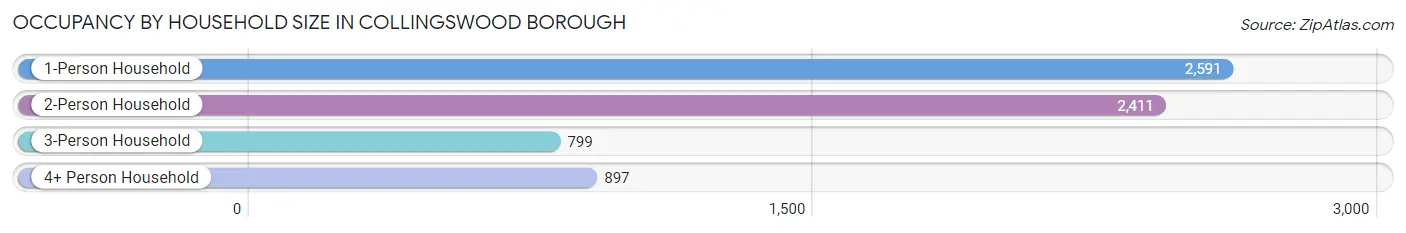
| Household Size | # Housing Units | % Housing Units |
| 1-Person Household | 2,591 | 38.7% |
| 2-Person Household | 2,411 | 36.0% |
| 3-Person Household | 799 | 11.9% |
| 4+ Person Household | 897 | 13.4% |
| Total Housing Units | 6,698 | 100.0% |
Occupancy by Ownership by Household Size in Collingswood borough
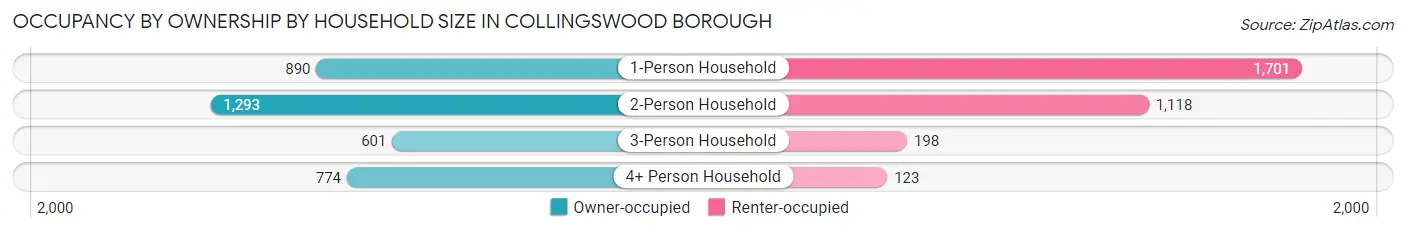
| Household Size | Owner-occupied | Renter-occupied |
| 1-Person Household | 890 (34.4%) | 1,701 (65.6%) |
| 2-Person Household | 1,293 (53.6%) | 1,118 (46.4%) |
| 3-Person Household | 601 (75.2%) | 198 (24.8%) |
| 4+ Person Household | 774 (86.3%) | 123 (13.7%) |
| Total Housing Units | 3,558 (53.1%) | 3,140 (46.9%) |
Occupancy by Educational Attainment in Collingswood borough
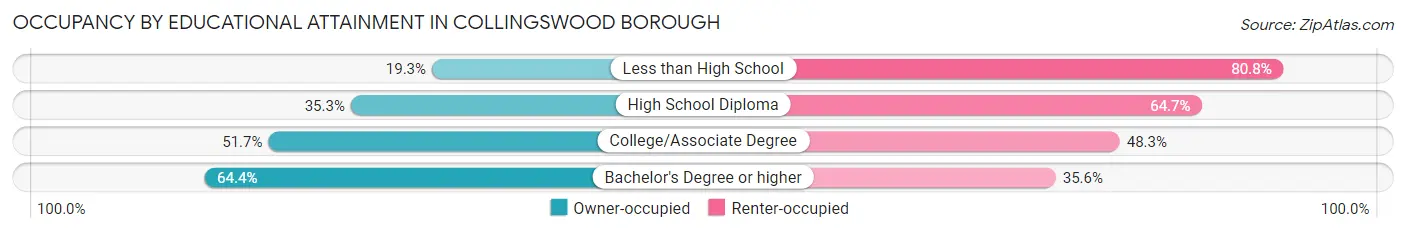
| Household Size | Owner-occupied | Renter-occupied |
| Less than High School | 67 (19.3%) | 281 (80.7%) |
| High School Diploma | 452 (35.3%) | 827 (64.7%) |
| College/Associate Degree | 920 (51.7%) | 860 (48.3%) |
| Bachelor's Degree or higher | 2,119 (64.4%) | 1,172 (35.6%) |
Occupancy by Age of Householder in Collingswood borough
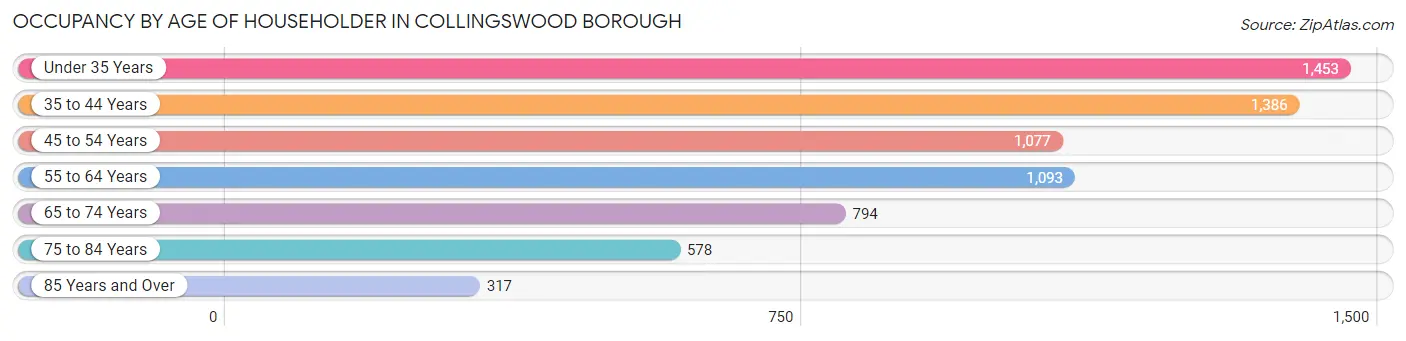
| Age Bracket | # Households | % Households |
| Under 35 Years | 1,453 | 21.7% |
| 35 to 44 Years | 1,386 | 20.7% |
| 45 to 54 Years | 1,077 | 16.1% |
| 55 to 64 Years | 1,093 | 16.3% |
| 65 to 74 Years | 794 | 11.8% |
| 75 to 84 Years | 578 | 8.6% |
| 85 Years and Over | 317 | 4.7% |
| Total | 6,698 | 100.0% |
Housing Finances in Collingswood borough
Median Income by Occupancy in Collingswood borough
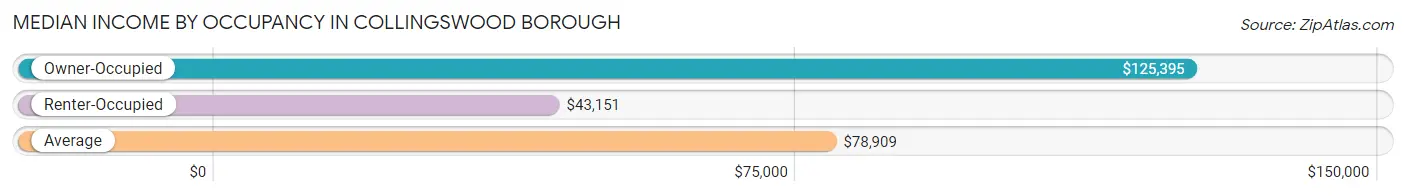
| Occupancy Type | # Households | Median Income |
| Owner-Occupied | 3,558 (53.1%) | $125,395 |
| Renter-Occupied | 3,140 (46.9%) | $43,151 |
| Average | 6,698 (100.0%) | $78,909 |
Occupancy by Householder Income Bracket in Collingswood borough
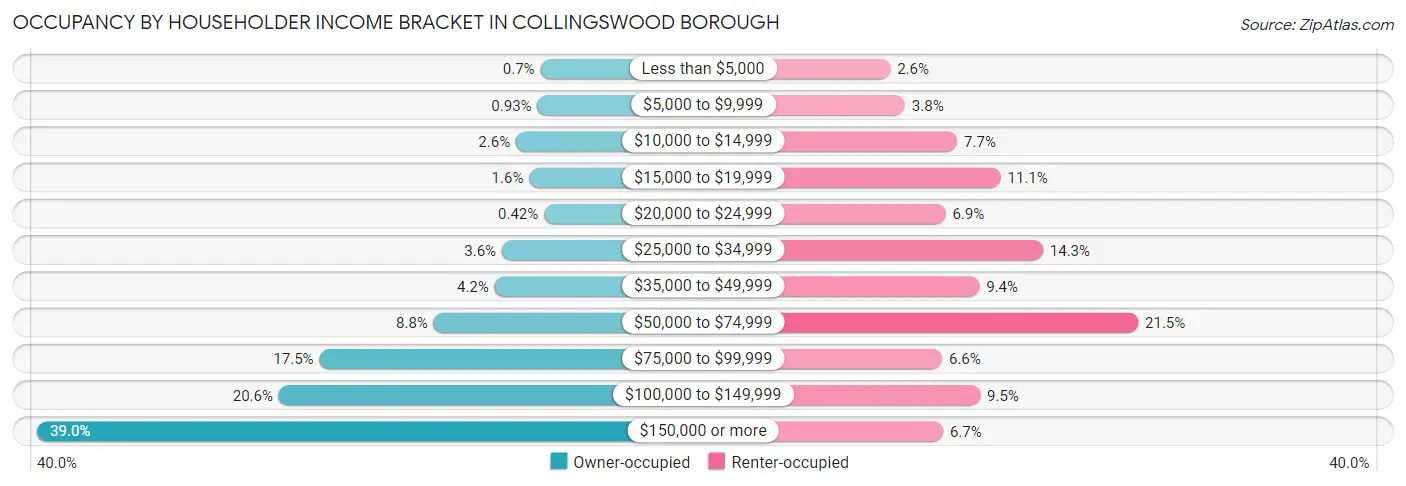
| Income Bracket | Owner-occupied | Renter-occupied |
| Less than $5,000 | 25 (0.7%) | 83 (2.6%) |
| $5,000 to $9,999 | 33 (0.9%) | 118 (3.8%) |
| $10,000 to $14,999 | 91 (2.6%) | 243 (7.7%) |
| $15,000 to $19,999 | 55 (1.5%) | 347 (11.1%) |
| $20,000 to $24,999 | 15 (0.4%) | 215 (6.9%) |
| $25,000 to $34,999 | 129 (3.6%) | 448 (14.3%) |
| $35,000 to $49,999 | 149 (4.2%) | 296 (9.4%) |
| $50,000 to $74,999 | 314 (8.8%) | 676 (21.5%) |
| $75,000 to $99,999 | 624 (17.5%) | 207 (6.6%) |
| $100,000 to $149,999 | 734 (20.6%) | 298 (9.5%) |
| $150,000 or more | 1,389 (39.0%) | 209 (6.7%) |
| Total | 3,558 (100.0%) | 3,140 (100.0%) |
Monthly Housing Cost Tiers in Collingswood borough
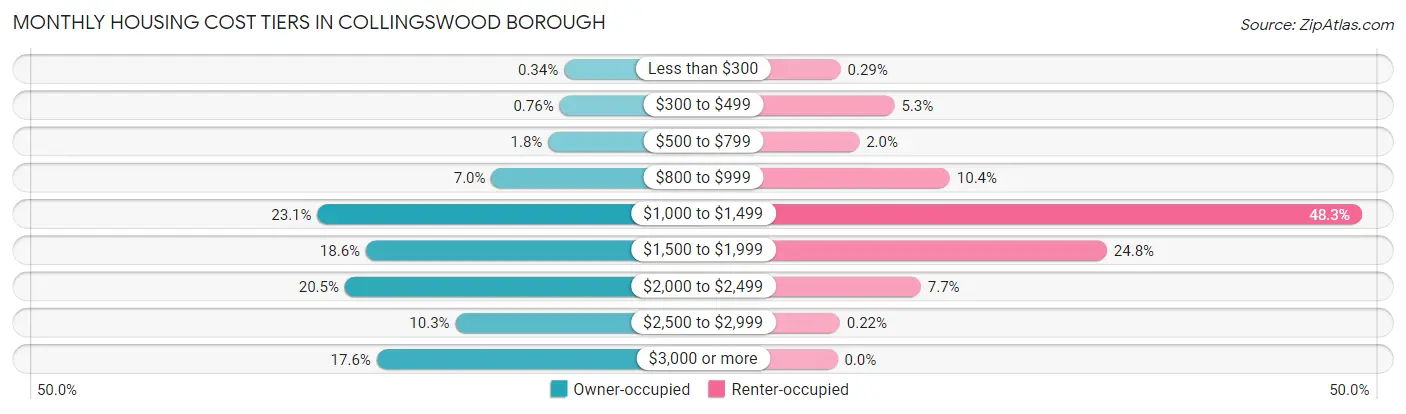
| Monthly Cost | Owner-occupied | Renter-occupied |
| Less than $300 | 12 (0.3%) | 9 (0.3%) |
| $300 to $499 | 27 (0.8%) | 165 (5.2%) |
| $500 to $799 | 64 (1.8%) | 63 (2.0%) |
| $800 to $999 | 250 (7.0%) | 325 (10.3%) |
| $1,000 to $1,499 | 820 (23.1%) | 1,515 (48.2%) |
| $1,500 to $1,999 | 661 (18.6%) | 779 (24.8%) |
| $2,000 to $2,499 | 730 (20.5%) | 241 (7.7%) |
| $2,500 to $2,999 | 368 (10.3%) | 7 (0.2%) |
| $3,000 or more | 626 (17.6%) | 0 (0.0%) |
| Total | 3,558 (100.0%) | 3,140 (100.0%) |
Physical Housing Characteristics in Collingswood borough
Housing Structures in Collingswood borough
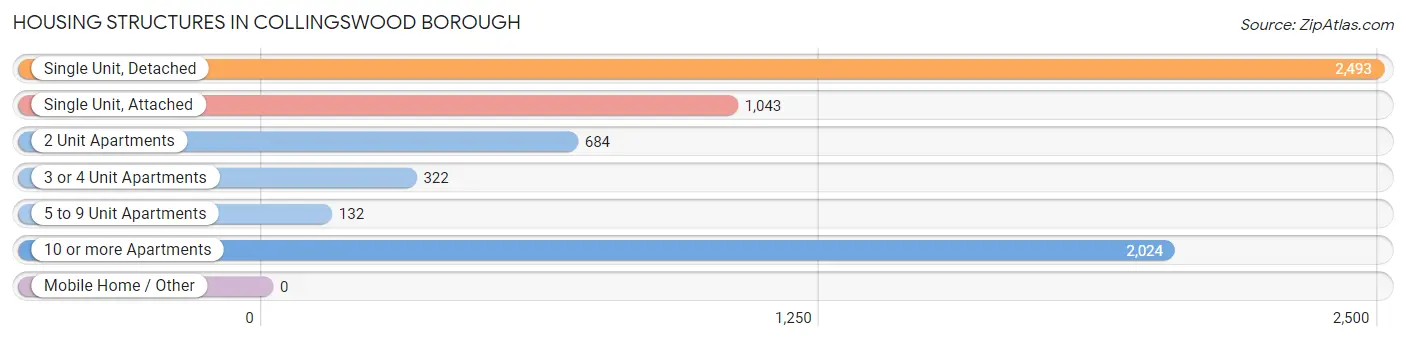
| Structure Type | # Housing Units | % Housing Units |
| Single Unit, Detached | 2,493 | 37.2% |
| Single Unit, Attached | 1,043 | 15.6% |
| 2 Unit Apartments | 684 | 10.2% |
| 3 or 4 Unit Apartments | 322 | 4.8% |
| 5 to 9 Unit Apartments | 132 | 2.0% |
| 10 or more Apartments | 2,024 | 30.2% |
| Mobile Home / Other | 0 | 0.0% |
| Total | 6,698 | 100.0% |
Housing Structures by Occupancy in Collingswood borough
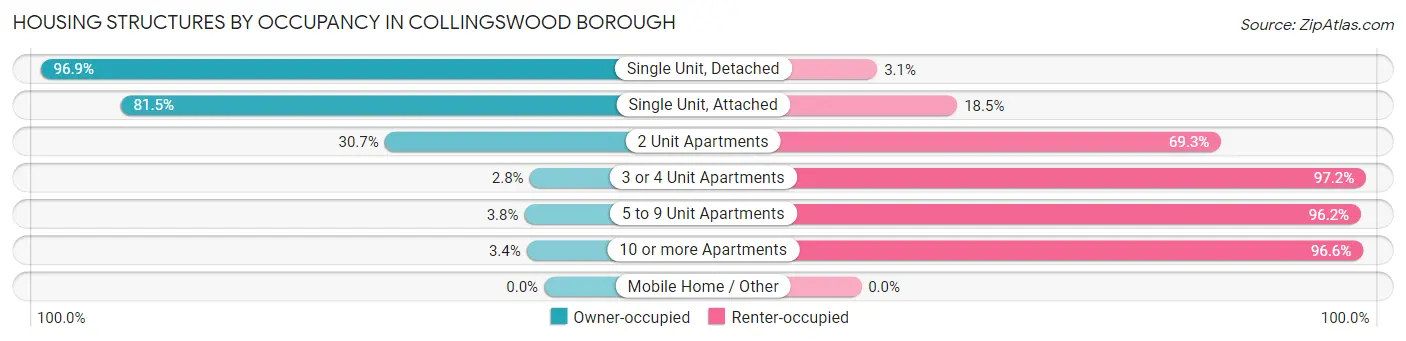
| Structure Type | Owner-occupied | Renter-occupied |
| Single Unit, Detached | 2,416 (96.9%) | 77 (3.1%) |
| Single Unit, Attached | 850 (81.5%) | 193 (18.5%) |
| 2 Unit Apartments | 210 (30.7%) | 474 (69.3%) |
| 3 or 4 Unit Apartments | 9 (2.8%) | 313 (97.2%) |
| 5 to 9 Unit Apartments | 5 (3.8%) | 127 (96.2%) |
| 10 or more Apartments | 68 (3.4%) | 1,956 (96.6%) |
| Mobile Home / Other | 0 (0.0%) | 0 (0.0%) |
| Total | 3,558 (53.1%) | 3,140 (46.9%) |
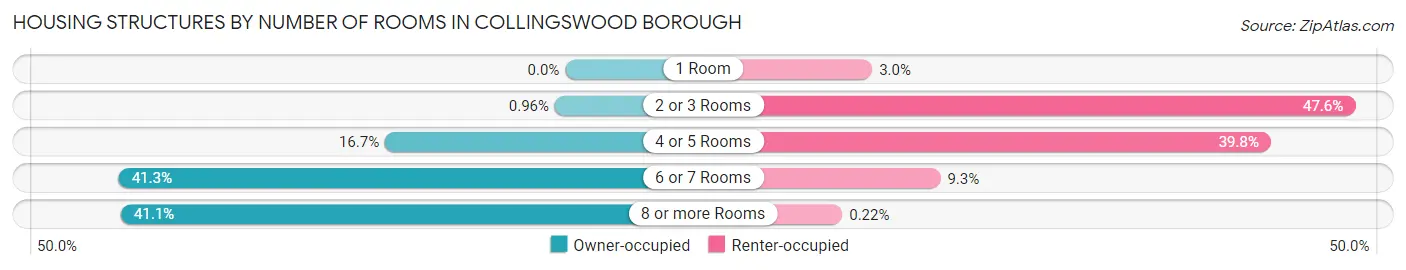
Housing Structures by Number of Rooms in Collingswood borough
| Number of Rooms | Owner-occupied | Renter-occupied |
| 1 Room | 0 (0.0%) | 94 (3.0%) |
| 2 or 3 Rooms | 34 (1.0%) | 1,496 (47.6%) |
| 4 or 5 Rooms | 593 (16.7%) | 1,251 (39.8%) |
| 6 or 7 Rooms | 1,469 (41.3%) | 292 (9.3%) |
| 8 or more Rooms | 1,462 (41.1%) | 7 (0.2%) |
| Total | 3,558 (100.0%) | 3,140 (100.0%) |
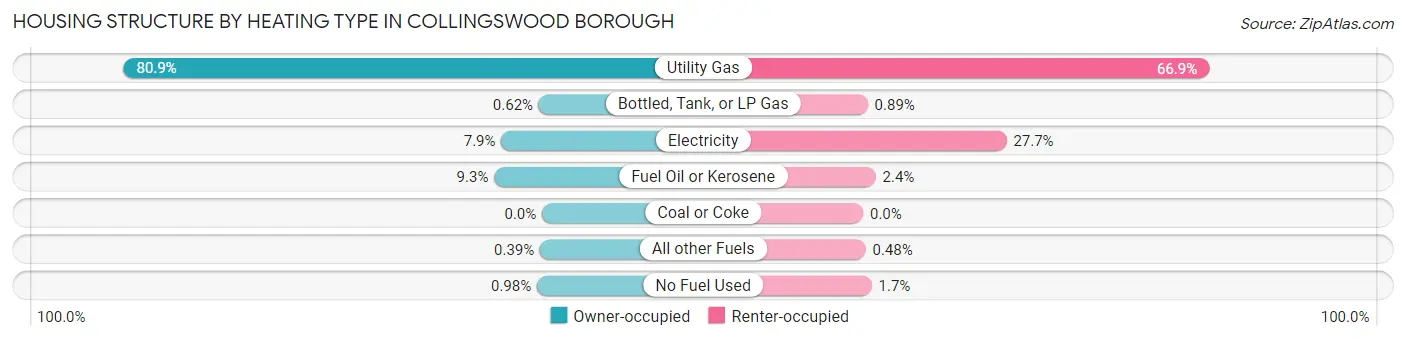
Housing Structure by Heating Type in Collingswood borough
| Heating Type | Owner-occupied | Renter-occupied |
| Utility Gas | 2,878 (80.9%) | 2,099 (66.8%) |
| Bottled, Tank, or LP Gas | 22 (0.6%) | 28 (0.9%) |
| Electricity | 280 (7.9%) | 870 (27.7%) |
| Fuel Oil or Kerosene | 329 (9.2%) | 76 (2.4%) |
| Coal or Coke | 0 (0.0%) | 0 (0.0%) |
| All other Fuels | 14 (0.4%) | 15 (0.5%) |
| No Fuel Used | 35 (1.0%) | 52 (1.7%) |
| Total | 3,558 (100.0%) | 3,140 (100.0%) |
Household Vehicle Usage in Collingswood borough
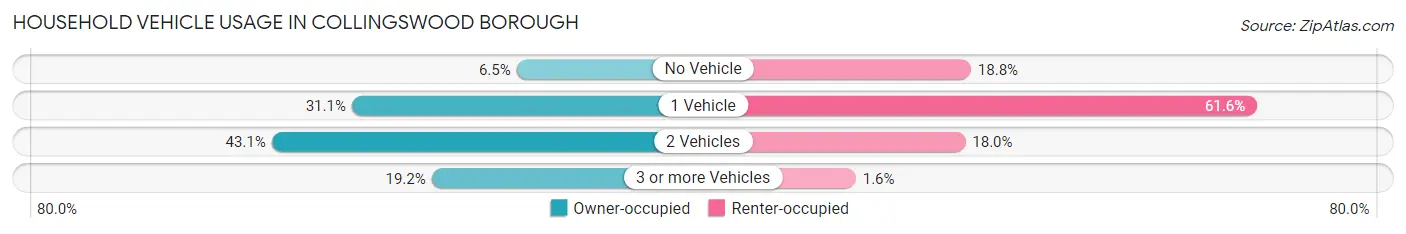
| Vehicles per Household | Owner-occupied | Renter-occupied |
| No Vehicle | 232 (6.5%) | 591 (18.8%) |
| 1 Vehicle | 1,108 (31.1%) | 1,933 (61.6%) |
| 2 Vehicles | 1,534 (43.1%) | 565 (18.0%) |
| 3 or more Vehicles | 684 (19.2%) | 51 (1.6%) |
| Total | 3,558 (100.0%) | 3,140 (100.0%) |
Real Estate & Mortgages in Collingswood borough
Real Estate and Mortgage Overview in Collingswood borough
| Characteristic | Without Mortgage | With Mortgage |
| Housing Units | 1,098 | 2,460 |
| Median Property Value | $305,600 | $315,700 |
| Median Household Income | $88,292 | $1,132 |
| Monthly Housing Costs | $1,201 | $626 |
| Real Estate Taxes | $9,308 | $33 |
Property Value by Mortgage Status in Collingswood borough
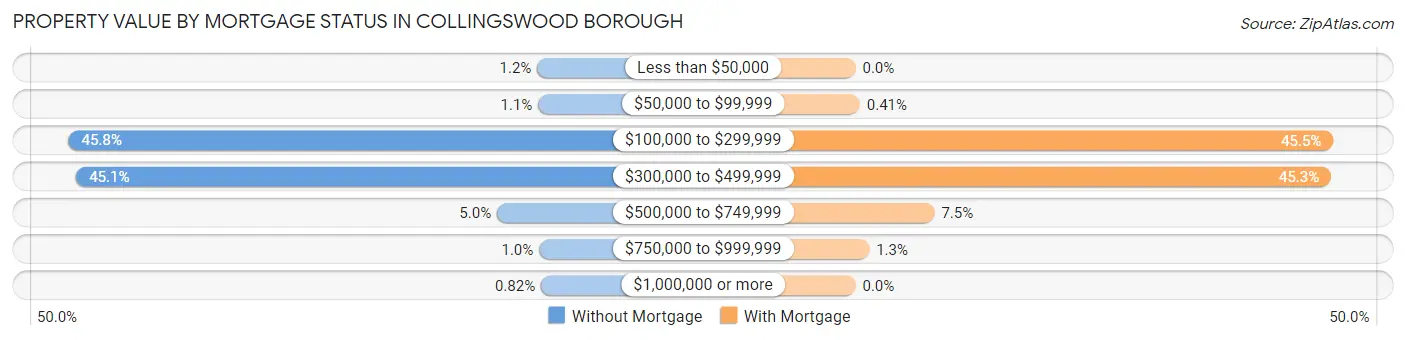
| Property Value | Without Mortgage | With Mortgage |
| Less than $50,000 | 13 (1.2%) | 0 (0.0%) |
| $50,000 to $99,999 | 12 (1.1%) | 10 (0.4%) |
| $100,000 to $299,999 | 503 (45.8%) | 1,119 (45.5%) |
| $300,000 to $499,999 | 495 (45.1%) | 1,114 (45.3%) |
| $500,000 to $749,999 | 55 (5.0%) | 185 (7.5%) |
| $750,000 to $999,999 | 11 (1.0%) | 32 (1.3%) |
| $1,000,000 or more | 9 (0.8%) | 0 (0.0%) |
| Total | 1,098 (100.0%) | 2,460 (100.0%) |
Household Income by Mortgage Status in Collingswood borough
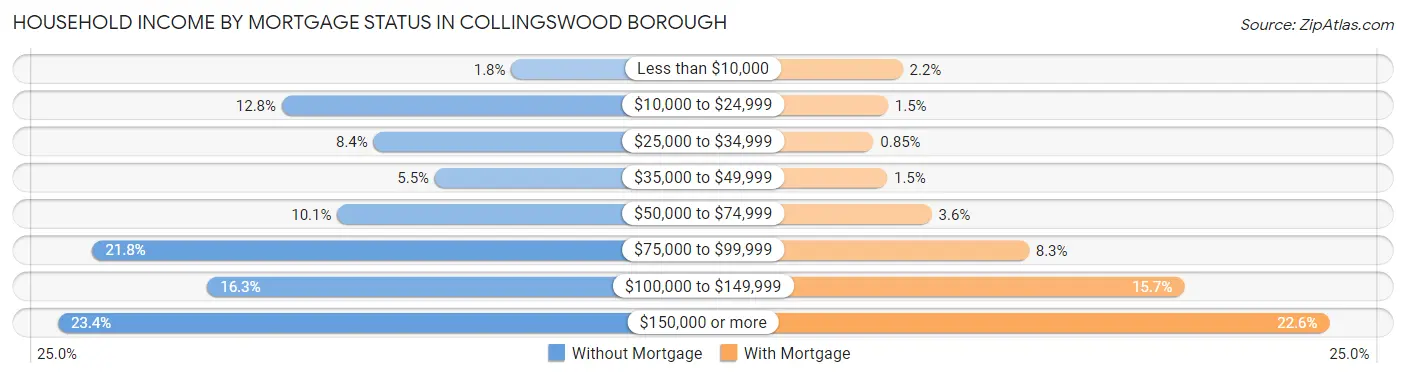
| Household Income | Without Mortgage | With Mortgage |
| Less than $10,000 | 20 (1.8%) | 55 (2.2%) |
| $10,000 to $24,999 | 140 (12.8%) | 38 (1.5%) |
| $25,000 to $34,999 | 92 (8.4%) | 21 (0.9%) |
| $35,000 to $49,999 | 60 (5.5%) | 37 (1.5%) |
| $50,000 to $74,999 | 111 (10.1%) | 89 (3.6%) |
| $75,000 to $99,999 | 239 (21.8%) | 203 (8.3%) |
| $100,000 to $149,999 | 179 (16.3%) | 385 (15.7%) |
| $150,000 or more | 257 (23.4%) | 555 (22.6%) |
| Total | 1,098 (100.0%) | 2,460 (100.0%) |
Property Value to Household Income Ratio in Collingswood borough
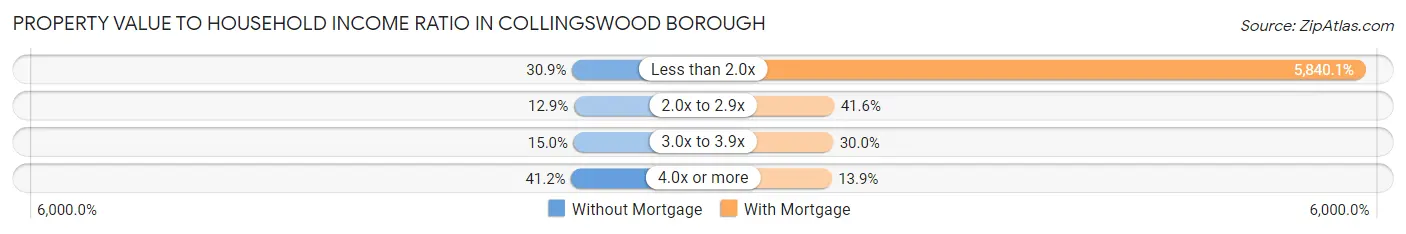
| Value-to-Income Ratio | Without Mortgage | With Mortgage |
| Less than 2.0x | 339 (30.9%) | 143,667 (5,840.1%) |
| 2.0x to 2.9x | 142 (12.9%) | 1,023 (41.6%) |
| 3.0x to 3.9x | 165 (15.0%) | 739 (30.0%) |
| 4.0x or more | 452 (41.2%) | 341 (13.9%) |
| Total | 1,098 (100.0%) | 2,460 (100.0%) |
Real Estate Taxes by Mortgage Status in Collingswood borough
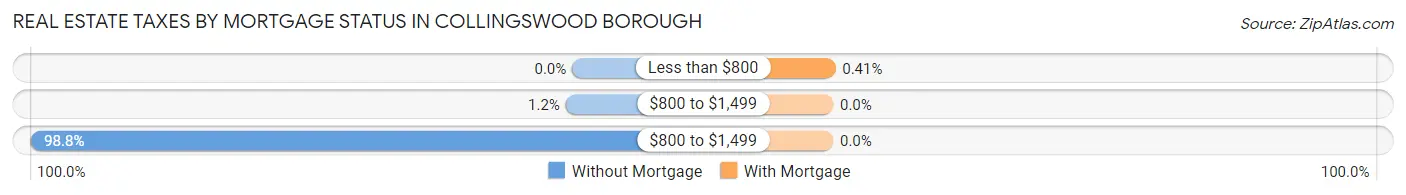
| Property Taxes | Without Mortgage | With Mortgage |
| Less than $800 | 0 (0.0%) | 10 (0.4%) |
| $800 to $1,499 | 13 (1.2%) | 0 (0.0%) |
| $800 to $1,499 | 1,085 (98.8%) | 0 (0.0%) |
| Total | 1,098 (100.0%) | 2,460 (100.0%) |
Health & Disability in Collingswood borough
Health Insurance Coverage by Age in Collingswood borough
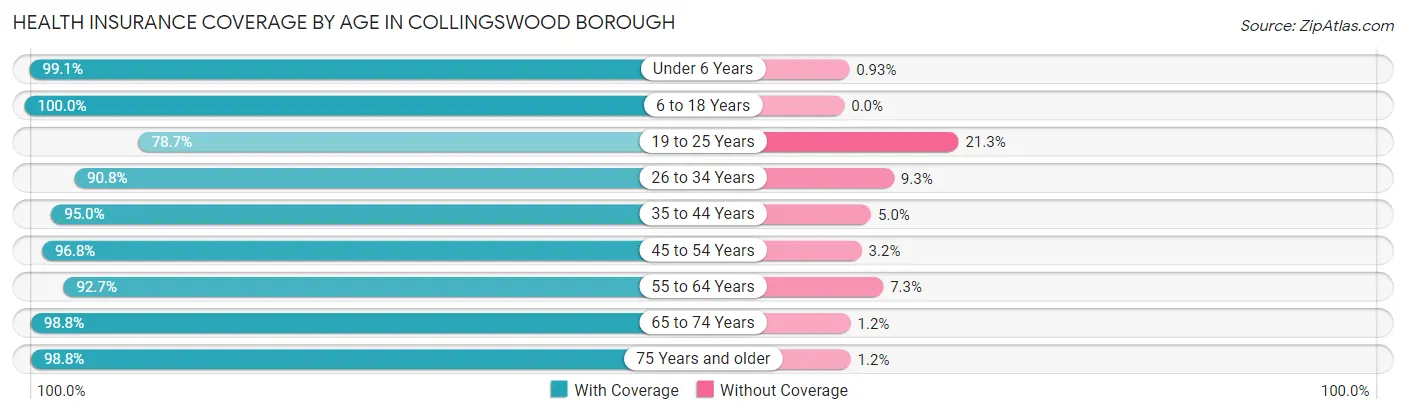
| Age Bracket | With Coverage | Without Coverage |
| Under 6 Years | 748 (99.1%) | 7 (0.9%) |
| 6 to 18 Years | 1,776 (100.0%) | 0 (0.0%) |
| 19 to 25 Years | 828 (78.7%) | 224 (21.3%) |
| 26 to 34 Years | 2,139 (90.7%) | 218 (9.2%) |
| 35 to 44 Years | 2,151 (95.0%) | 113 (5.0%) |
| 45 to 54 Years | 1,730 (96.8%) | 58 (3.2%) |
| 55 to 64 Years | 1,661 (92.7%) | 130 (7.3%) |
| 65 to 74 Years | 1,179 (98.8%) | 14 (1.2%) |
| 75 Years and older | 1,081 (98.8%) | 13 (1.2%) |
| Total | 13,293 (94.5%) | 777 (5.5%) |
Health Insurance Coverage by Citizenship Status in Collingswood borough
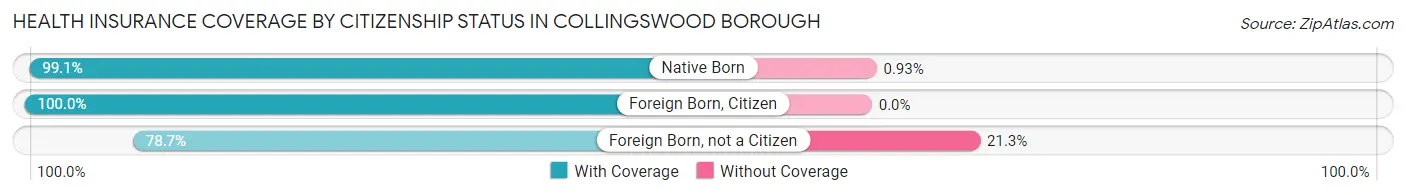
| Citizenship Status | With Coverage | Without Coverage |
| Native Born | 748 (99.1%) | 7 (0.9%) |
| Foreign Born, Citizen | 1,776 (100.0%) | 0 (0.0%) |
| Foreign Born, not a Citizen | 828 (78.7%) | 224 (21.3%) |
Health Insurance Coverage by Household Income in Collingswood borough
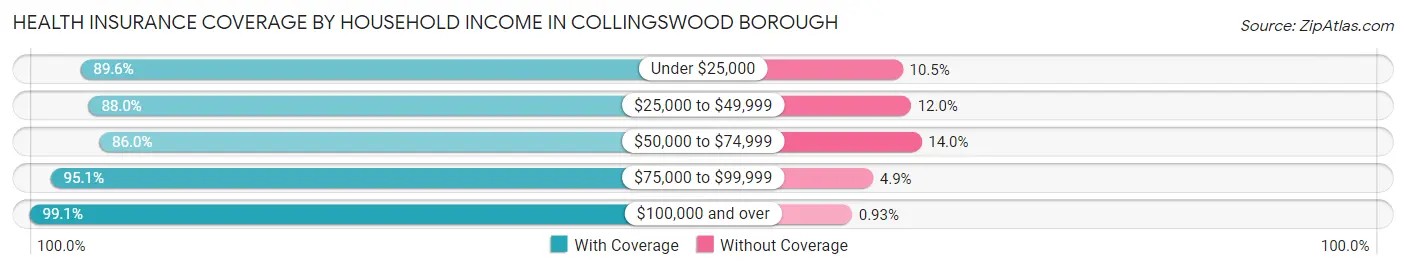
| Household Income | With Coverage | Without Coverage |
| Under $25,000 | 1,662 (89.5%) | 194 (10.4%) |
| $25,000 to $49,999 | 1,228 (88.0%) | 167 (12.0%) |
| $50,000 to $74,999 | 1,633 (86.0%) | 265 (14.0%) |
| $75,000 to $99,999 | 1,617 (95.1%) | 83 (4.9%) |
| $100,000 and over | 7,144 (99.1%) | 67 (0.9%) |
Public vs Private Health Insurance Coverage by Age in Collingswood borough
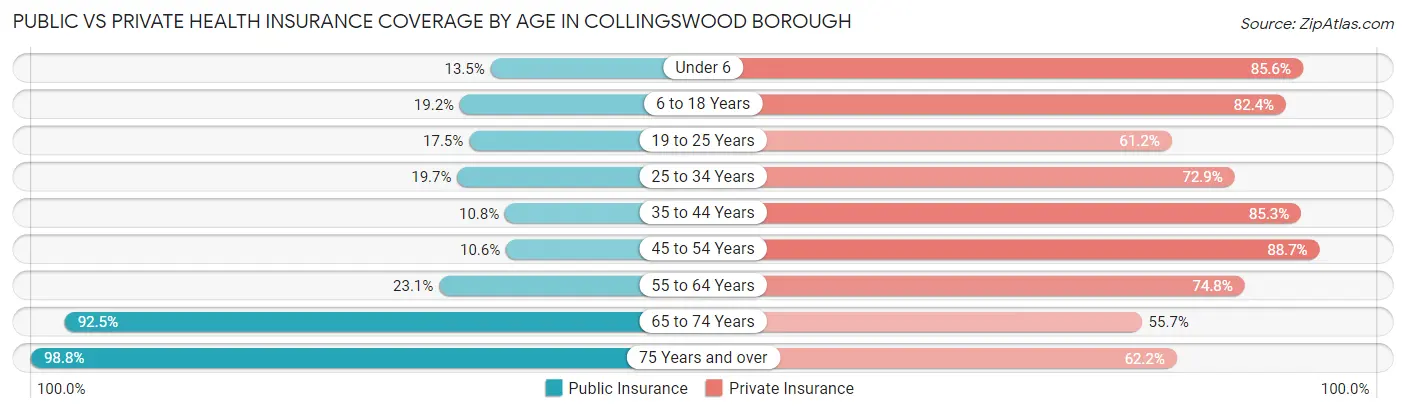
| Age Bracket | Public Insurance | Private Insurance |
| Under 6 | 102 (13.5%) | 646 (85.6%) |
| 6 to 18 Years | 341 (19.2%) | 1,464 (82.4%) |
| 19 to 25 Years | 184 (17.5%) | 644 (61.2%) |
| 25 to 34 Years | 464 (19.7%) | 1,718 (72.9%) |
| 35 to 44 Years | 245 (10.8%) | 1,930 (85.3%) |
| 45 to 54 Years | 190 (10.6%) | 1,585 (88.6%) |
| 55 to 64 Years | 413 (23.1%) | 1,339 (74.8%) |
| 65 to 74 Years | 1,104 (92.5%) | 664 (55.7%) |
| 75 Years and over | 1,081 (98.8%) | 680 (62.2%) |
| Total | 4,124 (29.3%) | 10,670 (75.8%) |
Disability Status by Sex by Age in Collingswood borough
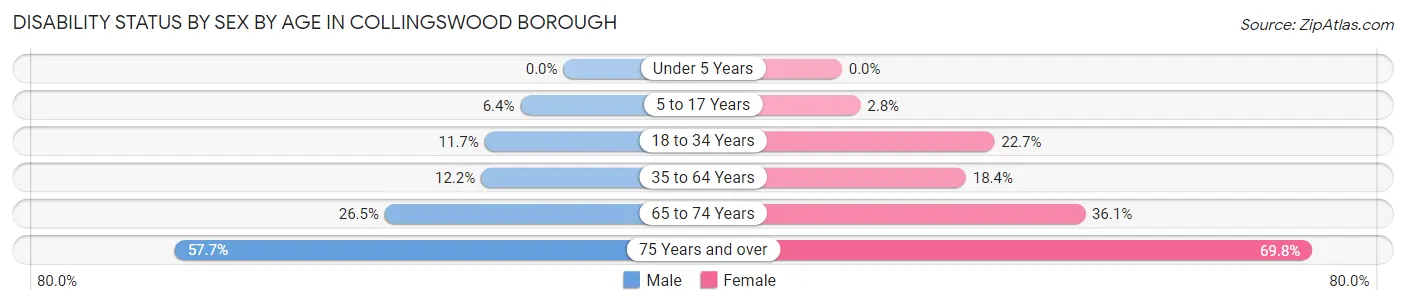
| Age Bracket | Male | Female |
| Under 5 Years | 0 (0.0%) | 0 (0.0%) |
| 5 to 17 Years | 69 (6.4%) | 21 (2.8%) |
| 18 to 34 Years | 199 (11.7%) | 402 (22.7%) |
| 35 to 64 Years | 347 (12.2%) | 553 (18.4%) |
| 65 to 74 Years | 154 (26.5%) | 221 (36.1%) |
| 75 Years and over | 176 (57.7%) | 551 (69.8%) |
Disability Class by Sex by Age in Collingswood borough
Disability Class: Hearing Difficulty
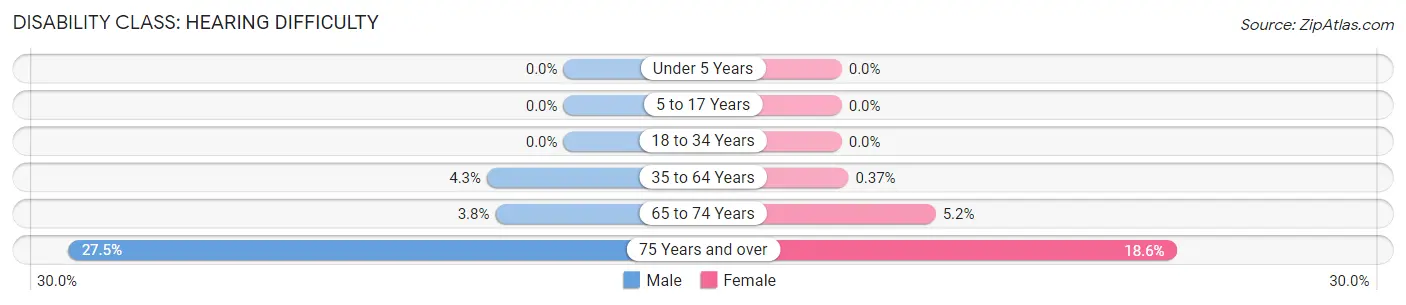
| Age Bracket | Male | Female |
| Under 5 Years | 0 (0.0%) | 0 (0.0%) |
| 5 to 17 Years | 0 (0.0%) | 0 (0.0%) |
| 18 to 34 Years | 0 (0.0%) | 0 (0.0%) |
| 35 to 64 Years | 121 (4.3%) | 11 (0.4%) |
| 65 to 74 Years | 22 (3.8%) | 32 (5.2%) |
| 75 Years and over | 84 (27.5%) | 147 (18.6%) |
Disability Class: Vision Difficulty
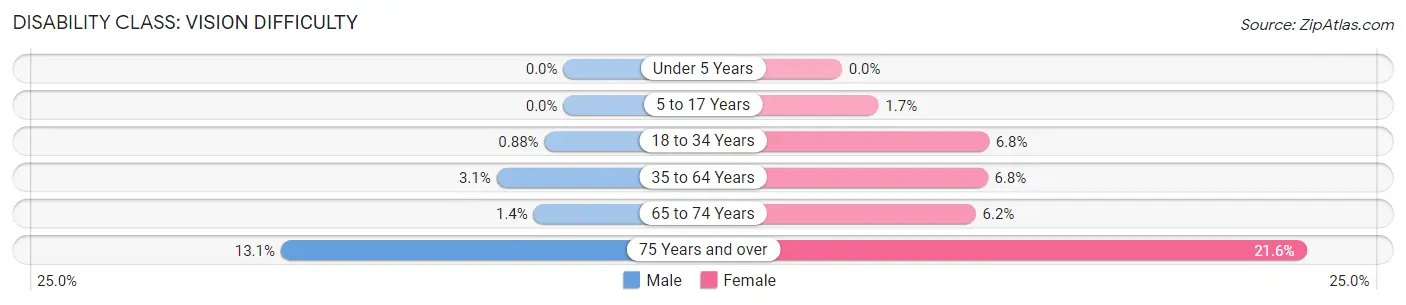
| Age Bracket | Male | Female |
| Under 5 Years | 0 (0.0%) | 0 (0.0%) |
| 5 to 17 Years | 0 (0.0%) | 13 (1.7%) |
| 18 to 34 Years | 15 (0.9%) | 121 (6.8%) |
| 35 to 64 Years | 88 (3.1%) | 203 (6.8%) |
| 65 to 74 Years | 8 (1.4%) | 38 (6.2%) |
| 75 Years and over | 40 (13.1%) | 170 (21.5%) |
Disability Class: Cognitive Difficulty
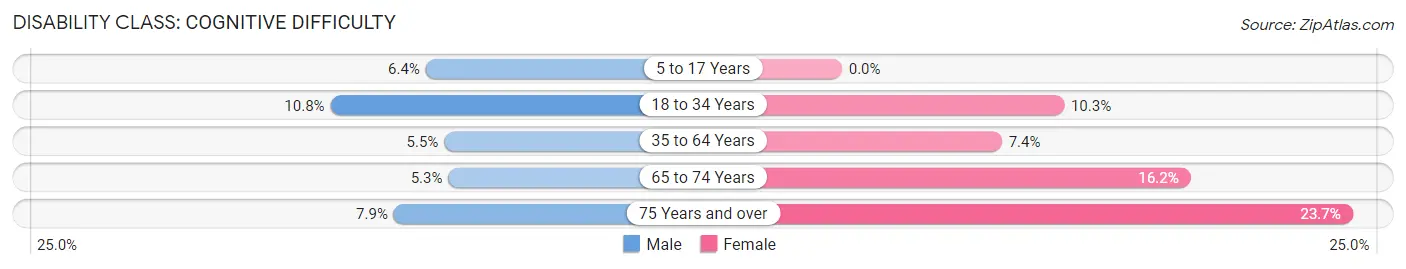
| Age Bracket | Male | Female |
| 5 to 17 Years | 69 (6.4%) | 0 (0.0%) |
| 18 to 34 Years | 184 (10.8%) | 183 (10.3%) |
| 35 to 64 Years | 157 (5.5%) | 223 (7.4%) |
| 65 to 74 Years | 31 (5.3%) | 99 (16.2%) |
| 75 Years and over | 24 (7.9%) | 187 (23.7%) |
Disability Class: Ambulatory Difficulty
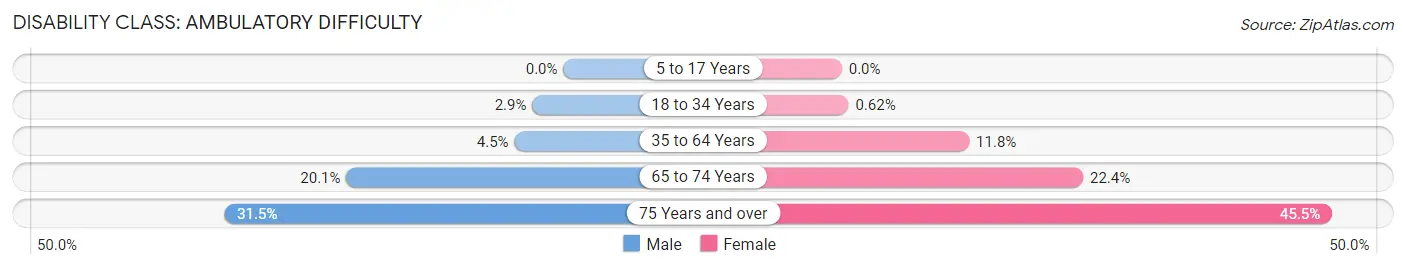
| Age Bracket | Male | Female |
| 5 to 17 Years | 0 (0.0%) | 0 (0.0%) |
| 18 to 34 Years | 49 (2.9%) | 11 (0.6%) |
| 35 to 64 Years | 129 (4.5%) | 355 (11.8%) |
| 65 to 74 Years | 117 (20.1%) | 137 (22.4%) |
| 75 Years and over | 96 (31.5%) | 359 (45.5%) |
Disability Class: Self-Care Difficulty
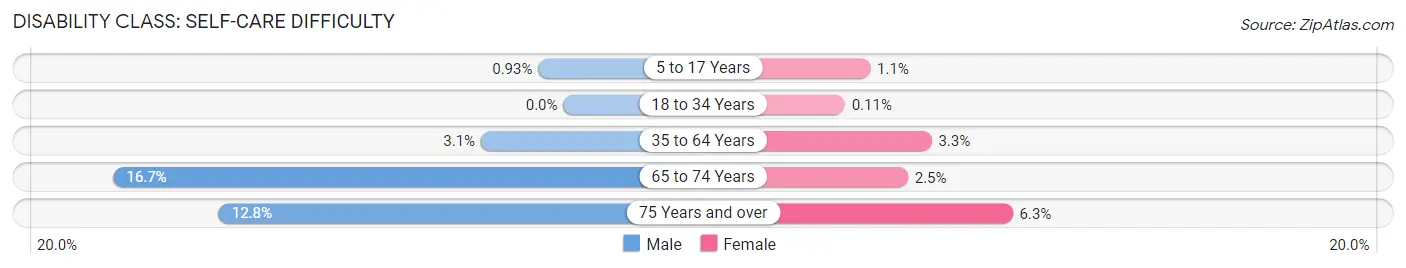
| Age Bracket | Male | Female |
| 5 to 17 Years | 10 (0.9%) | 8 (1.1%) |
| 18 to 34 Years | 0 (0.0%) | 2 (0.1%) |
| 35 to 64 Years | 87 (3.1%) | 100 (3.3%) |
| 65 to 74 Years | 97 (16.7%) | 15 (2.5%) |
| 75 Years and over | 39 (12.8%) | 50 (6.3%) |
Technology Access in Collingswood borough
Computing Device Access in Collingswood borough
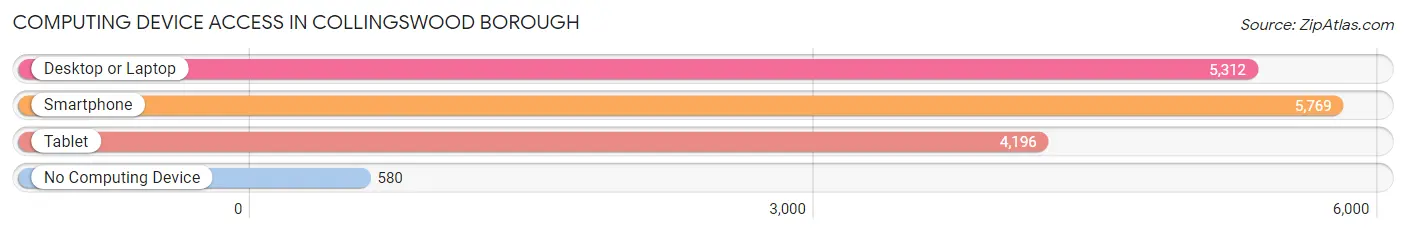
| Device Type | # Households | % Households |
| Desktop or Laptop | 5,312 | 79.3% |
| Smartphone | 5,769 | 86.1% |
| Tablet | 4,196 | 62.6% |
| No Computing Device | 580 | 8.7% |
| Total | 6,698 | 100.0% |
Internet Access in Collingswood borough
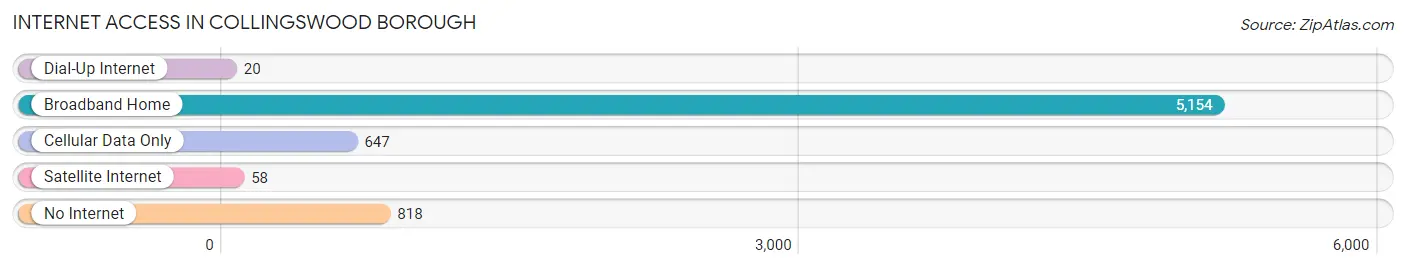
| Internet Type | # Households | % Households |
| Dial-Up Internet | 20 | 0.3% |
| Broadband Home | 5,154 | 76.9% |
| Cellular Data Only | 647 | 9.7% |
| Satellite Internet | 58 | 0.9% |
| No Internet | 818 | 12.2% |
| Total | 6,698 | 100.0% |
Collingswood borough Summary
Collingswood Borough is a small town located in Camden County, New Jersey. It is situated on the east side of the Cooper River, just south of the city of Camden. The town has a population of approximately 8,000 people and covers an area of 1.7 square miles.
History
The area that is now Collingswood was originally inhabited by the Lenni Lenape Native Americans. The first European settlers arrived in the area in the late 1600s and early 1700s. The town was originally known as “Newton Township” and was part of Gloucester County. In 1871, the town was incorporated as the Borough of Collingswood. The name was chosen in honor of the Collings family, who were prominent landowners in the area.
The town grew rapidly in the late 19th and early 20th centuries, becoming a popular summer resort destination for wealthy Philadelphians. The town was known for its grand Victorian homes and its many parks and recreational areas. In the 1920s, the town was home to a thriving amusement park, which was eventually closed in the 1950s.
Geography
Collingswood is located in the Delaware Valley region of New Jersey. It is situated on the east side of the Cooper River, just south of the city of Camden. The town is bordered by Haddon Township to the north, Haddonfield to the east, Oaklyn to the south, and Pennsauken Township to the west. The town is located approximately 8 miles from Philadelphia and is easily accessible by car or public transportation.
The town is mostly flat, with an elevation of approximately 20 feet above sea level. The town is located in a temperate climate zone, with hot summers and cold winters. The average annual temperature is around 55 degrees Fahrenheit.
Economy
Collingswood is a primarily residential community, with a small but vibrant business district. The town is home to a variety of small businesses, including restaurants, retail stores, and professional services. The town is also home to a number of corporate offices, including a regional office of the Bank of America.
The town is also home to a number of industrial and manufacturing businesses. The town is home to a large printing plant, as well as a number of food processing and packaging companies. The town is also home to a number of warehouses and distribution centers.
Demographics
As of the 2010 census, the population of Collingswood was 8,079. The racial makeup of the town was 79.3% White, 11.3% African American, 0.3% Native American, 4.2% Asian, and 4.9% from other races. The median household income was $62,917, and the median family income was $76,917.
The town is home to a diverse population, with a variety of ethnic and religious backgrounds. The town is home to a large Italian-American population, as well as a significant Jewish population. The town is also home to a large number of immigrants from Latin America and Asia.
Conclusion
Collingswood is a small town located in Camden County, New Jersey. It is situated on the east side of the Cooper River, just south of the city of Camden. The town has a population of approximately 8,000 people and covers an area of 1.7 square miles. The town has a rich history, with a variety of cultural and economic influences. The town is primarily residential, with a small but vibrant business district. The town is home to a diverse population, with a variety of ethnic and religious backgrounds.
Common Questions
What is Per Capita Income in Collingswood borough?
Per Capita income in Collingswood borough is $54,456.
What is the Median Family Income in Collingswood borough?
Median Family Income in Collingswood borough is $121,544.
What is the Median Household income in Collingswood borough?
Median Household Income in Collingswood borough is $78,909.
What is Income or Wage Gap in Collingswood borough?
Income or Wage Gap in Collingswood borough is 20.2%.
Women in Collingswood borough earn 79.8 cents for every dollar earned by a man.
What is Inequality or Gini Index in Collingswood borough?
Inequality or Gini Index in Collingswood borough is 0.50.
What is the Total Population of Collingswood borough?
Total Population of Collingswood borough is 14,135.
What is the Total Male Population of Collingswood borough?
Total Male Population of Collingswood borough is 6,874.
What is the Total Female Population of Collingswood borough?
Total Female Population of Collingswood borough is 7,261.
What is the Ratio of Males per 100 Females in Collingswood borough?
There are 94.67 Males per 100 Females in Collingswood borough.
What is the Ratio of Females per 100 Males in Collingswood borough?
There are 105.63 Females per 100 Males in Collingswood borough.
What is the Median Population Age in Collingswood borough?
Median Population Age in Collingswood borough is 39.8 Years.
What is the Average Family Size in Collingswood borough
Average Family Size in Collingswood borough is 2.9 People.
What is the Average Household Size in Collingswood borough
Average Household Size in Collingswood borough is 2.1 People.
How Large is the Labor Force in Collingswood borough?
There are 8,630 People in the Labor Forcein in Collingswood borough.
What is the Percentage of People in the Labor Force in Collingswood borough?
71.6% of People are in the Labor Force in Collingswood borough.
What is the Unemployment Rate in Collingswood borough?
Unemployment Rate in Collingswood borough is 8.1%.