Wanaque borough, NJ Map & Demographics
Wanaque borough Overview
$47,518
PER CAPITA INCOME
$124,239
AVG FAMILY INCOME
$108,650
AVG HOUSEHOLD INCOME
15.3%
WAGE / INCOME GAP [ % ]
84.7¢/ $1
WAGE / INCOME GAP [ $ ]
$9,143
FAMILY INCOME DEFICIT
0.34
INEQUALITY / GINI INDEX
11,217
TOTAL POPULATION
5,861
MALE POPULATION
5,356
FEMALE POPULATION
109.43
MALES / 100 FEMALES
91.38
FEMALES / 100 MALES
47.3
MEDIAN AGE
3.1
AVG FAMILY SIZE
2.5
AVG HOUSEHOLD SIZE
6,307
LABOR FORCE [ PEOPLE ]
66.4%
PERCENT IN LABOR FORCE
4.2%
UNEMPLOYMENT RATE
Income in Wanaque borough
Income Overview in Wanaque borough
Per Capita Income in Wanaque borough is $47,518, while median incomes of families and households are $124,239 and $108,650 respectively.
| Characteristic | Number | Measure |
| Per Capita Income | 11,217 | $47,518 |
| Median Family Income | 2,686 | $124,239 |
| Mean Family Income | 2,686 | $135,953 |
| Median Household Income | 4,277 | $108,650 |
| Mean Household Income | 4,277 | $121,075 |
| Income Deficit | 2,686 | $9,143 |
| Wage / Income Gap (%) | 11,217 | 15.35% |
| Wage / Income Gap ($) | 11,217 | 84.65¢ per $1 |
| Gini / Inequality Index | 11,217 | 0.34 |
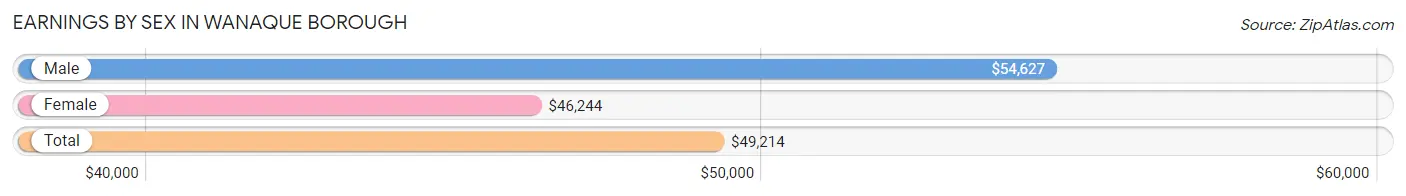
Earnings by Sex in Wanaque borough
Average Earnings in Wanaque borough are $49,214, $54,627 for men and $46,244 for women, a difference of 15.3%.
| Sex | Number | Average Earnings |
| Male | 3,644 (57.3%) | $54,627 |
| Female | 2,711 (42.7%) | $46,244 |
| Total | 6,355 (100.0%) | $49,214 |
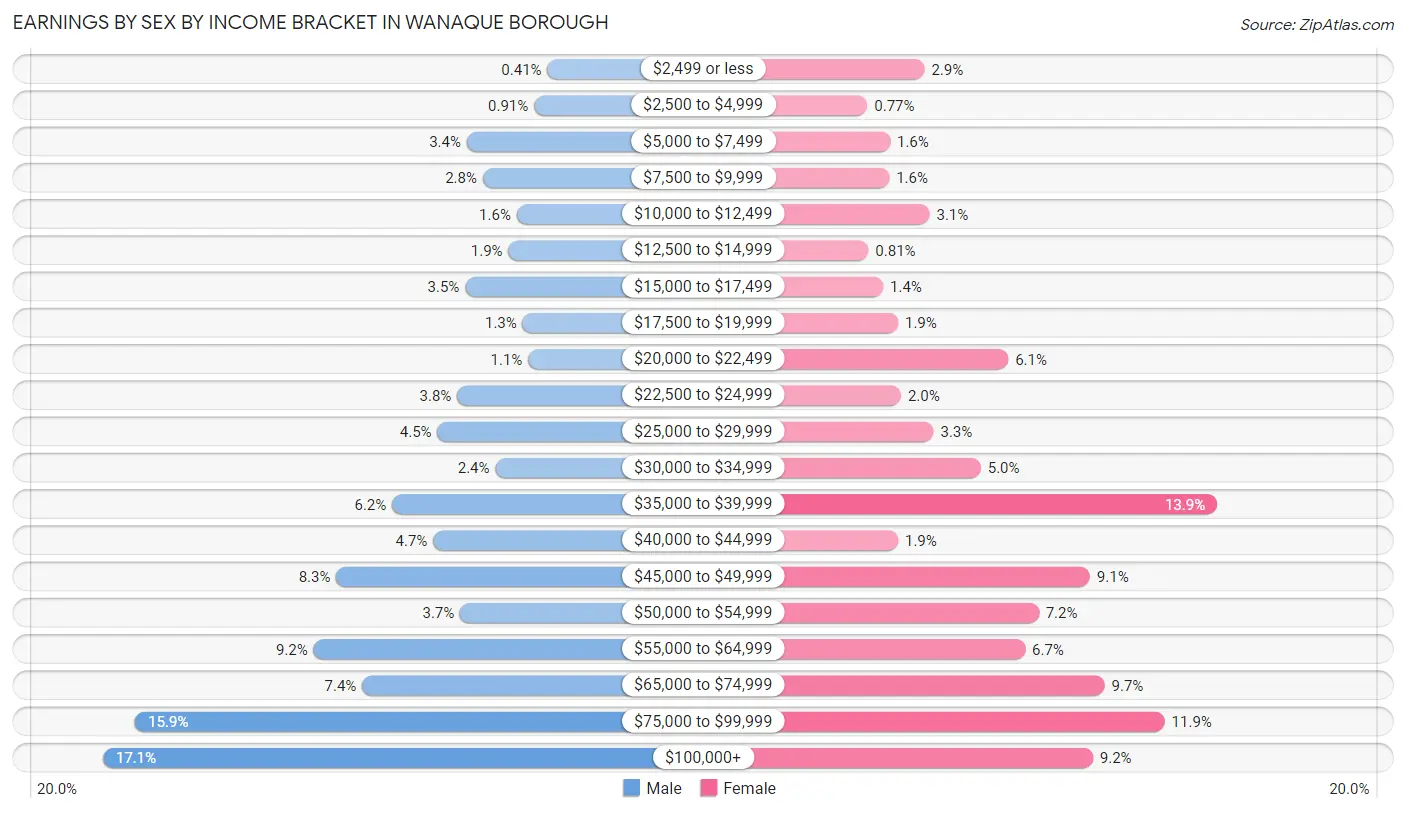
Earnings by Sex by Income Bracket in Wanaque borough
The most common earnings brackets in Wanaque borough are $100,000+ for men (622 | 17.1%) and $35,000 to $39,999 for women (376 | 13.9%).
| Income | Male | Female |
| $2,499 or less | 15 (0.4%) | 79 (2.9%) |
| $2,500 to $4,999 | 33 (0.9%) | 21 (0.8%) |
| $5,000 to $7,499 | 125 (3.4%) | 44 (1.6%) |
| $7,500 to $9,999 | 103 (2.8%) | 43 (1.6%) |
| $10,000 to $12,499 | 57 (1.6%) | 84 (3.1%) |
| $12,500 to $14,999 | 68 (1.9%) | 22 (0.8%) |
| $15,000 to $17,499 | 127 (3.5%) | 37 (1.4%) |
| $17,500 to $19,999 | 49 (1.3%) | 52 (1.9%) |
| $20,000 to $22,499 | 41 (1.1%) | 164 (6.0%) |
| $22,500 to $24,999 | 138 (3.8%) | 55 (2.0%) |
| $25,000 to $29,999 | 165 (4.5%) | 88 (3.3%) |
| $30,000 to $34,999 | 86 (2.4%) | 136 (5.0%) |
| $35,000 to $39,999 | 227 (6.2%) | 376 (13.9%) |
| $40,000 to $44,999 | 171 (4.7%) | 52 (1.9%) |
| $45,000 to $49,999 | 303 (8.3%) | 247 (9.1%) |
| $50,000 to $54,999 | 134 (3.7%) | 195 (7.2%) |
| $55,000 to $64,999 | 334 (9.2%) | 181 (6.7%) |
| $65,000 to $74,999 | 268 (7.3%) | 262 (9.7%) |
| $75,000 to $99,999 | 578 (15.9%) | 323 (11.9%) |
| $100,000+ | 622 (17.1%) | 250 (9.2%) |
| Total | 3,644 (100.0%) | 2,711 (100.0%) |
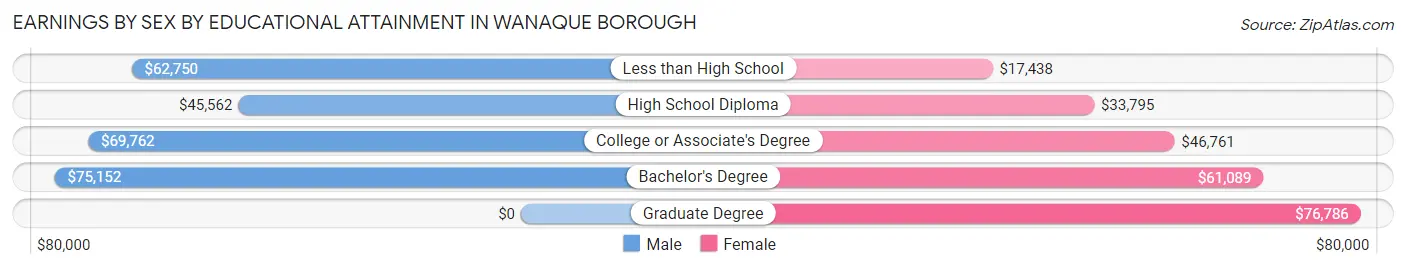
Earnings by Sex by Educational Attainment in Wanaque borough
Average earnings in Wanaque borough are $59,935 for men and $50,687 for women, a difference of 15.4%. Men with an educational attainment of bachelor's degree enjoy the highest average annual earnings of $75,152, while those with high school diploma education earn the least with $45,562. Women with an educational attainment of graduate degree earn the most with the average annual earnings of $76,786, while those with less than high school education have the smallest earnings of $17,438.
| Educational Attainment | Male Income | Female Income |
| Less than High School | $62,750 | $17,438 |
| High School Diploma | $45,562 | $33,795 |
| College or Associate's Degree | $69,762 | $46,761 |
| Bachelor's Degree | $75,152 | $61,089 |
| Graduate Degree | - | - |
| Total | $59,935 | $50,687 |
Family Income in Wanaque borough
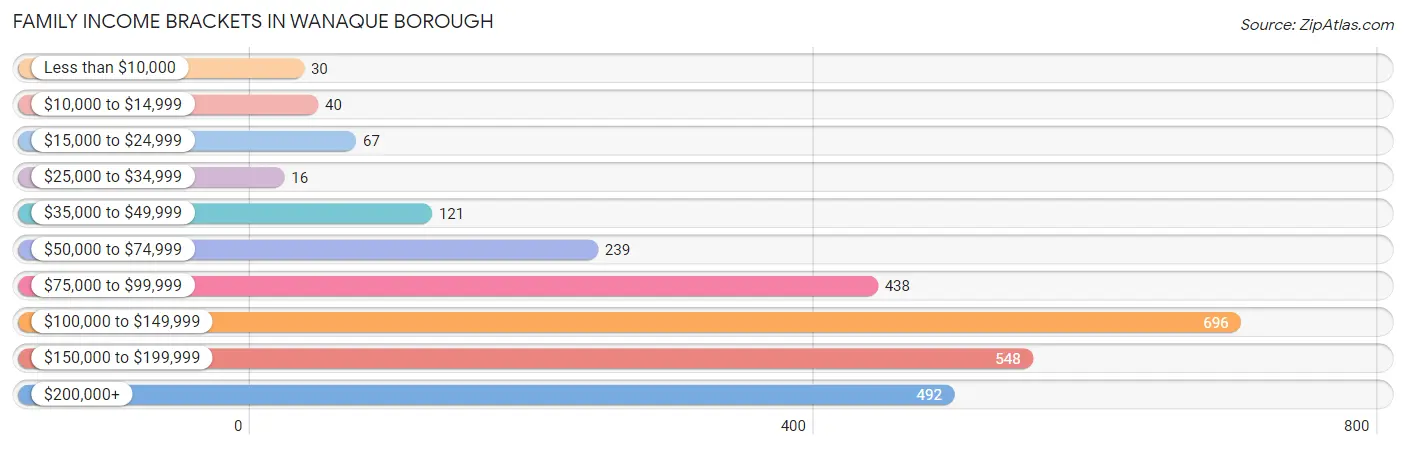
Family Income Brackets in Wanaque borough
According to the Wanaque borough family income data, there are 696 families falling into the $100,000 to $149,999 income range, which is the most common income bracket and makes up 25.9% of all families. Conversely, the $25,000 to $34,999 income bracket is the least frequent group with only 16 families (0.6%) belonging to this category.
| Income Bracket | # Families | % Families |
| Less than $10,000 | 30 | 1.1% |
| $10,000 to $14,999 | 40 | 1.5% |
| $15,000 to $24,999 | 67 | 2.5% |
| $25,000 to $34,999 | 16 | 0.6% |
| $35,000 to $49,999 | 121 | 4.5% |
| $50,000 to $74,999 | 239 | 8.9% |
| $75,000 to $99,999 | 438 | 16.3% |
| $100,000 to $149,999 | 696 | 25.9% |
| $150,000 to $199,999 | 548 | 20.4% |
| $200,000+ | 492 | 18.3% |
Family Income by Famaliy Size in Wanaque borough
6-person families (151 | 5.6%) account for the highest median family income in Wanaque borough with $202,753 per family, while 2-person families (1,218 | 45.4%) have the highest median income of $53,242 per family member.
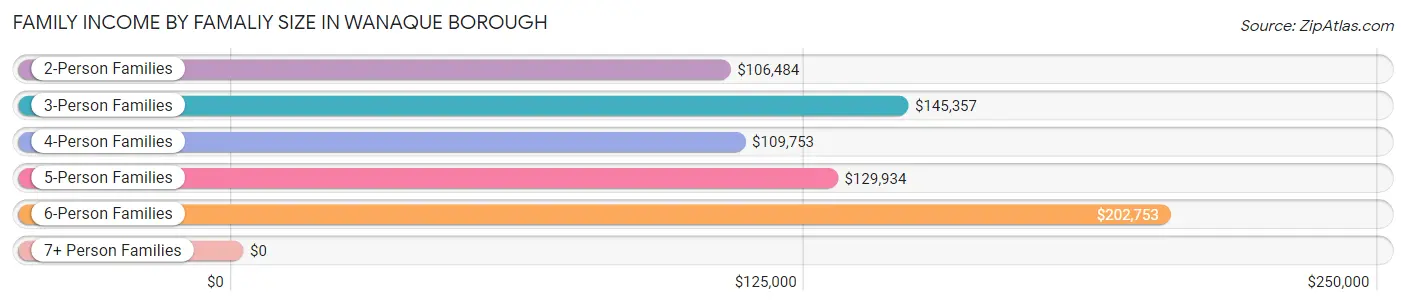
| Income Bracket | # Families | Median Income |
| 2-Person Families | 1,218 (45.4%) | $106,484 |
| 3-Person Families | 690 (25.7%) | $145,357 |
| 4-Person Families | 505 (18.8%) | $109,753 |
| 5-Person Families | 89 (3.3%) | $129,934 |
| 6-Person Families | 151 (5.6%) | $202,753 |
| 7+ Person Families | 33 (1.2%) | $0 |
| Total | 2,686 (100.0%) | $124,239 |
Family Income by Number of Earners in Wanaque borough
The median family income in Wanaque borough is $124,239, with families comprising 3+ earners (422) having the highest median family income of $202,619, while families with no earners (498) have the lowest median family income of $93,047, accounting for 15.7% and 18.5% of families, respectively.
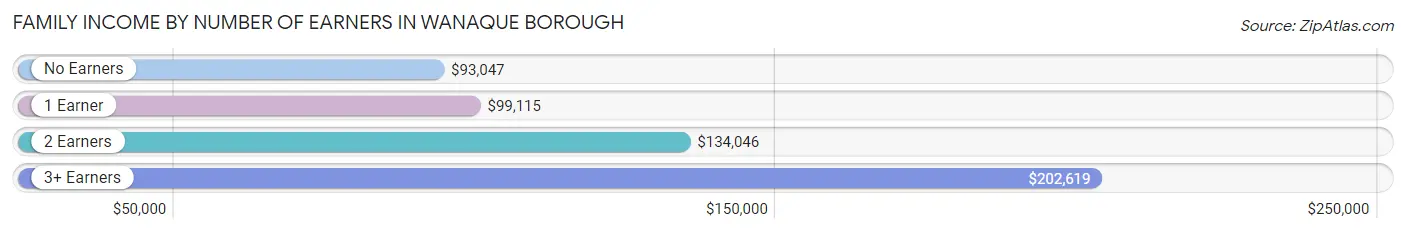
| Number of Earners | # Families | Median Income |
| No Earners | 498 (18.5%) | $93,047 |
| 1 Earner | 617 (23.0%) | $99,115 |
| 2 Earners | 1,149 (42.8%) | $134,046 |
| 3+ Earners | 422 (15.7%) | $202,619 |
| Total | 2,686 (100.0%) | $124,239 |
Household Income in Wanaque borough
Household Income Brackets in Wanaque borough
With 1,005 households falling in the category, the $100,000 to $149,999 income range is the most frequent in Wanaque borough, accounting for 23.5% of all households. In contrast, only 68 households (1.6%) fall into the $10,000 to $14,999 income bracket, making it the least populous group.
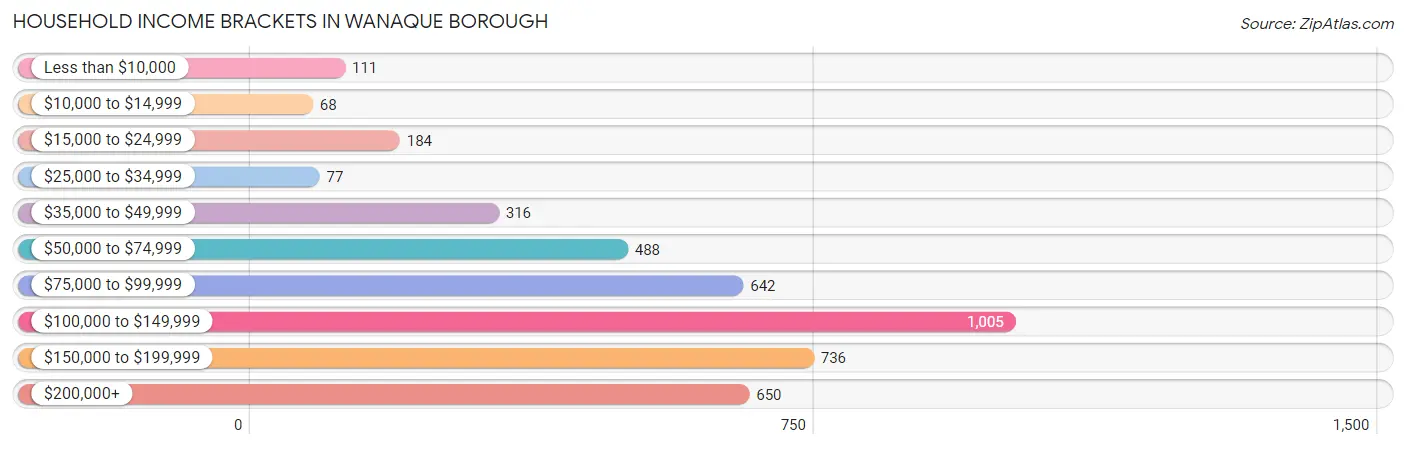
| Income Bracket | # Households | % Households |
| Less than $10,000 | 111 | 2.6% |
| $10,000 to $14,999 | 68 | 1.6% |
| $15,000 to $24,999 | 184 | 4.3% |
| $25,000 to $34,999 | 77 | 1.8% |
| $35,000 to $49,999 | 316 | 7.4% |
| $50,000 to $74,999 | 488 | 11.4% |
| $75,000 to $99,999 | 642 | 15.0% |
| $100,000 to $149,999 | 1,005 | 23.5% |
| $150,000 to $199,999 | 736 | 17.2% |
| $200,000+ | 650 | 15.2% |
Household Income by Householder Age in Wanaque borough
The median household income in Wanaque borough is $108,650, with the highest median household income of $115,238 found in the 25 to 44 years age bracket for the primary householder. A total of 1,130 households (26.4%) fall into this category. Meanwhile, the 15 to 24 years age bracket for the primary householder has the lowest median household income of $0, with 9 households (0.2%) in this group.
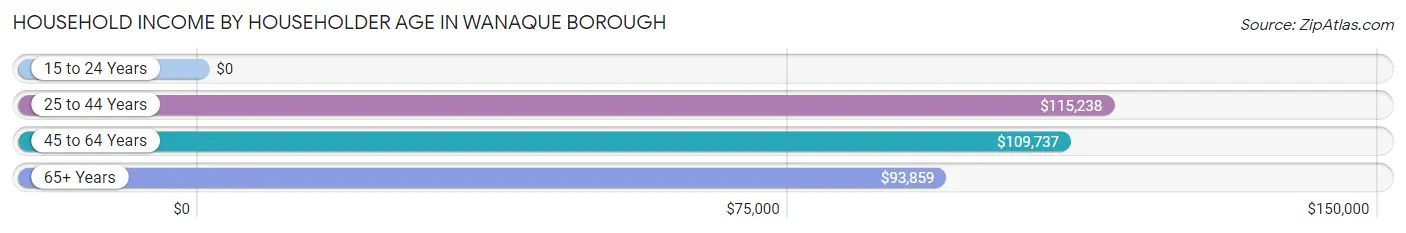
| Income Bracket | # Households | Median Income |
| 15 to 24 Years | 9 (0.2%) | $0 |
| 25 to 44 Years | 1,130 (26.4%) | $115,238 |
| 45 to 64 Years | 1,884 (44.1%) | $109,737 |
| 65+ Years | 1,254 (29.3%) | $93,859 |
| Total | 4,277 (100.0%) | $108,650 |
Poverty in Wanaque borough
Income Below Poverty by Sex and Age in Wanaque borough
With 6.2% poverty level for males and 6.5% for females among the residents of Wanaque borough, under 5 year old males and under 5 year old females are the most vulnerable to poverty, with 44 males (19.2%) and 27 females (11.5%) in their respective age groups living below the poverty level.
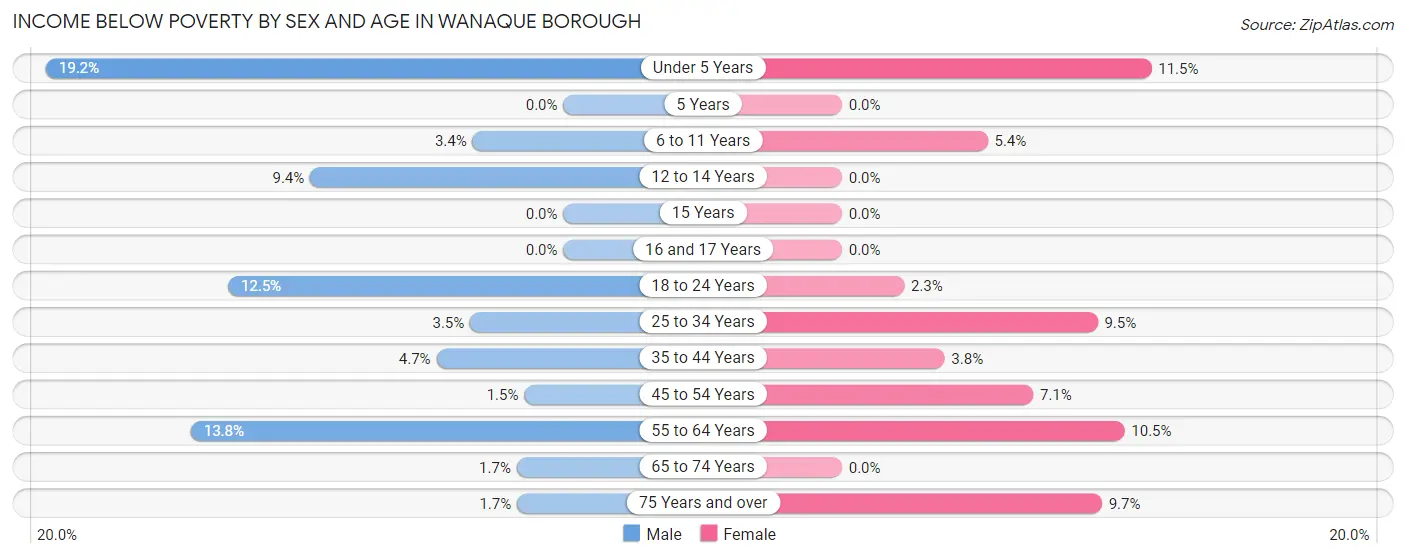
| Age Bracket | Male | Female |
| Under 5 Years | 44 (19.2%) | 27 (11.5%) |
| 5 Years | 0 (0.0%) | 0 (0.0%) |
| 6 to 11 Years | 12 (3.4%) | 12 (5.4%) |
| 12 to 14 Years | 30 (9.4%) | 0 (0.0%) |
| 15 Years | 0 (0.0%) | 0 (0.0%) |
| 16 and 17 Years | 0 (0.0%) | 0 (0.0%) |
| 18 to 24 Years | 63 (12.4%) | 10 (2.3%) |
| 25 to 34 Years | 38 (3.5%) | 58 (9.5%) |
| 35 to 44 Years | 23 (4.7%) | 16 (3.8%) |
| 45 to 54 Years | 11 (1.5%) | 66 (7.1%) |
| 55 to 64 Years | 121 (13.8%) | 81 (10.5%) |
| 65 to 74 Years | 9 (1.7%) | 0 (0.0%) |
| 75 Years and over | 8 (1.7%) | 64 (9.7%) |
| Total | 359 (6.2%) | 334 (6.5%) |
Income Above Poverty by Sex and Age in Wanaque borough
According to the poverty statistics in Wanaque borough, males aged 5 years and females aged 5 years are the age groups that are most secure financially, with 100.0% of males and 100.0% of females in these age groups living above the poverty line.
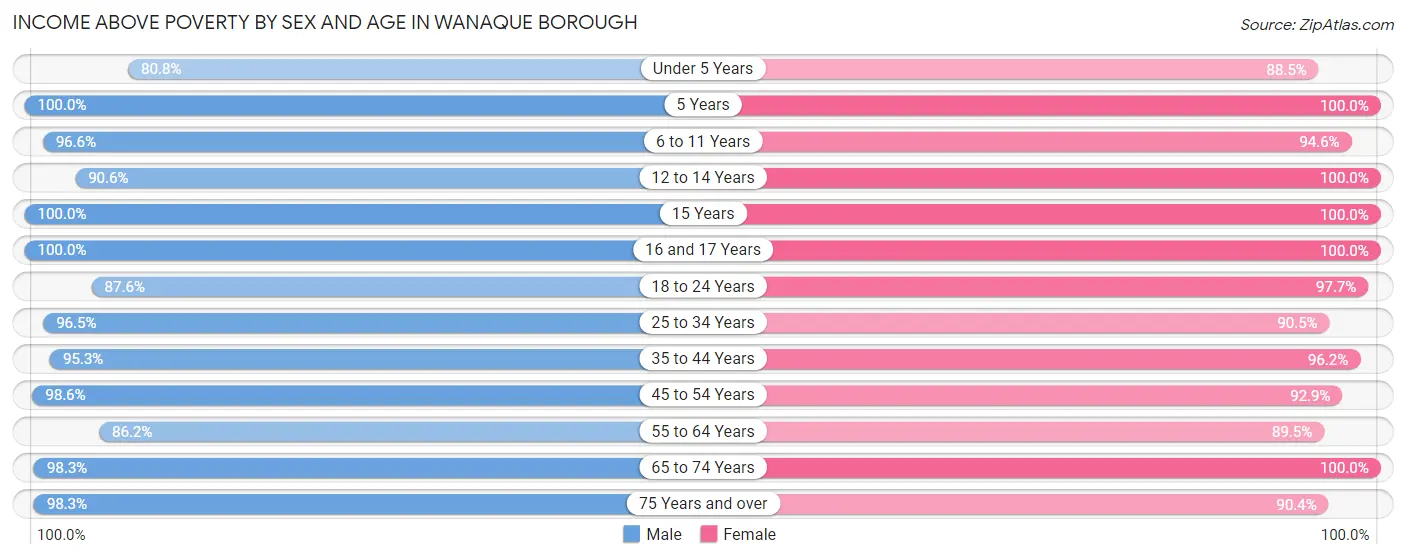
| Age Bracket | Male | Female |
| Under 5 Years | 185 (80.8%) | 208 (88.5%) |
| 5 Years | 98 (100.0%) | 99 (100.0%) |
| 6 to 11 Years | 344 (96.6%) | 210 (94.6%) |
| 12 to 14 Years | 289 (90.6%) | 113 (100.0%) |
| 15 Years | 30 (100.0%) | 17 (100.0%) |
| 16 and 17 Years | 19 (100.0%) | 79 (100.0%) |
| 18 to 24 Years | 443 (87.5%) | 422 (97.7%) |
| 25 to 34 Years | 1,061 (96.5%) | 553 (90.5%) |
| 35 to 44 Years | 465 (95.3%) | 404 (96.2%) |
| 45 to 54 Years | 746 (98.6%) | 864 (92.9%) |
| 55 to 64 Years | 754 (86.2%) | 691 (89.5%) |
| 65 to 74 Years | 511 (98.3%) | 577 (100.0%) |
| 75 Years and over | 456 (98.3%) | 599 (90.3%) |
| Total | 5,401 (93.8%) | 4,836 (93.5%) |
Income Below Poverty Among Married-Couple Families in Wanaque borough
The poverty statistics for married-couple families in Wanaque borough show that 2.4% or 51 of the total 2,129 families live below the poverty line. Families with 1 or 2 children have the highest poverty rate of 2.8%, comprising of 20 families. On the other hand, families with 3 or 4 children have the lowest poverty rate of 0.0%, which includes 0 families.
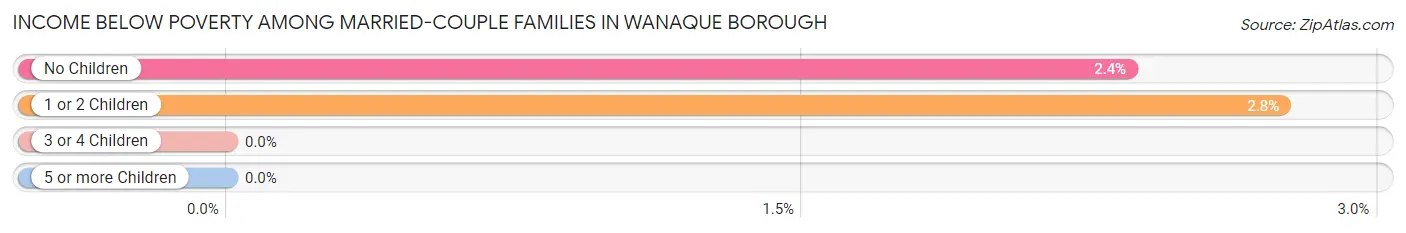
| Children | Above Poverty | Below Poverty |
| No Children | 1,287 (97.7%) | 31 (2.4%) |
| 1 or 2 Children | 706 (97.3%) | 20 (2.8%) |
| 3 or 4 Children | 85 (100.0%) | 0 (0.0%) |
| 5 or more Children | 0 (0.0%) | 0 (0.0%) |
| Total | 2,078 (97.6%) | 51 (2.4%) |
Income Below Poverty Among Single-Parent Households in Wanaque borough
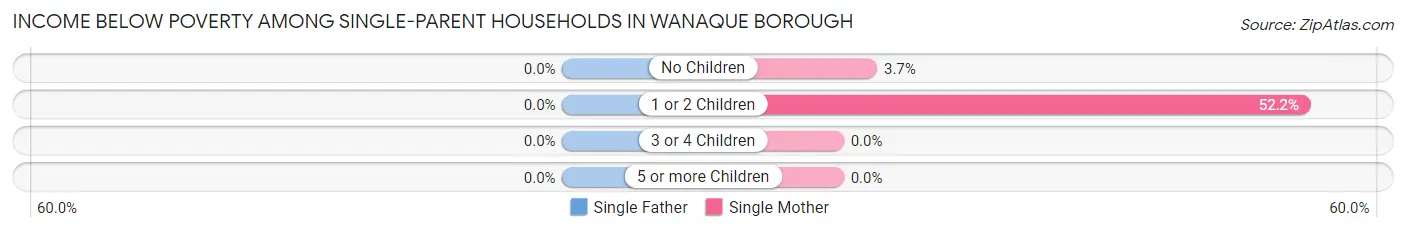
| Children | Single Father | Single Mother |
| No Children | 0 (0.0%) | 9 (3.7%) |
| 1 or 2 Children | 0 (0.0%) | 71 (52.2%) |
| 3 or 4 Children | 0 (0.0%) | 0 (0.0%) |
| 5 or more Children | 0 (0.0%) | 0 (0.0%) |
| Total | 0 (0.0%) | 80 (21.2%) |
Income Below Poverty Among Married-Couple vs Single-Parent Households in Wanaque borough
The poverty data for Wanaque borough shows that 51 of the married-couple family households (2.4%) and 80 of the single-parent households (14.4%) are living below the poverty level. Within the married-couple family households, those with 1 or 2 children have the highest poverty rate, with 20 households (2.8%) falling below the poverty line. Among the single-parent households, those with 1 or 2 children have the highest poverty rate, with 71 household (28.7%) living below poverty.
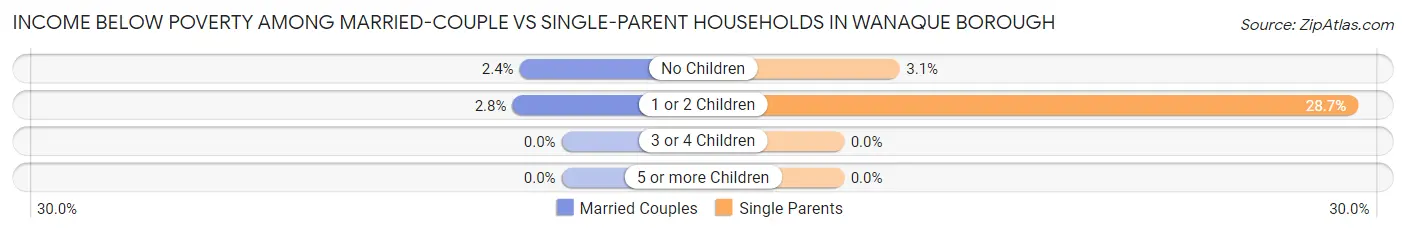
| Children | Married-Couple Families | Single-Parent Households |
| No Children | 31 (2.4%) | 9 (3.1%) |
| 1 or 2 Children | 20 (2.8%) | 71 (28.7%) |
| 3 or 4 Children | 0 (0.0%) | 0 (0.0%) |
| 5 or more Children | 0 (0.0%) | 0 (0.0%) |
| Total | 51 (2.4%) | 80 (14.4%) |
Race in Wanaque borough
The most populous races in Wanaque borough are White / Caucasian (9,159 | 81.7%), Hispanic or Latino (1,928 | 17.2%), and Two or more Races (911 | 8.1%).
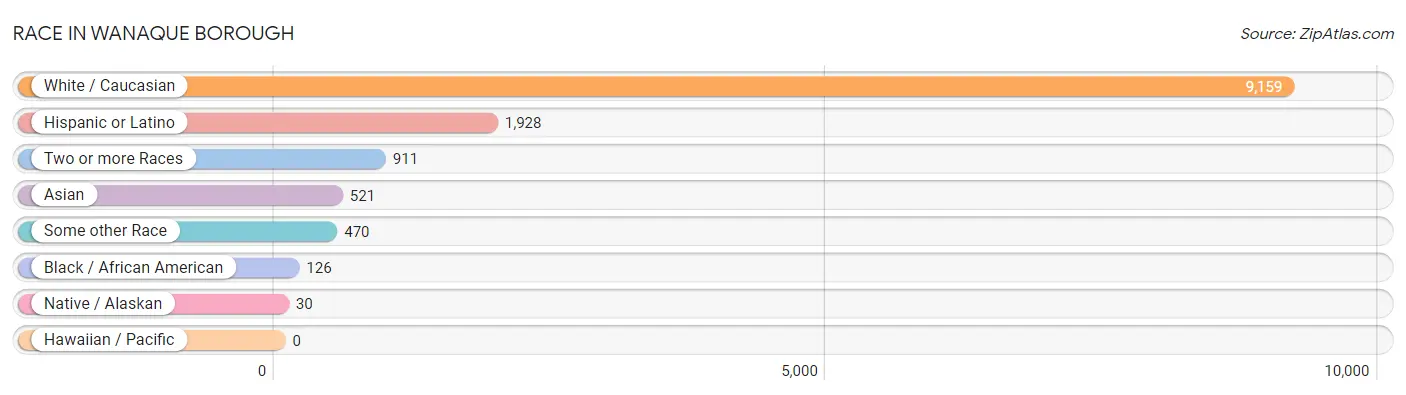
| Race | # Population | % Population |
| Asian | 521 | 4.6% |
| Black / African American | 126 | 1.1% |
| Hawaiian / Pacific | 0 | 0.0% |
| Hispanic or Latino | 1,928 | 17.2% |
| Native / Alaskan | 30 | 0.3% |
| White / Caucasian | 9,159 | 81.7% |
| Two or more Races | 911 | 8.1% |
| Some other Race | 470 | 4.2% |
| Total | 11,217 | 100.0% |
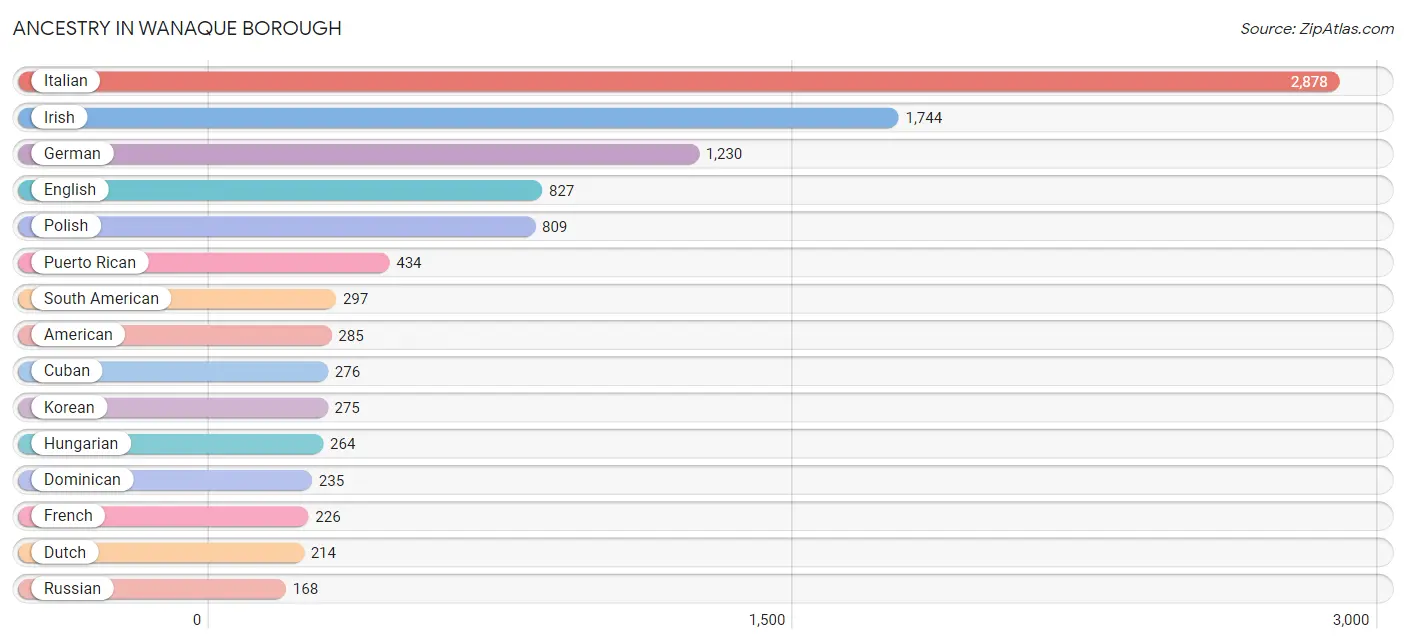
Ancestry in Wanaque borough
The most populous ancestries reported in Wanaque borough are Italian (2,878 | 25.7%), Irish (1,744 | 15.5%), German (1,230 | 11.0%), English (827 | 7.4%), and Polish (809 | 7.2%), together accounting for 66.8% of all Wanaque borough residents.
| Ancestry | # Population | % Population |
| Albanian | 43 | 0.4% |
| American | 285 | 2.5% |
| Arab | 14 | 0.1% |
| Austrian | 40 | 0.4% |
| Belgian | 40 | 0.4% |
| Brazilian | 13 | 0.1% |
| British | 10 | 0.1% |
| Bulgarian | 8 | 0.1% |
| Burmese | 21 | 0.2% |
| Central American | 126 | 1.1% |
| Chilean | 75 | 0.7% |
| Colombian | 55 | 0.5% |
| Cuban | 276 | 2.5% |
| Czech | 9 | 0.1% |
| Czechoslovakian | 63 | 0.6% |
| Danish | 13 | 0.1% |
| Delaware | 30 | 0.3% |
| Dominican | 235 | 2.1% |
| Dutch | 214 | 1.9% |
| Eastern European | 56 | 0.5% |
| Ecuadorian | 17 | 0.2% |
| English | 827 | 7.4% |
| European | 81 | 0.7% |
| French | 226 | 2.0% |
| German | 1,230 | 11.0% |
| Greek | 96 | 0.9% |
| Guatemalan | 126 | 1.1% |
| Hungarian | 264 | 2.4% |
| Indian (Asian) | 65 | 0.6% |
| Irish | 1,744 | 15.5% |
| Italian | 2,878 | 25.7% |
| Korean | 275 | 2.5% |
| Lebanese | 14 | 0.1% |
| Macedonian | 141 | 1.3% |
| Mexican | 71 | 0.6% |
| Norwegian | 64 | 0.6% |
| Peruvian | 150 | 1.3% |
| Polish | 809 | 7.2% |
| Puerto Rican | 434 | 3.9% |
| Romanian | 23 | 0.2% |
| Russian | 168 | 1.5% |
| Scandinavian | 15 | 0.1% |
| Scotch-Irish | 152 | 1.4% |
| Scottish | 64 | 0.6% |
| Serbian | 30 | 0.3% |
| Slovak | 40 | 0.4% |
| South American | 297 | 2.6% |
| Spaniard | 39 | 0.4% |
| Swedish | 36 | 0.3% |
| Swiss | 35 | 0.3% |
| Thai | 136 | 1.2% |
| Turkish | 46 | 0.4% |
| Ukrainian | 79 | 0.7% |
| Vietnamese | 24 | 0.2% |
| Welsh | 59 | 0.5% |
| West Indian | 12 | 0.1% | View All 56 Rows |
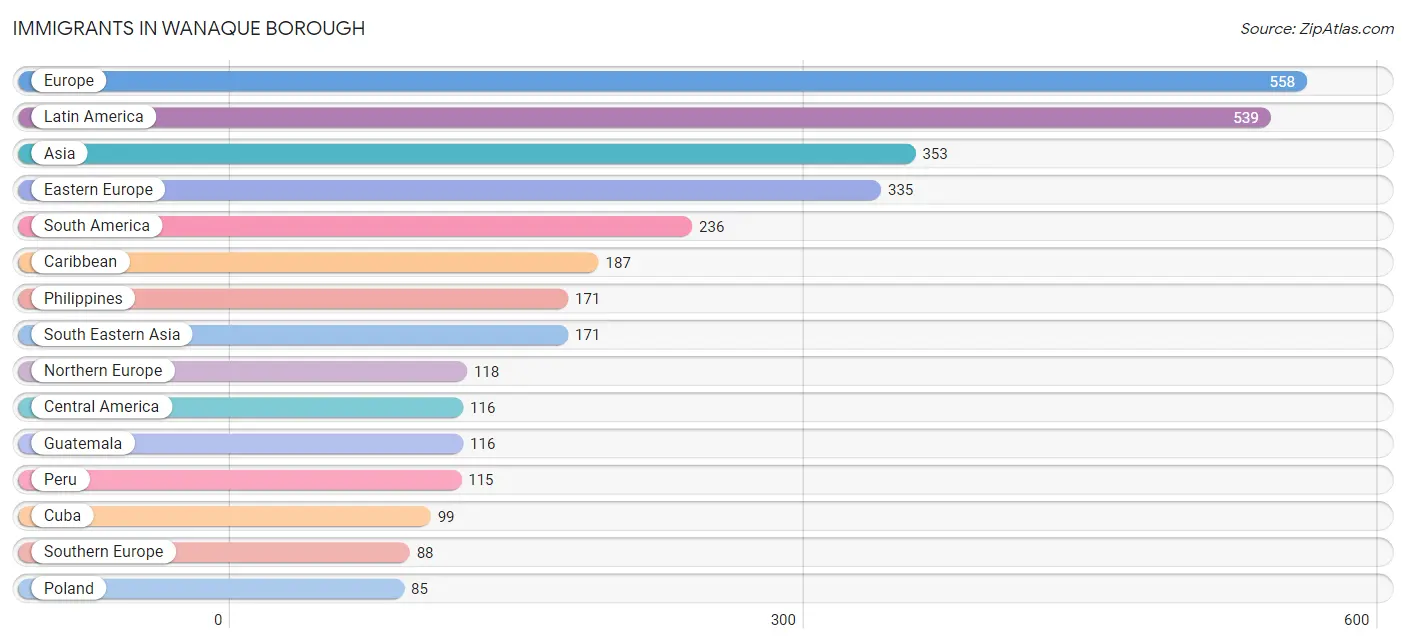
Immigrants in Wanaque borough
The most numerous immigrant groups reported in Wanaque borough came from Europe (558 | 5.0%), Latin America (539 | 4.8%), Asia (353 | 3.2%), Eastern Europe (335 | 3.0%), and South America (236 | 2.1%), together accounting for 18.0% of all Wanaque borough residents.
| Immigration Origin | # Population | % Population |
| Africa | 18 | 0.2% |
| Asia | 353 | 3.2% |
| Austria | 17 | 0.2% |
| Bangladesh | 12 | 0.1% |
| Brazil | 20 | 0.2% |
| Bulgaria | 8 | 0.1% |
| Canada | 6 | 0.1% |
| Caribbean | 187 | 1.7% |
| Central America | 116 | 1.0% |
| China | 65 | 0.6% |
| Colombia | 49 | 0.4% |
| Cuba | 99 | 0.9% |
| Dominican Republic | 76 | 0.7% |
| Eastern Asia | 75 | 0.7% |
| Eastern Europe | 335 | 3.0% |
| Ecuador | 52 | 0.5% |
| Egypt | 18 | 0.2% |
| England | 19 | 0.2% |
| Europe | 558 | 5.0% |
| Greece | 29 | 0.3% |
| Guatemala | 116 | 1.0% |
| Hungary | 19 | 0.2% |
| India | 24 | 0.2% |
| Ireland | 70 | 0.6% |
| Italy | 59 | 0.5% |
| Korea | 10 | 0.1% |
| Latin America | 539 | 4.8% |
| Lebanon | 28 | 0.3% |
| Moldova | 12 | 0.1% |
| North Macedonia | 73 | 0.6% |
| Northern Africa | 18 | 0.2% |
| Northern Europe | 118 | 1.1% |
| Peru | 115 | 1.0% |
| Philippines | 171 | 1.5% |
| Poland | 85 | 0.8% |
| Romania | 6 | 0.1% |
| Russia | 43 | 0.4% |
| Scotland | 29 | 0.3% |
| Serbia | 15 | 0.1% |
| South America | 236 | 2.1% |
| South Central Asia | 36 | 0.3% |
| South Eastern Asia | 171 | 1.5% |
| Southern Europe | 88 | 0.8% |
| Syria | 28 | 0.3% |
| Trinidad and Tobago | 12 | 0.1% |
| Turkey | 15 | 0.1% |
| Ukraine | 53 | 0.5% |
| Western Asia | 71 | 0.6% |
| Western Europe | 17 | 0.2% | View All 49 Rows |
Sex and Age in Wanaque borough
Sex and Age in Wanaque borough
The most populous age groups in Wanaque borough are 25 to 29 Years (641 | 10.9%) for men and 50 to 54 Years (526 | 9.8%) for women.
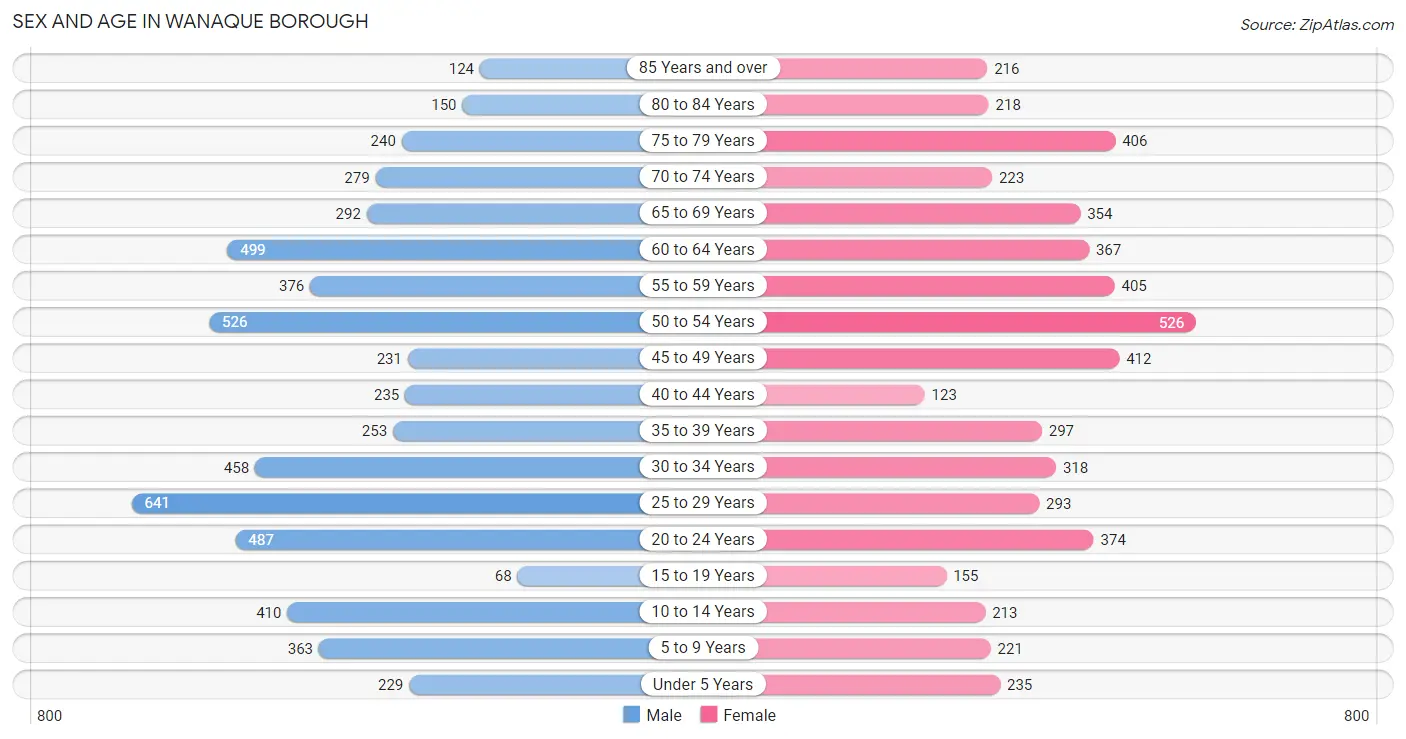
| Age Bracket | Male | Female |
| Under 5 Years | 229 (3.9%) | 235 (4.4%) |
| 5 to 9 Years | 363 (6.2%) | 221 (4.1%) |
| 10 to 14 Years | 410 (7.0%) | 213 (4.0%) |
| 15 to 19 Years | 68 (1.2%) | 155 (2.9%) |
| 20 to 24 Years | 487 (8.3%) | 374 (7.0%) |
| 25 to 29 Years | 641 (10.9%) | 293 (5.5%) |
| 30 to 34 Years | 458 (7.8%) | 318 (5.9%) |
| 35 to 39 Years | 253 (4.3%) | 297 (5.6%) |
| 40 to 44 Years | 235 (4.0%) | 123 (2.3%) |
| 45 to 49 Years | 231 (3.9%) | 412 (7.7%) |
| 50 to 54 Years | 526 (9.0%) | 526 (9.8%) |
| 55 to 59 Years | 376 (6.4%) | 405 (7.6%) |
| 60 to 64 Years | 499 (8.5%) | 367 (6.9%) |
| 65 to 69 Years | 292 (5.0%) | 354 (6.6%) |
| 70 to 74 Years | 279 (4.8%) | 223 (4.2%) |
| 75 to 79 Years | 240 (4.1%) | 406 (7.6%) |
| 80 to 84 Years | 150 (2.6%) | 218 (4.1%) |
| 85 Years and over | 124 (2.1%) | 216 (4.0%) |
| Total | 5,861 (100.0%) | 5,356 (100.0%) |
Families and Households in Wanaque borough
Median Family Size in Wanaque borough
The median family size in Wanaque borough is 3.11 persons per family, with married-couple families (2,129 | 79.3%) accounting for the largest median family size of 3.21 persons per family. On the other hand, single male/father families (180 | 6.7%) represent the smallest median family size with 2.56 persons per family.
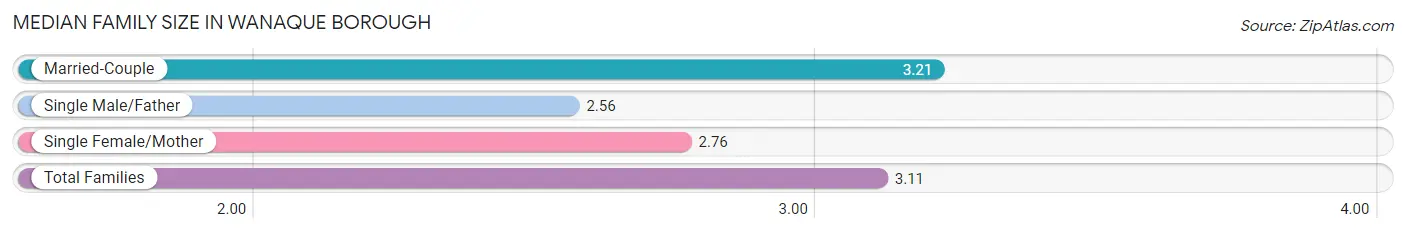
| Family Type | # Families | Family Size |
| Married-Couple | 2,129 (79.3%) | 3.21 |
| Single Male/Father | 180 (6.7%) | 2.56 |
| Single Female/Mother | 377 (14.0%) | 2.76 |
| Total Families | 2,686 (100.0%) | 3.11 |
Median Household Size in Wanaque borough
The median household size in Wanaque borough is 2.53 persons per household, with married-couple households (2,129 | 49.8%) accounting for the largest median household size of 3.22 persons per household. non-family households (1,591 | 37.2%) represent the smallest median household size with 1.46 persons per household.
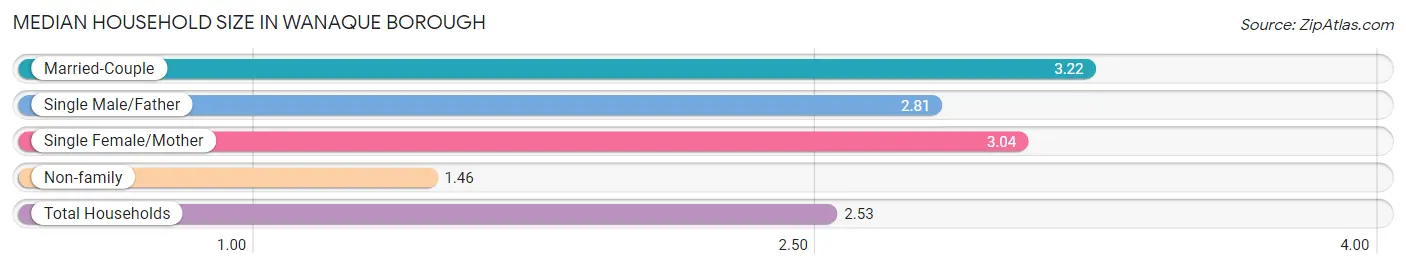
| Household Type | # Households | Household Size |
| Married-Couple | 2,129 (49.8%) | 3.22 |
| Single Male/Father | 180 (4.2%) | 2.81 |
| Single Female/Mother | 377 (8.8%) | 3.04 |
| Non-family | 1,591 (37.2%) | 1.46 |
| Total Households | 4,277 (100.0%) | 2.53 |
Household Size by Marriage Status in Wanaque borough
Out of a total of 4,277 households in Wanaque borough, 2,686 (62.8%) are family households, while 1,591 (37.2%) are nonfamily households. The most numerous type of family households are 2-person households, comprising 1,188, and the most common type of nonfamily households are 1-person households, comprising 1,073.
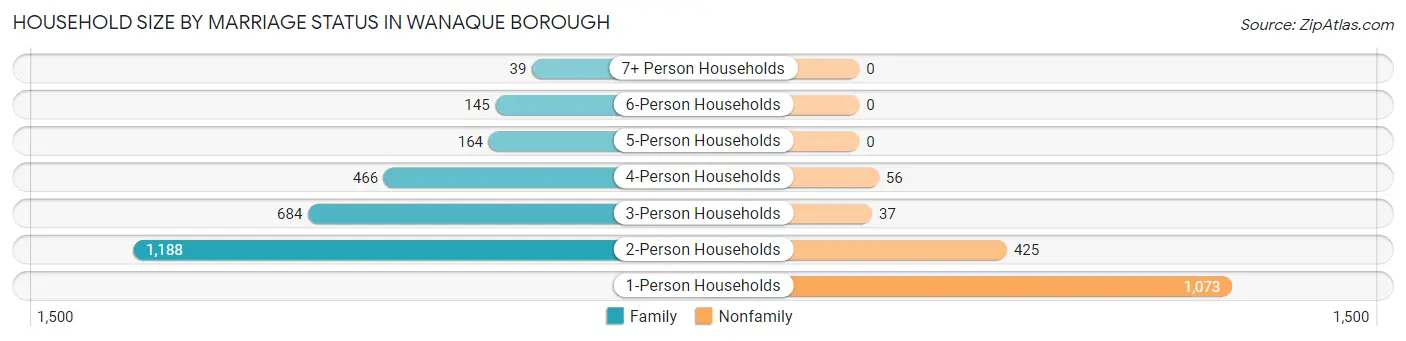
| Household Size | Family Households | Nonfamily Households |
| 1-Person Households | - | 1,073 (25.1%) |
| 2-Person Households | 1,188 (27.8%) | 425 (9.9%) |
| 3-Person Households | 684 (16.0%) | 37 (0.9%) |
| 4-Person Households | 466 (10.9%) | 56 (1.3%) |
| 5-Person Households | 164 (3.8%) | 0 (0.0%) |
| 6-Person Households | 145 (3.4%) | 0 (0.0%) |
| 7+ Person Households | 39 (0.9%) | 0 (0.0%) |
| Total | 2,686 (62.8%) | 1,591 (37.2%) |
Female Fertility in Wanaque borough
Fertility by Age in Wanaque borough
Average fertility rate in Wanaque borough is 41.0 births per 1,000 women. Women in the age bracket of 35 to 50 years have the highest fertility rate with 62.0 births per 1,000 women. Women in the age bracket of 35 to 50 years acount for 68.2% of all women with births.
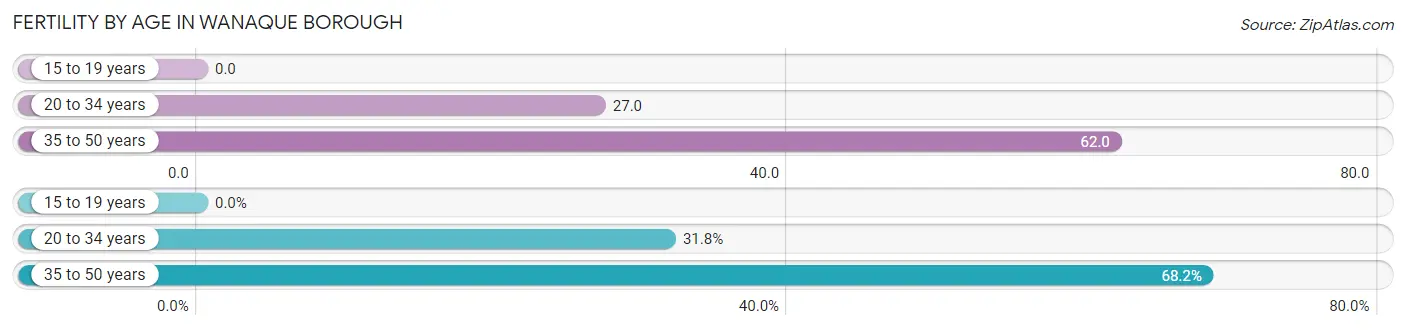
| Age Bracket | Women with Births | Births / 1,000 Women |
| 15 to 19 years | 0 (0.0%) | 0.0 |
| 20 to 34 years | 27 (31.8%) | 27.0 |
| 35 to 50 years | 58 (68.2%) | 62.0 |
| Total | 85 (100.0%) | 41.0 |
Fertility by Age by Marriage Status in Wanaque borough
87.1% of women with births (85) in Wanaque borough are married. The highest percentage of unmarried women with births falls into 20 to 34 years age bracket with 25.9% of them unmarried at the time of birth, while the lowest percentage of unmarried women with births belong to 35 to 50 years age bracket with 6.9% of them unmarried.
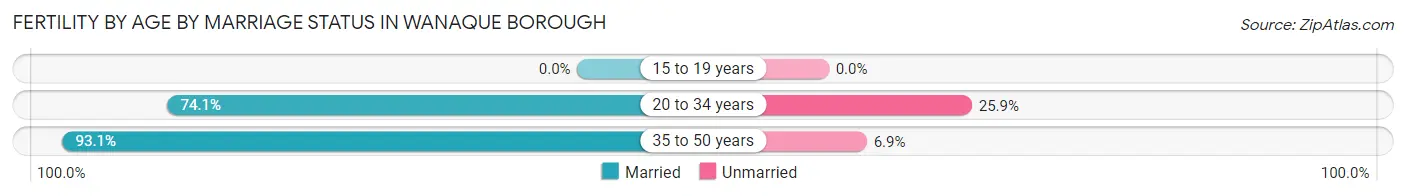
| Age Bracket | Married | Unmarried |
| 15 to 19 years | 0 (0.0%) | 0 (0.0%) |
| 20 to 34 years | 20 (74.1%) | 7 (25.9%) |
| 35 to 50 years | 54 (93.1%) | 4 (6.9%) |
| Total | 74 (87.1%) | 11 (12.9%) |
Fertility by Education in Wanaque borough
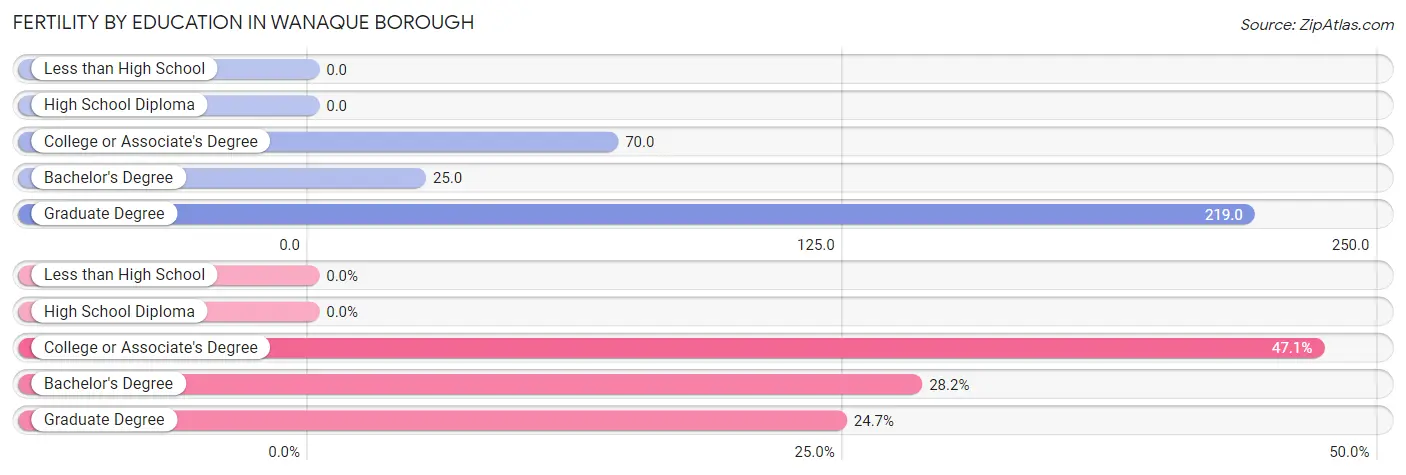
| Educational Attainment | Women with Births | Births / 1,000 Women |
| Less than High School | 0 (0.0%) | 0.0 |
| High School Diploma | 0 (0.0%) | 0.0 |
| College or Associate's Degree | 40 (47.1%) | 70.0 |
| Bachelor's Degree | 24 (28.2%) | 25.0 |
| Graduate Degree | 21 (24.7%) | 219.0 |
| Total | 85 (100.0%) | 41.0 |
Fertility by Education by Marriage Status in Wanaque borough
12.9% of women with births in Wanaque borough are unmarried. Women with the educational attainment of graduate degree are most likely to be married with 100.0% of them married at childbirth, while women with the educational attainment of college or associate's degree are least likely to be married with 17.5% of them unmarried at childbirth.
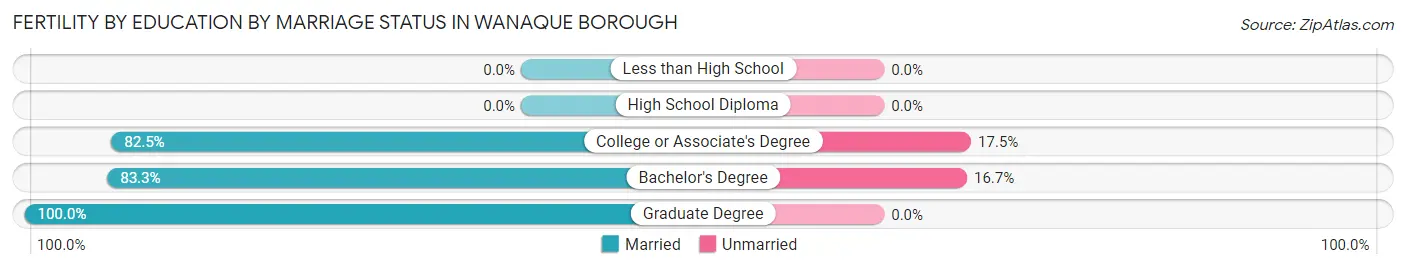
| Educational Attainment | Married | Unmarried |
| Less than High School | 0 (0.0%) | 0 (0.0%) |
| High School Diploma | 0 (0.0%) | 0 (0.0%) |
| College or Associate's Degree | 33 (82.5%) | 7 (17.5%) |
| Bachelor's Degree | 20 (83.3%) | 4 (16.7%) |
| Graduate Degree | 21 (100.0%) | 0 (0.0%) |
| Total | 74 (87.1%) | 11 (12.9%) |
Employment Characteristics in Wanaque borough
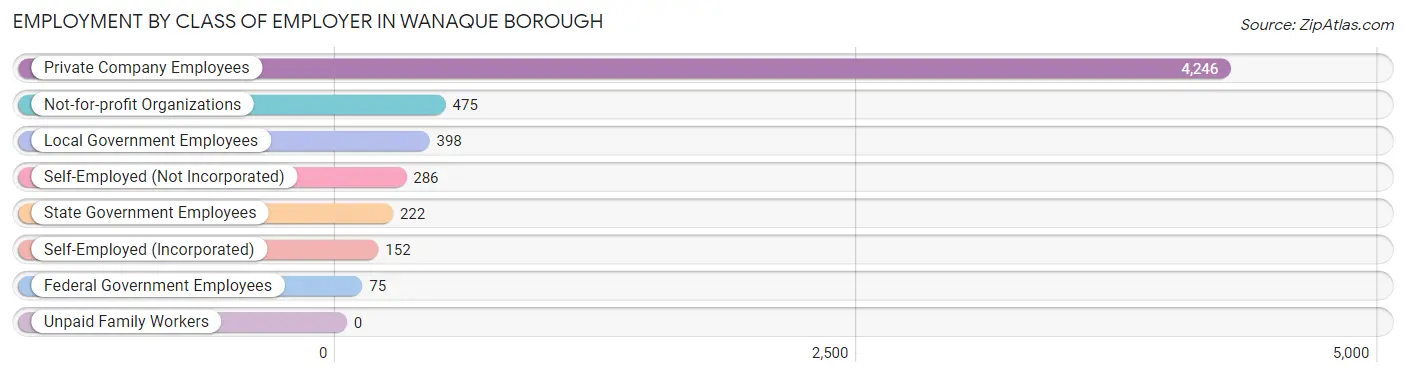
Employment by Class of Employer in Wanaque borough
Among the 5,854 employed individuals in Wanaque borough, private company employees (4,246 | 72.5%), not-for-profit organizations (475 | 8.1%), and local government employees (398 | 6.8%) make up the most common classes of employment.
| Employer Class | # Employees | % Employees |
| Private Company Employees | 4,246 | 72.5% |
| Self-Employed (Incorporated) | 152 | 2.6% |
| Self-Employed (Not Incorporated) | 286 | 4.9% |
| Not-for-profit Organizations | 475 | 8.1% |
| Local Government Employees | 398 | 6.8% |
| State Government Employees | 222 | 3.8% |
| Federal Government Employees | 75 | 1.3% |
| Unpaid Family Workers | 0 | 0.0% |
| Total | 5,854 | 100.0% |
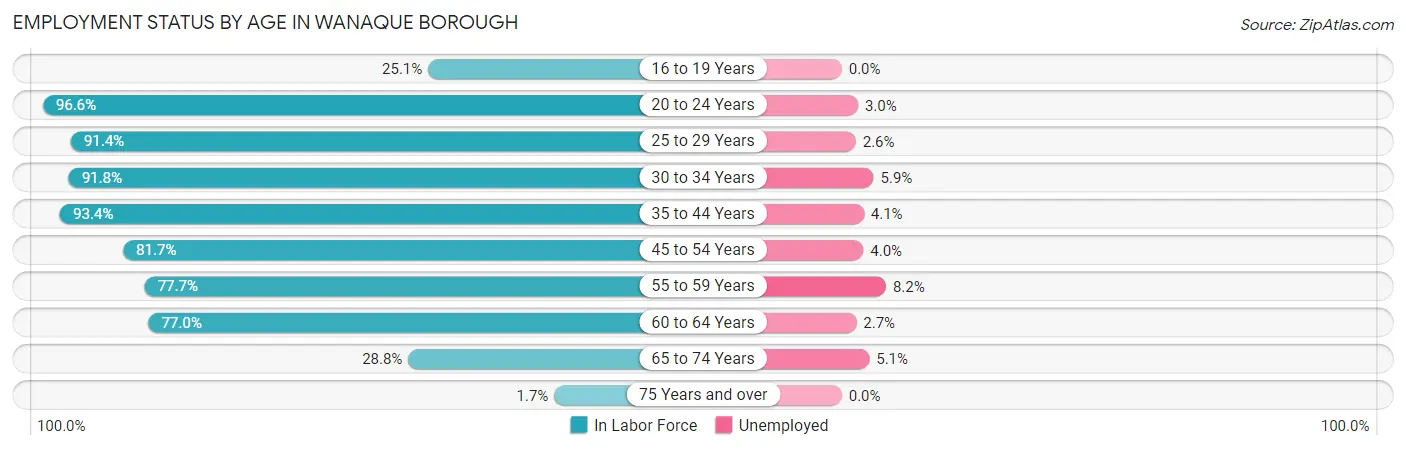
Employment Status by Age in Wanaque borough
According to the labor force statistics for Wanaque borough, out of the total population over 16 years of age (9,498), 66.4% or 6,307 individuals are in the labor force, with 4.2% or 265 of them unemployed. The age group with the highest labor force participation rate is 20 to 24 years, with 96.6% or 832 individuals in the labor force. Within the labor force, the 55 to 59 years age range has the highest percentage of unemployed individuals, with 8.2% or 50 of them being unemployed.
| Age Bracket | In Labor Force | Unemployed |
| 16 to 19 Years | 44 (25.1%) | 0 (0.0%) |
| 20 to 24 Years | 832 (96.6%) | 25 (3.0%) |
| 25 to 29 Years | 854 (91.4%) | 22 (2.6%) |
| 30 to 34 Years | 712 (91.8%) | 42 (5.9%) |
| 35 to 44 Years | 848 (93.4%) | 35 (4.1%) |
| 45 to 54 Years | 1,385 (81.7%) | 55 (4.0%) |
| 55 to 59 Years | 607 (77.7%) | 50 (8.2%) |
| 60 to 64 Years | 667 (77.0%) | 18 (2.7%) |
| 65 to 74 Years | 331 (28.8%) | 17 (5.1%) |
| 75 Years and over | 23 (1.7%) | 0 (0.0%) |
| Total | 6,307 (66.4%) | 265 (4.2%) |
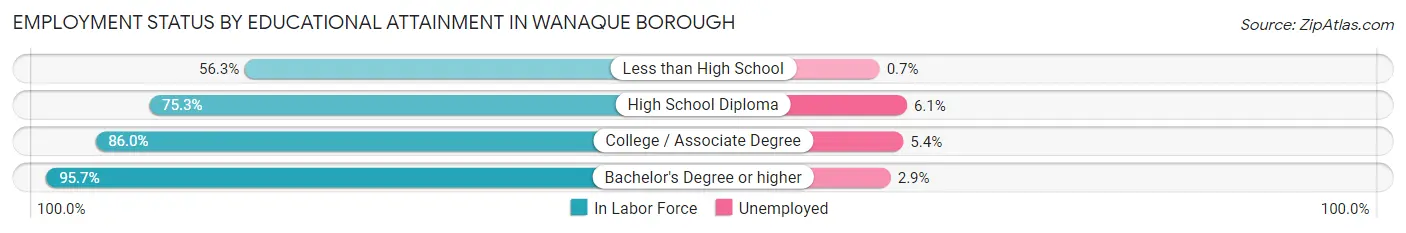
Employment Status by Educational Attainment in Wanaque borough
According to labor force statistics for Wanaque borough, 85.1% of individuals (5,072) out of the total population between 25 and 64 years of age (5,960) are in the labor force, with 4.4% or 223 of them being unemployed. The group with the highest labor force participation rate are those with the educational attainment of bachelor's degree or higher, with 95.7% or 2,173 individuals in the labor force. Within the labor force, individuals with high school diploma education have the highest percentage of unemployment, with 6.1% or 85 of them being unemployed.
| Educational Attainment | In Labor Force | Unemployed |
| Less than High School | 144 (56.3%) | 2 (0.7%) |
| High School Diploma | 1,399 (75.3%) | 113 (6.1%) |
| College / Associate Degree | 1,354 (86.0%) | 85 (5.4%) |
| Bachelor's Degree or higher | 2,173 (95.7%) | 66 (2.9%) |
| Total | 5,072 (85.1%) | 262 (4.4%) |
Employment Occupations by Sex in Wanaque borough
Management, Business, Science and Arts Occupations
The most common Management, Business, Science and Arts occupations in Wanaque borough are Management (643 | 10.6%), Community & Social Service (611 | 10.1%), Business & Financial (573 | 9.5%), Education Instruction & Library (341 | 5.7%), and Computers, Engineering & Science (275 | 4.5%).
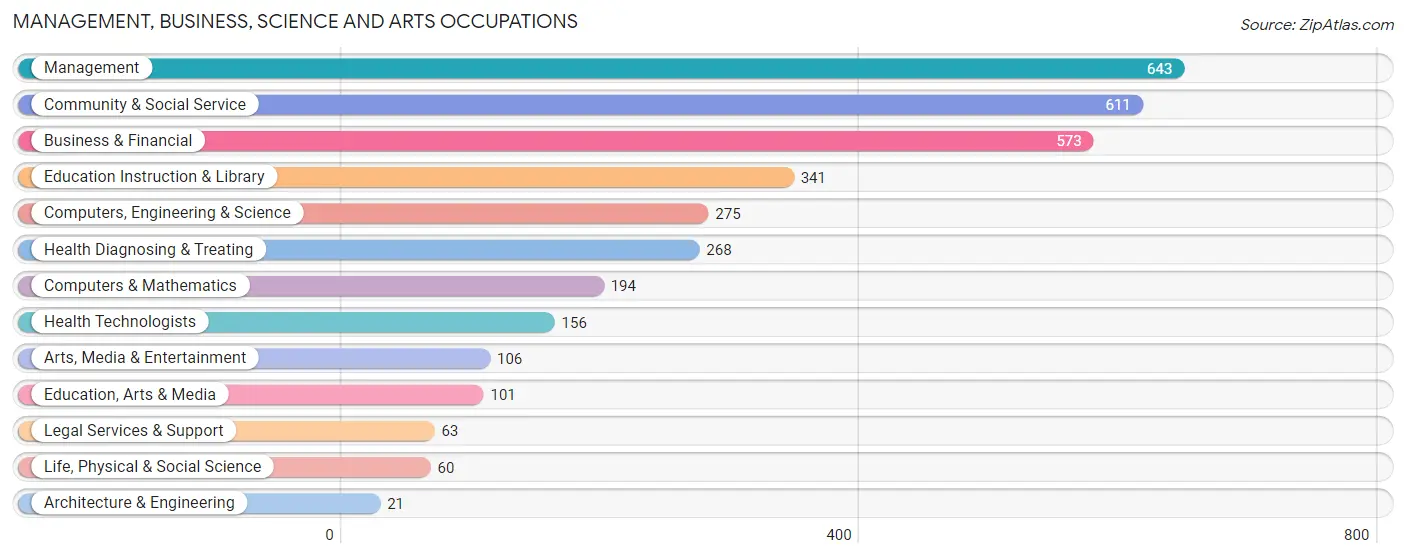
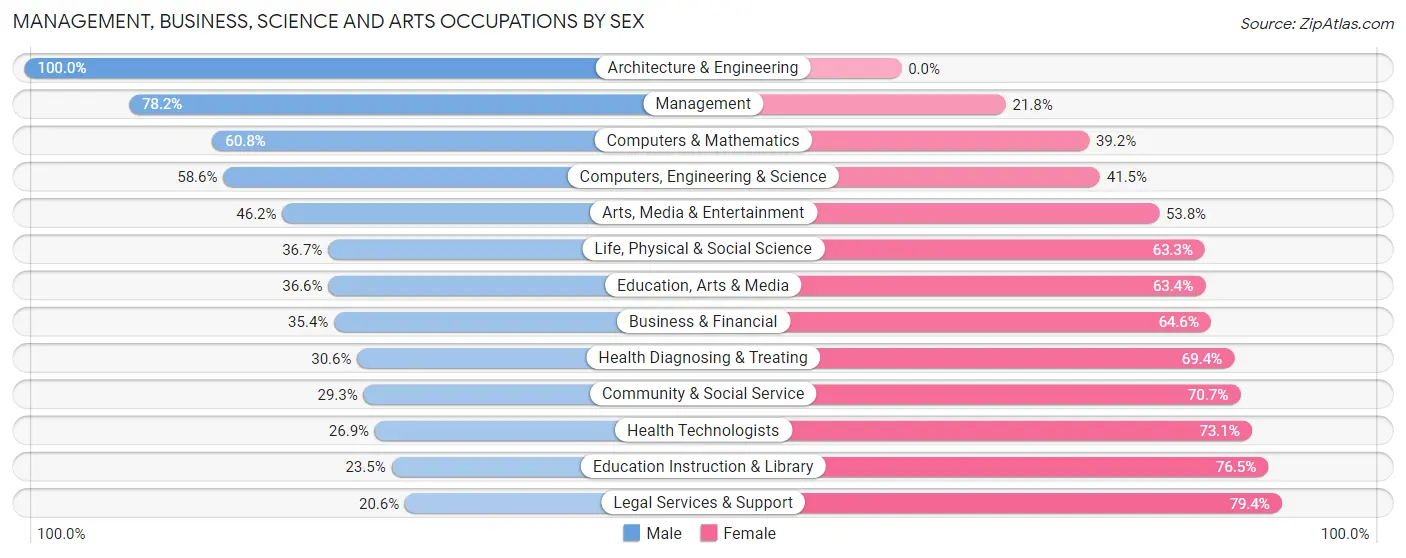
Management, Business, Science and Arts Occupations by Sex
Within the Management, Business, Science and Arts occupations in Wanaque borough, the most male-oriented occupations are Architecture & Engineering (100.0%), Management (78.2%), and Computers & Mathematics (60.8%), while the most female-oriented occupations are Legal Services & Support (79.4%), Education Instruction & Library (76.5%), and Health Technologists (73.1%).
| Occupation | Male | Female |
| Management | 503 (78.2%) | 140 (21.8%) |
| Business & Financial | 203 (35.4%) | 370 (64.6%) |
| Computers, Engineering & Science | 161 (58.6%) | 114 (41.4%) |
| Computers & Mathematics | 118 (60.8%) | 76 (39.2%) |
| Architecture & Engineering | 21 (100.0%) | 0 (0.0%) |
| Life, Physical & Social Science | 22 (36.7%) | 38 (63.3%) |
| Community & Social Service | 179 (29.3%) | 432 (70.7%) |
| Education, Arts & Media | 37 (36.6%) | 64 (63.4%) |
| Legal Services & Support | 13 (20.6%) | 50 (79.4%) |
| Education Instruction & Library | 80 (23.5%) | 261 (76.5%) |
| Arts, Media & Entertainment | 49 (46.2%) | 57 (53.8%) |
| Health Diagnosing & Treating | 82 (30.6%) | 186 (69.4%) |
| Health Technologists | 42 (26.9%) | 114 (73.1%) |
| Total (Category) | 1,128 (47.6%) | 1,242 (52.4%) |
| Total (Overall) | 3,519 (58.3%) | 2,519 (41.7%) |
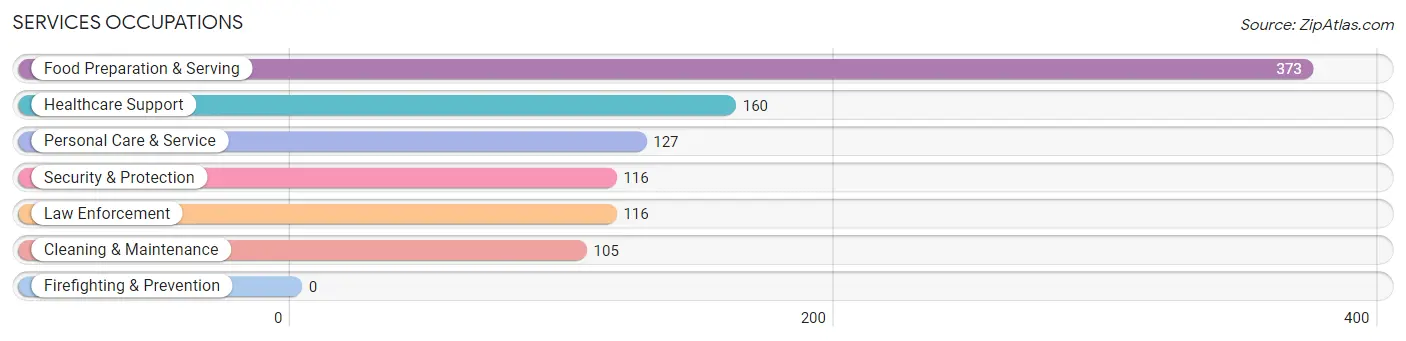
Services Occupations
The most common Services occupations in Wanaque borough are Food Preparation & Serving (373 | 6.2%), Healthcare Support (160 | 2.6%), Personal Care & Service (127 | 2.1%), Security & Protection (116 | 1.9%), and Law Enforcement (116 | 1.9%).
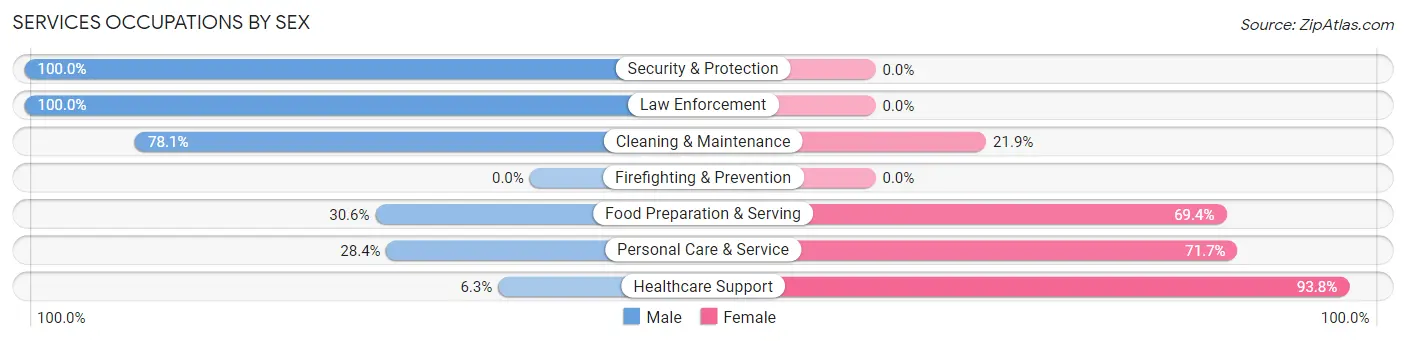
Services Occupations by Sex
Within the Services occupations in Wanaque borough, the most male-oriented occupations are Security & Protection (100.0%), Law Enforcement (100.0%), and Cleaning & Maintenance (78.1%), while the most female-oriented occupations are Healthcare Support (93.8%), Personal Care & Service (71.7%), and Food Preparation & Serving (69.4%).
| Occupation | Male | Female |
| Healthcare Support | 10 (6.2%) | 150 (93.8%) |
| Security & Protection | 116 (100.0%) | 0 (0.0%) |
| Firefighting & Prevention | 0 (0.0%) | 0 (0.0%) |
| Law Enforcement | 116 (100.0%) | 0 (0.0%) |
| Food Preparation & Serving | 114 (30.6%) | 259 (69.4%) |
| Cleaning & Maintenance | 82 (78.1%) | 23 (21.9%) |
| Personal Care & Service | 36 (28.3%) | 91 (71.7%) |
| Total (Category) | 358 (40.6%) | 523 (59.4%) |
| Total (Overall) | 3,519 (58.3%) | 2,519 (41.7%) |
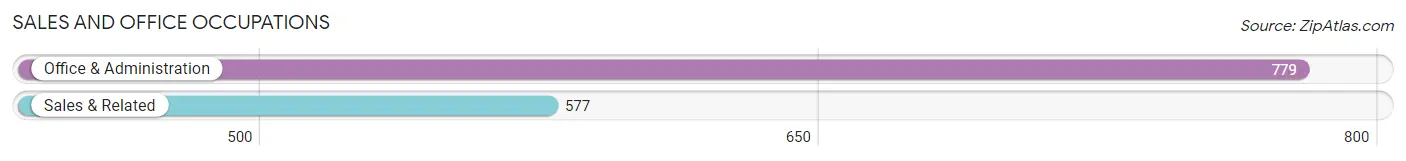
Sales and Office Occupations
The most common Sales and Office occupations in Wanaque borough are Office & Administration (779 | 12.9%), and Sales & Related (577 | 9.6%).
Sales and Office Occupations by Sex
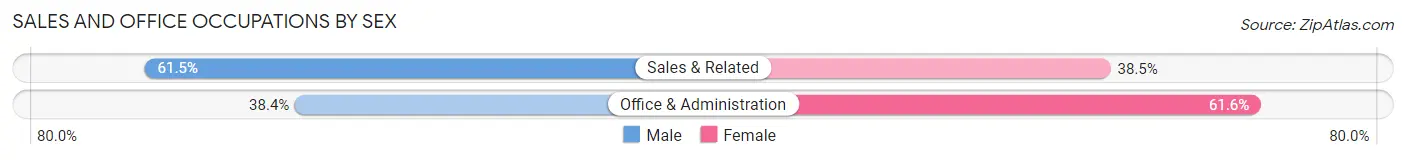
| Occupation | Male | Female |
| Sales & Related | 355 (61.5%) | 222 (38.5%) |
| Office & Administration | 299 (38.4%) | 480 (61.6%) |
| Total (Category) | 654 (48.2%) | 702 (51.8%) |
| Total (Overall) | 3,519 (58.3%) | 2,519 (41.7%) |
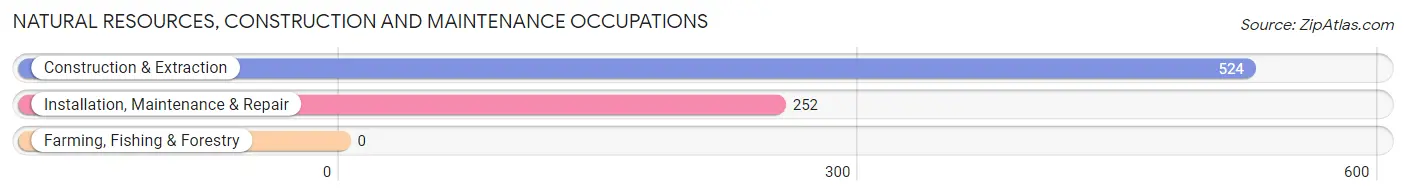
Natural Resources, Construction and Maintenance Occupations
The most common Natural Resources, Construction and Maintenance occupations in Wanaque borough are Construction & Extraction (524 | 8.7%), and Installation, Maintenance & Repair (252 | 4.2%).
Natural Resources, Construction and Maintenance Occupations by Sex
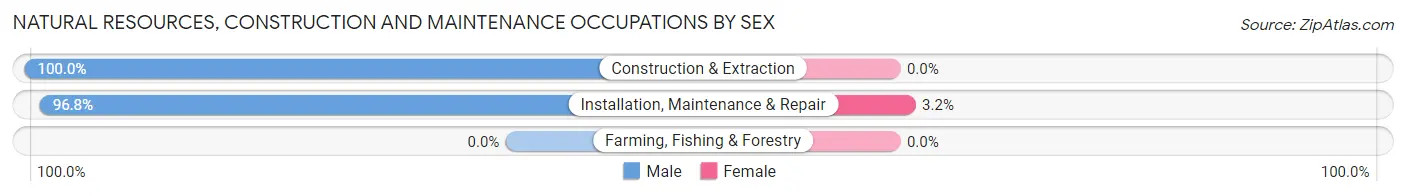
| Occupation | Male | Female |
| Farming, Fishing & Forestry | 0 (0.0%) | 0 (0.0%) |
| Construction & Extraction | 524 (100.0%) | 0 (0.0%) |
| Installation, Maintenance & Repair | 244 (96.8%) | 8 (3.2%) |
| Total (Category) | 768 (99.0%) | 8 (1.0%) |
| Total (Overall) | 3,519 (58.3%) | 2,519 (41.7%) |
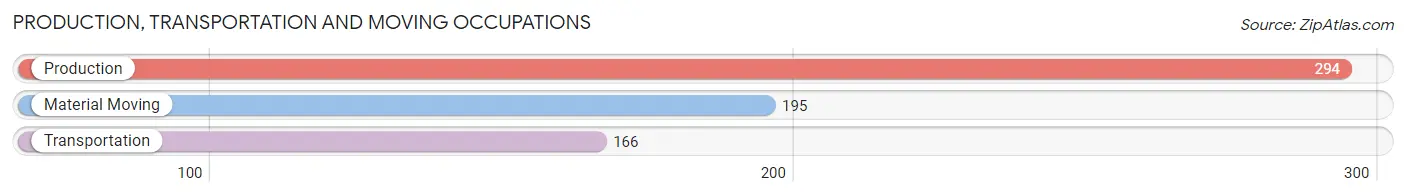
Production, Transportation and Moving Occupations
The most common Production, Transportation and Moving occupations in Wanaque borough are Production (294 | 4.9%), Material Moving (195 | 3.2%), and Transportation (166 | 2.8%).
Production, Transportation and Moving Occupations by Sex
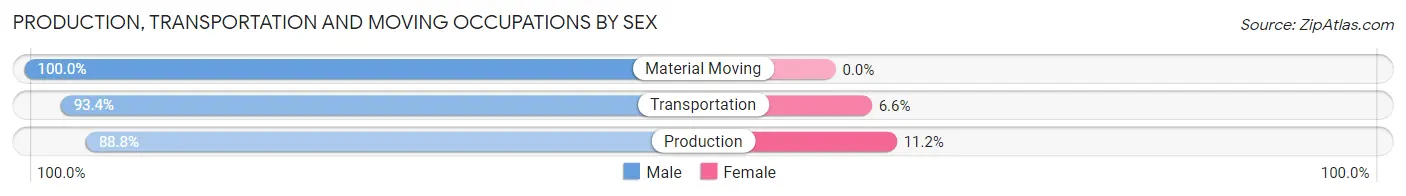
| Occupation | Male | Female |
| Production | 261 (88.8%) | 33 (11.2%) |
| Transportation | 155 (93.4%) | 11 (6.6%) |
| Material Moving | 195 (100.0%) | 0 (0.0%) |
| Total (Category) | 611 (93.3%) | 44 (6.7%) |
| Total (Overall) | 3,519 (58.3%) | 2,519 (41.7%) |
Employment Industries by Sex in Wanaque borough
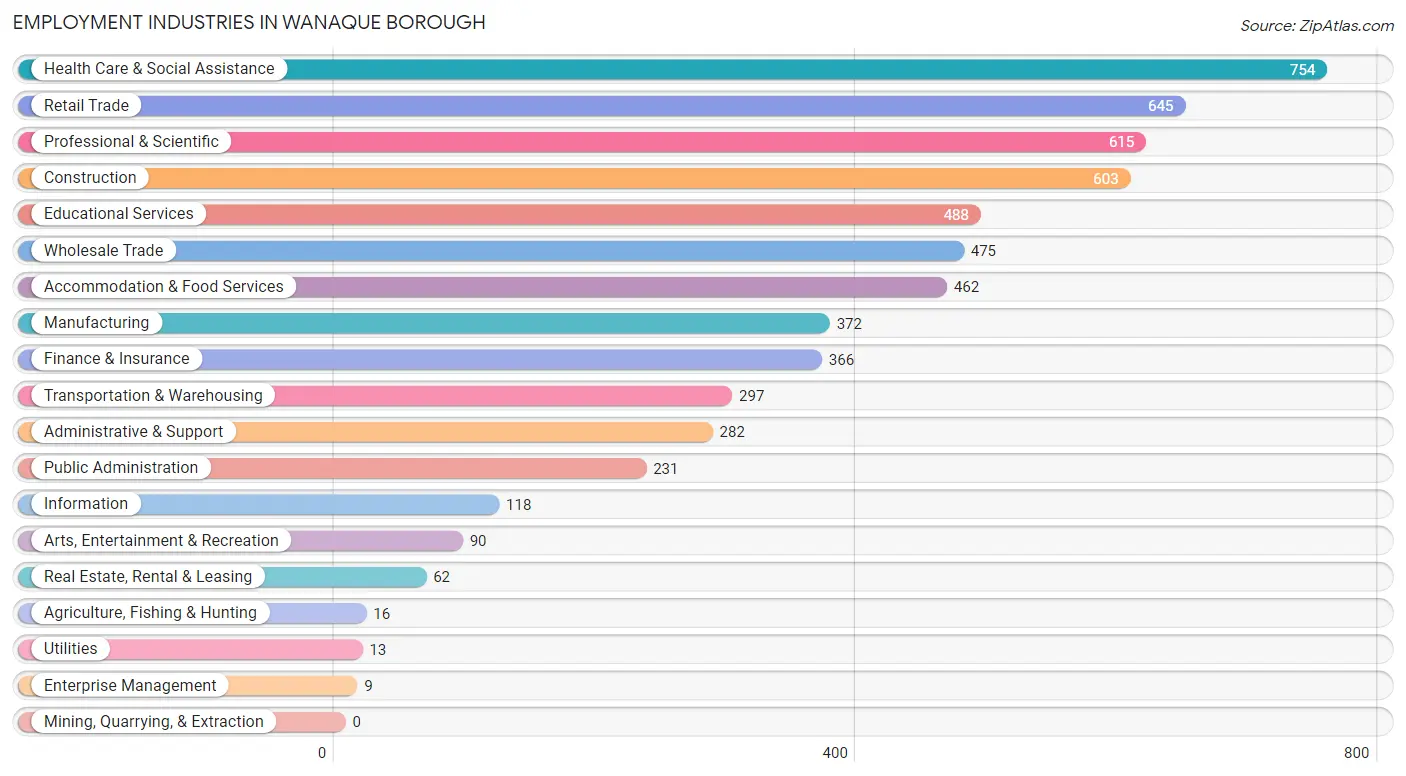
Employment Industries in Wanaque borough
The major employment industries in Wanaque borough include Health Care & Social Assistance (754 | 12.5%), Retail Trade (645 | 10.7%), Professional & Scientific (615 | 10.2%), Construction (603 | 10.0%), and Educational Services (488 | 8.1%).
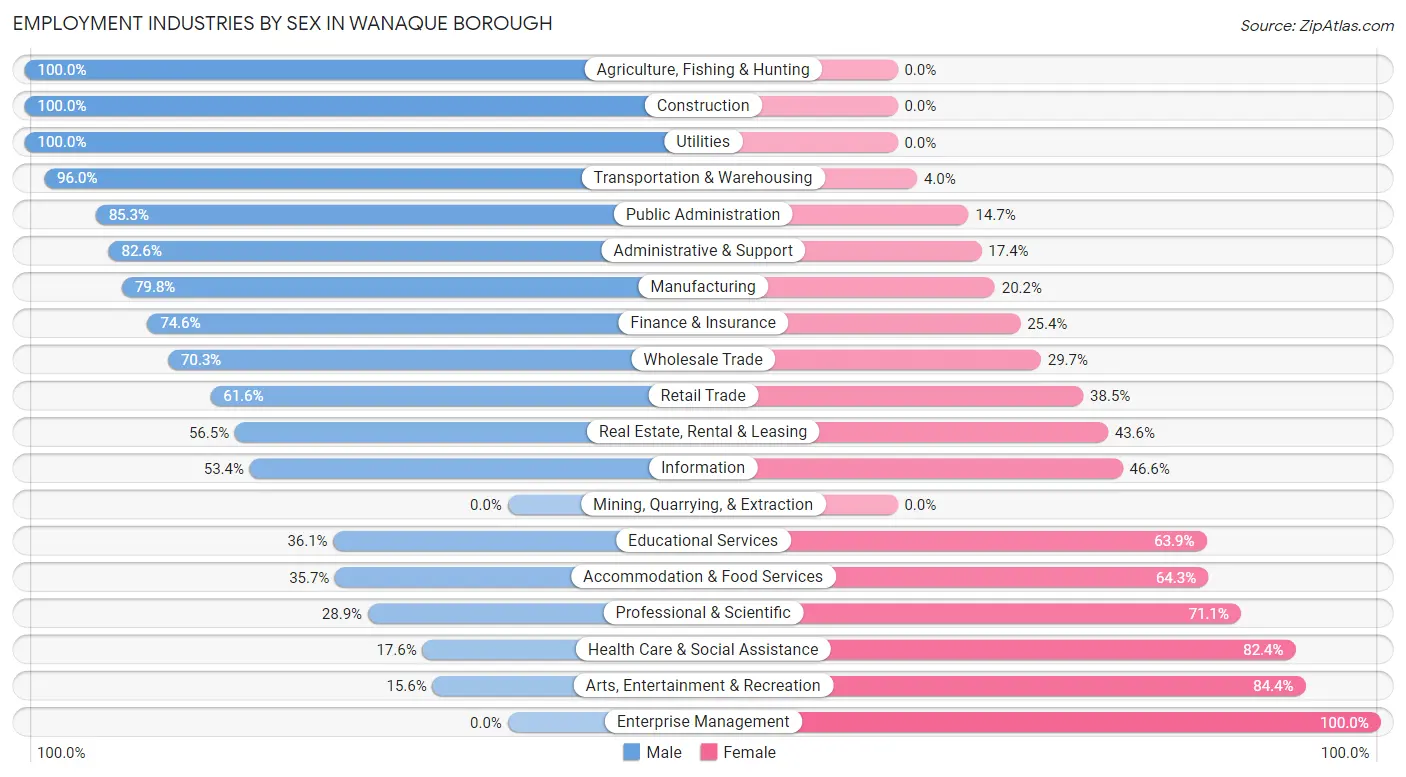
Employment Industries by Sex in Wanaque borough
The Wanaque borough industries that see more men than women are Agriculture, Fishing & Hunting (100.0%), Construction (100.0%), and Utilities (100.0%), whereas the industries that tend to have a higher number of women are Enterprise Management (100.0%), Arts, Entertainment & Recreation (84.4%), and Health Care & Social Assistance (82.4%).
| Industry | Male | Female |
| Agriculture, Fishing & Hunting | 16 (100.0%) | 0 (0.0%) |
| Mining, Quarrying, & Extraction | 0 (0.0%) | 0 (0.0%) |
| Construction | 603 (100.0%) | 0 (0.0%) |
| Manufacturing | 297 (79.8%) | 75 (20.2%) |
| Wholesale Trade | 334 (70.3%) | 141 (29.7%) |
| Retail Trade | 397 (61.6%) | 248 (38.5%) |
| Transportation & Warehousing | 285 (96.0%) | 12 (4.0%) |
| Utilities | 13 (100.0%) | 0 (0.0%) |
| Information | 63 (53.4%) | 55 (46.6%) |
| Finance & Insurance | 273 (74.6%) | 93 (25.4%) |
| Real Estate, Rental & Leasing | 35 (56.5%) | 27 (43.5%) |
| Professional & Scientific | 178 (28.9%) | 437 (71.1%) |
| Enterprise Management | 0 (0.0%) | 9 (100.0%) |
| Administrative & Support | 233 (82.6%) | 49 (17.4%) |
| Educational Services | 176 (36.1%) | 312 (63.9%) |
| Health Care & Social Assistance | 133 (17.6%) | 621 (82.4%) |
| Arts, Entertainment & Recreation | 14 (15.6%) | 76 (84.4%) |
| Accommodation & Food Services | 165 (35.7%) | 297 (64.3%) |
| Public Administration | 197 (85.3%) | 34 (14.7%) |
| Total | 3,519 (58.3%) | 2,519 (41.7%) |
Education in Wanaque borough
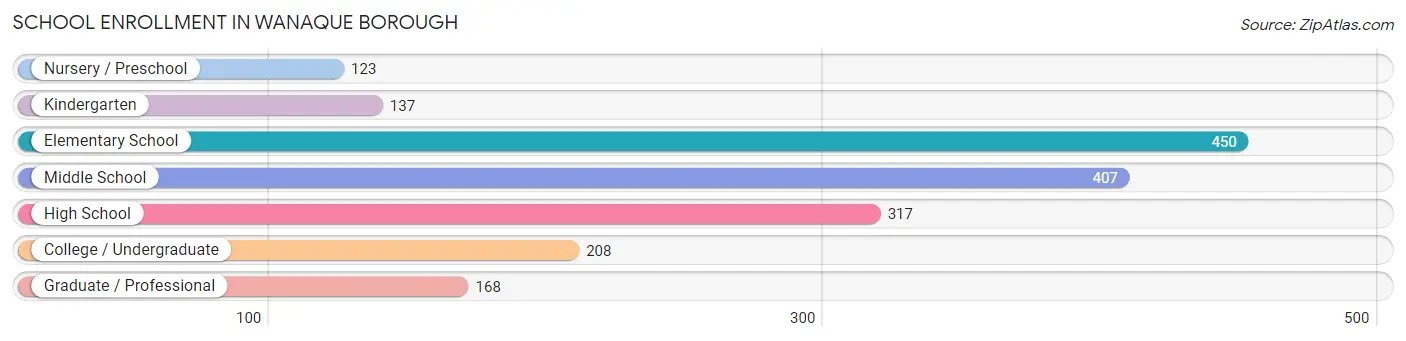
School Enrollment in Wanaque borough
The most common levels of schooling among the 1,810 students in Wanaque borough are elementary school (450 | 24.9%), middle school (407 | 22.5%), and high school (317 | 17.5%).
| School Level | # Students | % Students |
| Nursery / Preschool | 123 | 6.8% |
| Kindergarten | 137 | 7.6% |
| Elementary School | 450 | 24.9% |
| Middle School | 407 | 22.5% |
| High School | 317 | 17.5% |
| College / Undergraduate | 208 | 11.5% |
| Graduate / Professional | 168 | 9.3% |
| Total | 1,810 | 100.0% |
School Enrollment by Age by Funding Source in Wanaque borough
Out of a total of 1,810 students who are enrolled in schools in Wanaque borough, 261 (14.4%) attend a private institution, while the remaining 1,549 (85.6%) are enrolled in public schools. The age group of 35 years and over has the highest likelihood of being enrolled in private schools, with 72 (67.3% in the age bracket) enrolled. Conversely, the age group of 5 to 9 year old has the lowest likelihood of being enrolled in a private school, with 493 (100.0% in the age bracket) attending a public institution.
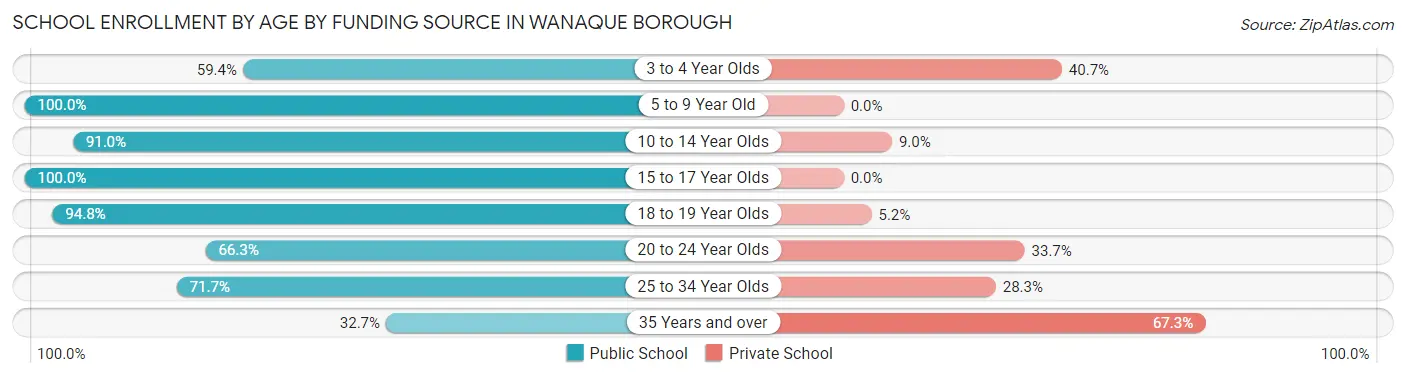
| Age Bracket | Public School | Private School |
| 3 to 4 Year Olds | 73 (59.4%) | 50 (40.6%) |
| 5 to 9 Year Old | 493 (100.0%) | 0 (0.0%) |
| 10 to 14 Year Olds | 567 (91.0%) | 56 (9.0%) |
| 15 to 17 Year Olds | 146 (100.0%) | 0 (0.0%) |
| 18 to 19 Year Olds | 73 (94.8%) | 4 (5.2%) |
| 20 to 24 Year Olds | 120 (66.3%) | 61 (33.7%) |
| 25 to 34 Year Olds | 43 (71.7%) | 17 (28.3%) |
| 35 Years and over | 35 (32.7%) | 72 (67.3%) |
| Total | 1,549 (85.6%) | 261 (14.4%) |
Educational Attainment by Field of Study in Wanaque borough
Business (650 | 18.7%), education (480 | 13.8%), engineering (354 | 10.2%), science & technology (310 | 8.9%), and psychology (250 | 7.2%) are the most common fields of study among 3,480 individuals in Wanaque borough who have obtained a bachelor's degree or higher.
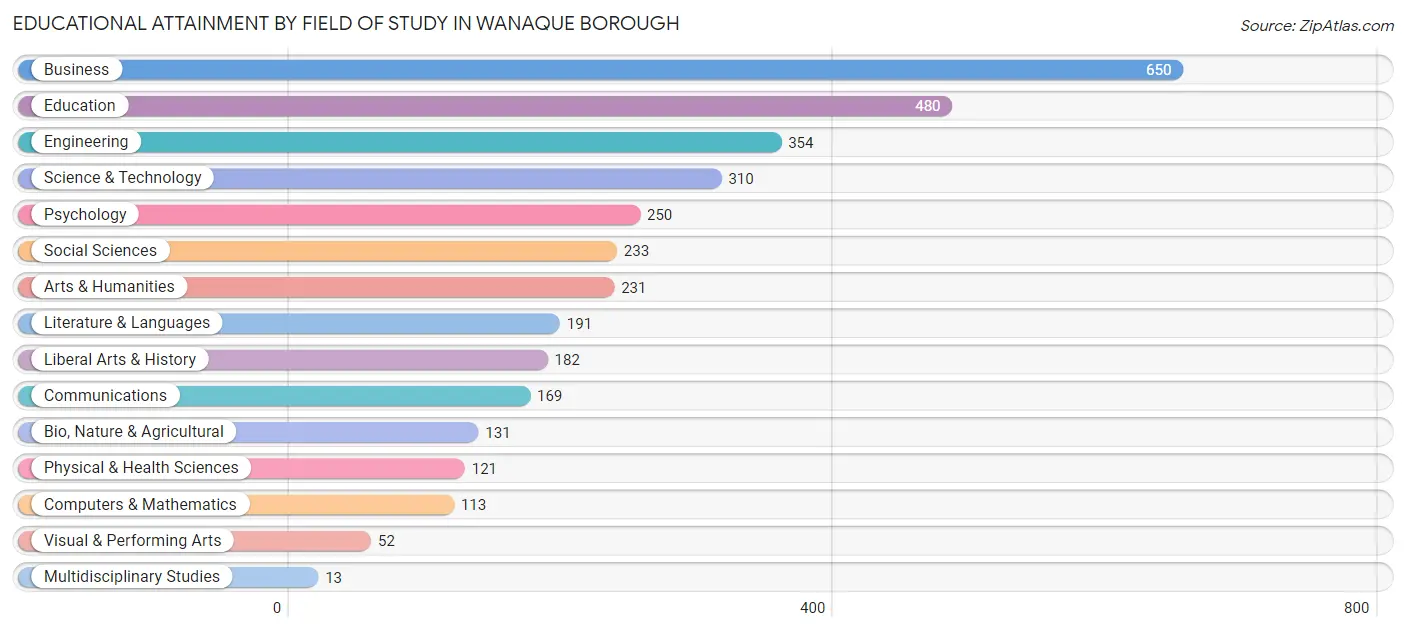
| Field of Study | # Graduates | % Graduates |
| Computers & Mathematics | 113 | 3.3% |
| Bio, Nature & Agricultural | 131 | 3.8% |
| Physical & Health Sciences | 121 | 3.5% |
| Psychology | 250 | 7.2% |
| Social Sciences | 233 | 6.7% |
| Engineering | 354 | 10.2% |
| Multidisciplinary Studies | 13 | 0.4% |
| Science & Technology | 310 | 8.9% |
| Business | 650 | 18.7% |
| Education | 480 | 13.8% |
| Literature & Languages | 191 | 5.5% |
| Liberal Arts & History | 182 | 5.2% |
| Visual & Performing Arts | 52 | 1.5% |
| Communications | 169 | 4.9% |
| Arts & Humanities | 231 | 6.6% |
| Total | 3,480 | 100.0% |
Transportation & Commute in Wanaque borough
Vehicle Availability by Sex in Wanaque borough
The most prevalent vehicle ownership categories in Wanaque borough are males with 2 vehicles (1,518, accounting for 45.2%) and females with 2 vehicles (1,525, making up 61.2%).
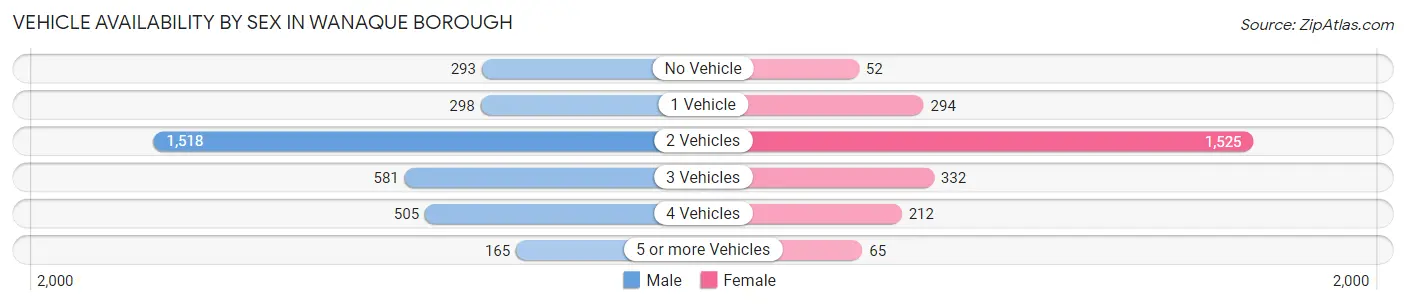
| Vehicles Available | Male | Female |
| No Vehicle | 293 (8.7%) | 52 (2.1%) |
| 1 Vehicle | 298 (8.9%) | 294 (11.8%) |
| 2 Vehicles | 1,518 (45.2%) | 1,525 (61.5%) |
| 3 Vehicles | 581 (17.3%) | 332 (13.4%) |
| 4 Vehicles | 505 (15.0%) | 212 (8.6%) |
| 5 or more Vehicles | 165 (4.9%) | 65 (2.6%) |
| Total | 3,360 (100.0%) | 2,480 (100.0%) |
Commute Time in Wanaque borough
The most frequently occuring commute durations in Wanaque borough are 30 to 34 minutes (991 commuters, 17.9%), 20 to 24 minutes (785 commuters, 14.2%), and 40 to 44 minutes (543 commuters, 9.8%).
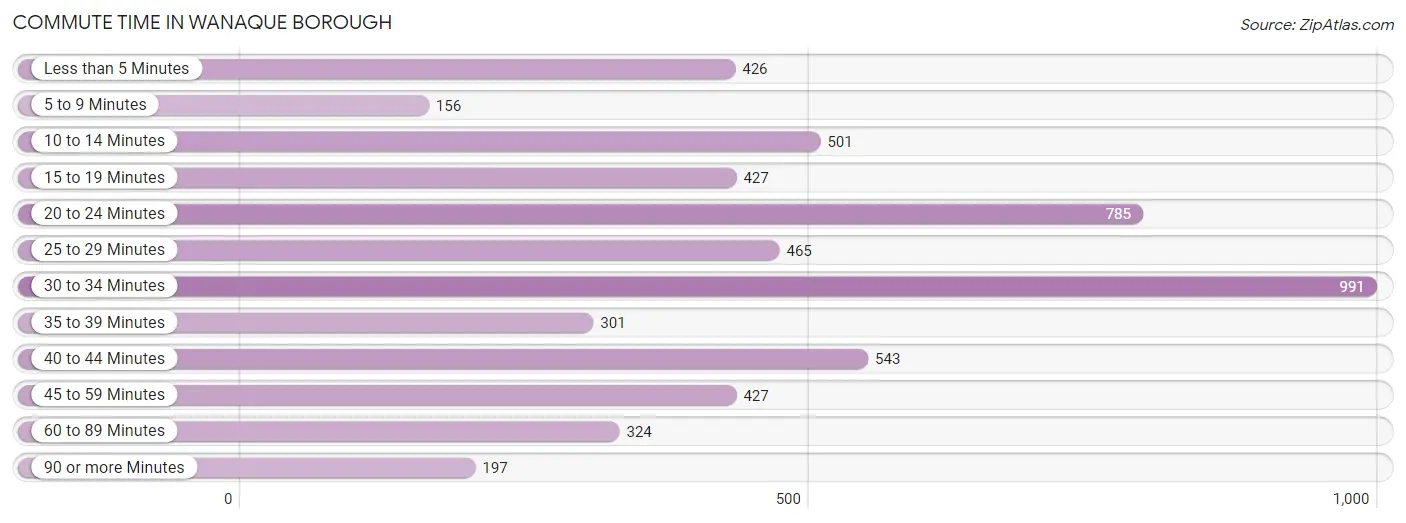
| Commute Time | # Commuters | % Commuters |
| Less than 5 Minutes | 426 | 7.7% |
| 5 to 9 Minutes | 156 | 2.8% |
| 10 to 14 Minutes | 501 | 9.0% |
| 15 to 19 Minutes | 427 | 7.7% |
| 20 to 24 Minutes | 785 | 14.2% |
| 25 to 29 Minutes | 465 | 8.4% |
| 30 to 34 Minutes | 991 | 17.9% |
| 35 to 39 Minutes | 301 | 5.4% |
| 40 to 44 Minutes | 543 | 9.8% |
| 45 to 59 Minutes | 427 | 7.7% |
| 60 to 89 Minutes | 324 | 5.9% |
| 90 or more Minutes | 197 | 3.5% |
Commute Time by Sex in Wanaque borough
The most common commute times in Wanaque borough are 30 to 34 minutes (589 commuters, 19.0%) for males and 30 to 34 minutes (402 commuters, 16.5%) for females.
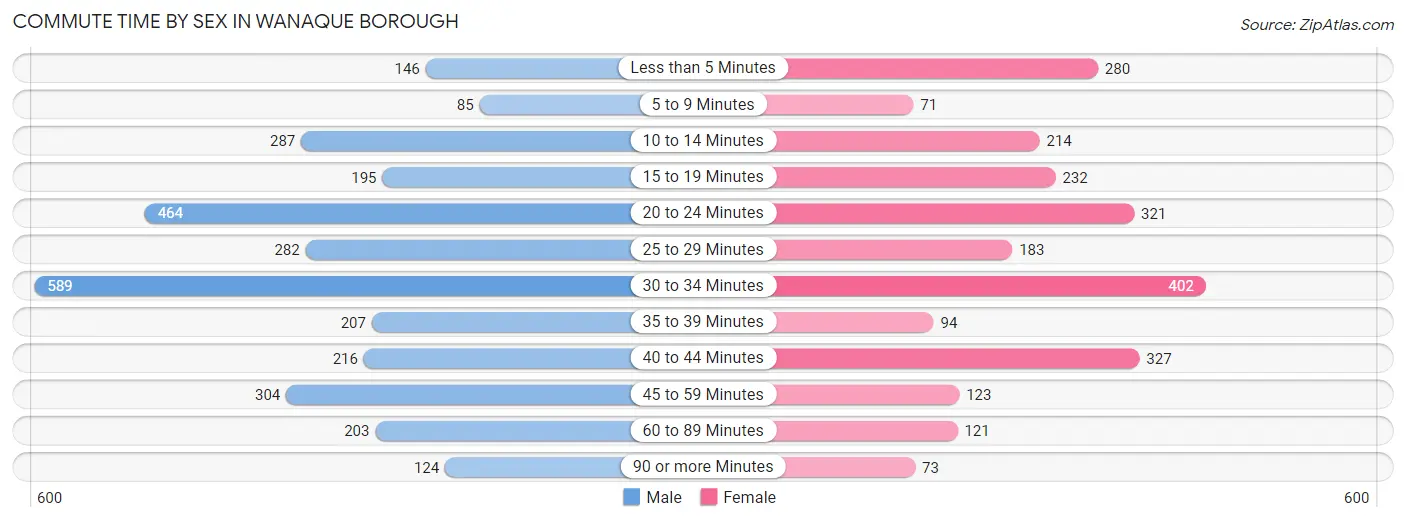
| Commute Time | Male | Female |
| Less than 5 Minutes | 146 (4.7%) | 280 (11.5%) |
| 5 to 9 Minutes | 85 (2.7%) | 71 (2.9%) |
| 10 to 14 Minutes | 287 (9.2%) | 214 (8.8%) |
| 15 to 19 Minutes | 195 (6.3%) | 232 (9.5%) |
| 20 to 24 Minutes | 464 (15.0%) | 321 (13.2%) |
| 25 to 29 Minutes | 282 (9.1%) | 183 (7.5%) |
| 30 to 34 Minutes | 589 (19.0%) | 402 (16.5%) |
| 35 to 39 Minutes | 207 (6.7%) | 94 (3.8%) |
| 40 to 44 Minutes | 216 (7.0%) | 327 (13.4%) |
| 45 to 59 Minutes | 304 (9.8%) | 123 (5.0%) |
| 60 to 89 Minutes | 203 (6.5%) | 121 (5.0%) |
| 90 or more Minutes | 124 (4.0%) | 73 (3.0%) |
Time of Departure to Work by Sex in Wanaque borough
The most frequent times of departure to work in Wanaque borough are 7:00 AM to 7:29 AM (586, 18.9%) for males and 8:00 AM to 8:29 AM (746, 30.6%) for females.
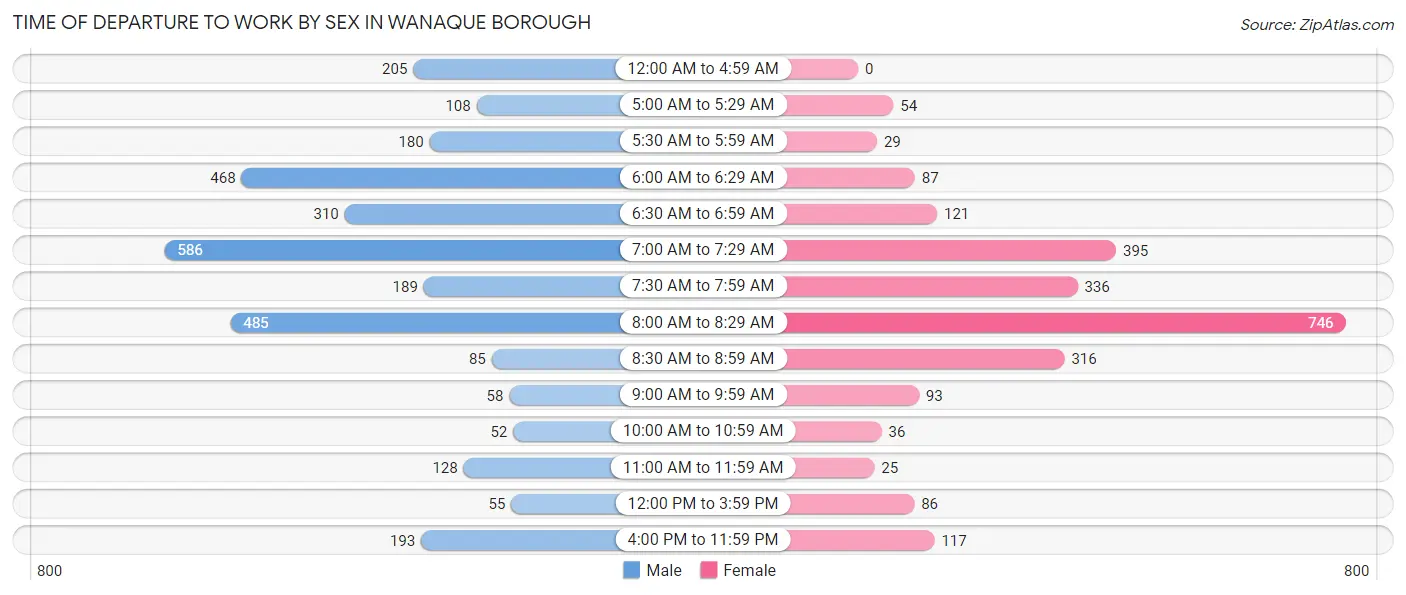
| Time of Departure | Male | Female |
| 12:00 AM to 4:59 AM | 205 (6.6%) | 0 (0.0%) |
| 5:00 AM to 5:29 AM | 108 (3.5%) | 54 (2.2%) |
| 5:30 AM to 5:59 AM | 180 (5.8%) | 29 (1.2%) |
| 6:00 AM to 6:29 AM | 468 (15.1%) | 87 (3.6%) |
| 6:30 AM to 6:59 AM | 310 (10.0%) | 121 (5.0%) |
| 7:00 AM to 7:29 AM | 586 (18.9%) | 395 (16.2%) |
| 7:30 AM to 7:59 AM | 189 (6.1%) | 336 (13.8%) |
| 8:00 AM to 8:29 AM | 485 (15.6%) | 746 (30.6%) |
| 8:30 AM to 8:59 AM | 85 (2.7%) | 316 (13.0%) |
| 9:00 AM to 9:59 AM | 58 (1.9%) | 93 (3.8%) |
| 10:00 AM to 10:59 AM | 52 (1.7%) | 36 (1.5%) |
| 11:00 AM to 11:59 AM | 128 (4.1%) | 25 (1.0%) |
| 12:00 PM to 3:59 PM | 55 (1.8%) | 86 (3.5%) |
| 4:00 PM to 11:59 PM | 193 (6.2%) | 117 (4.8%) |
| Total | 3,102 (100.0%) | 2,441 (100.0%) |
Housing Occupancy in Wanaque borough
Occupancy by Ownership in Wanaque borough
Of the total 4,277 dwellings in Wanaque borough, owner-occupied units account for 3,283 (76.8%), while renter-occupied units make up 994 (23.2%).
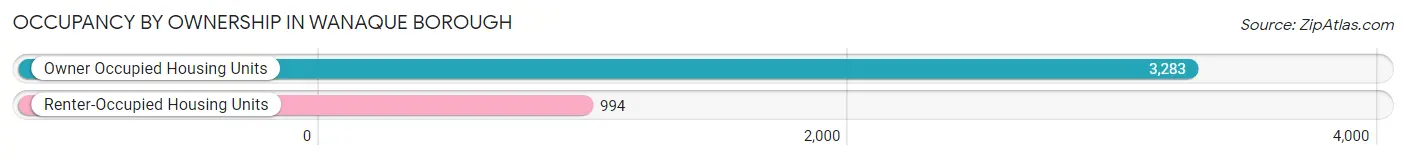
| Occupancy | # Housing Units | % Housing Units |
| Owner Occupied Housing Units | 3,283 | 76.8% |
| Renter-Occupied Housing Units | 994 | 23.2% |
| Total Occupied Housing Units | 4,277 | 100.0% |
Occupancy by Household Size in Wanaque borough
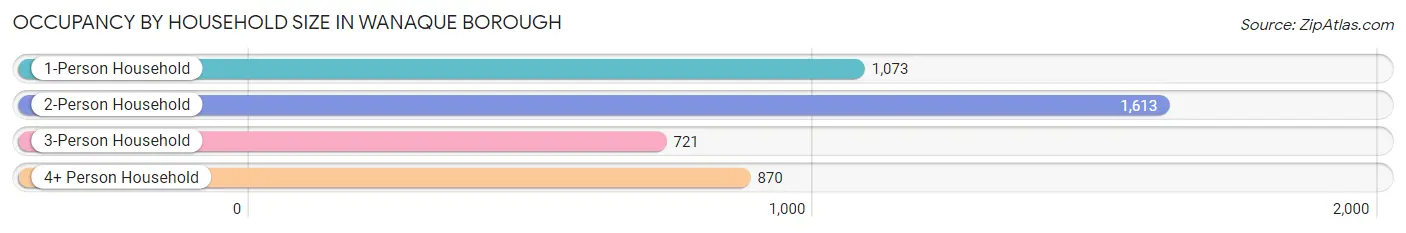
| Household Size | # Housing Units | % Housing Units |
| 1-Person Household | 1,073 | 25.1% |
| 2-Person Household | 1,613 | 37.7% |
| 3-Person Household | 721 | 16.9% |
| 4+ Person Household | 870 | 20.3% |
| Total Housing Units | 4,277 | 100.0% |
Occupancy by Ownership by Household Size in Wanaque borough
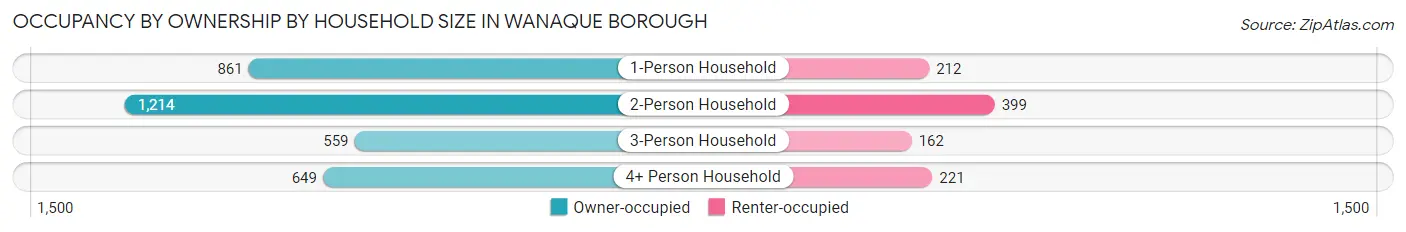
| Household Size | Owner-occupied | Renter-occupied |
| 1-Person Household | 861 (80.2%) | 212 (19.8%) |
| 2-Person Household | 1,214 (75.3%) | 399 (24.7%) |
| 3-Person Household | 559 (77.5%) | 162 (22.5%) |
| 4+ Person Household | 649 (74.6%) | 221 (25.4%) |
| Total Housing Units | 3,283 (76.8%) | 994 (23.2%) |
Occupancy by Educational Attainment in Wanaque borough
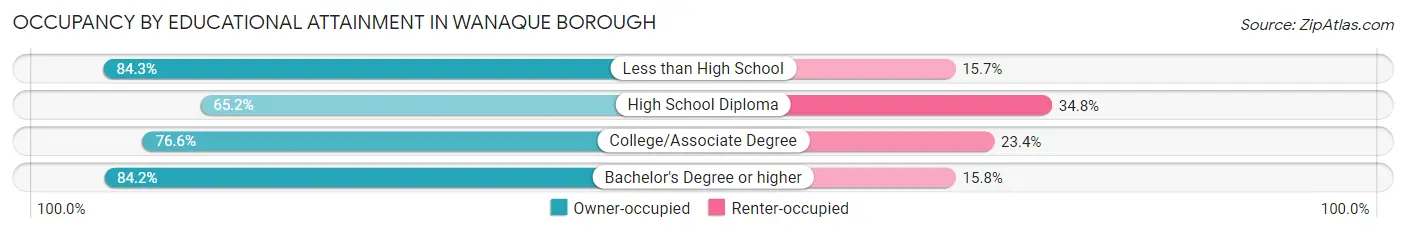
| Household Size | Owner-occupied | Renter-occupied |
| Less than High School | 183 (84.3%) | 34 (15.7%) |
| High School Diploma | 823 (65.2%) | 440 (34.8%) |
| College/Associate Degree | 796 (76.6%) | 243 (23.4%) |
| Bachelor's Degree or higher | 1,481 (84.2%) | 277 (15.8%) |
Occupancy by Age of Householder in Wanaque borough
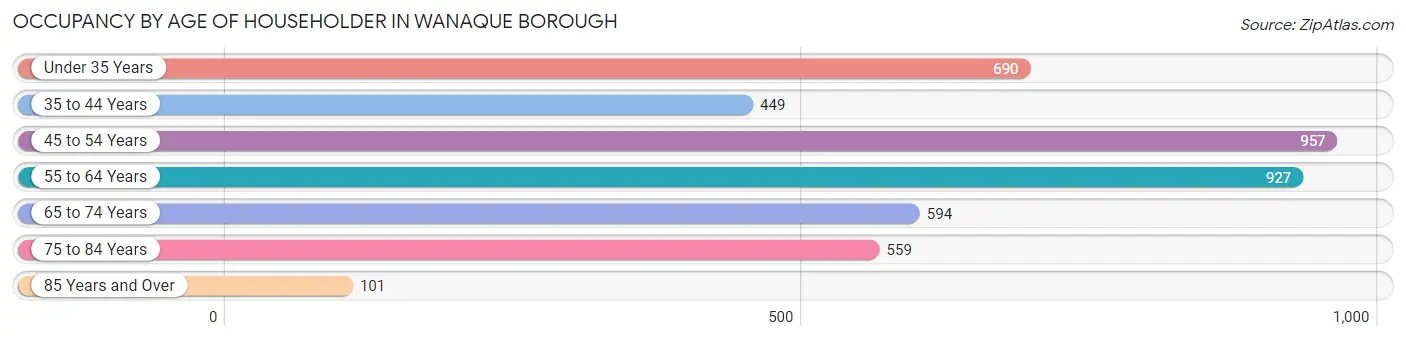
| Age Bracket | # Households | % Households |
| Under 35 Years | 690 | 16.1% |
| 35 to 44 Years | 449 | 10.5% |
| 45 to 54 Years | 957 | 22.4% |
| 55 to 64 Years | 927 | 21.7% |
| 65 to 74 Years | 594 | 13.9% |
| 75 to 84 Years | 559 | 13.1% |
| 85 Years and Over | 101 | 2.4% |
| Total | 4,277 | 100.0% |
Housing Finances in Wanaque borough
Median Income by Occupancy in Wanaque borough
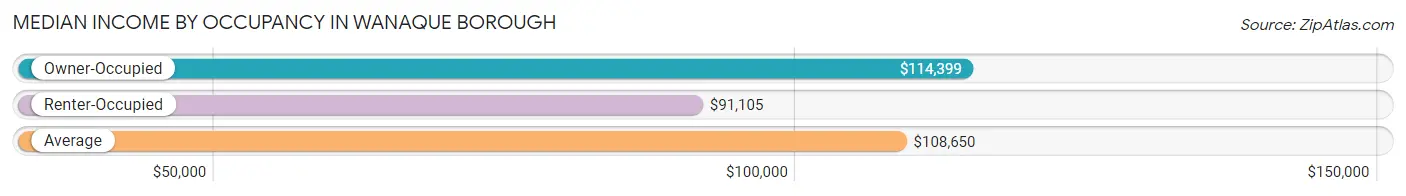
| Occupancy Type | # Households | Median Income |
| Owner-Occupied | 3,283 (76.8%) | $114,399 |
| Renter-Occupied | 994 (23.2%) | $91,105 |
| Average | 4,277 (100.0%) | $108,650 |
Occupancy by Householder Income Bracket in Wanaque borough
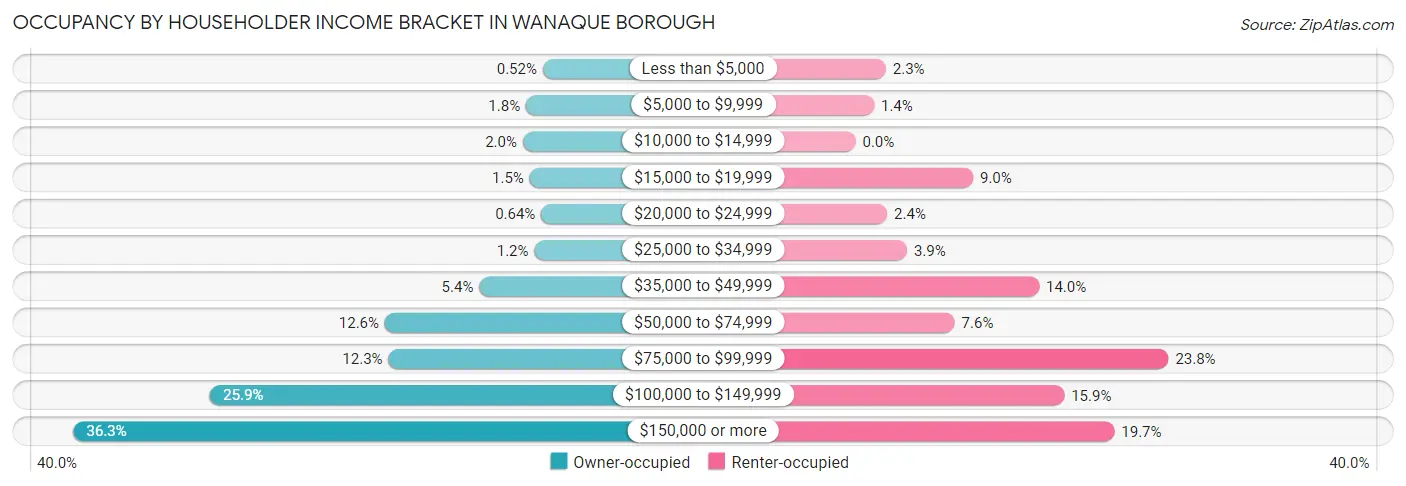
| Income Bracket | Owner-occupied | Renter-occupied |
| Less than $5,000 | 17 (0.5%) | 23 (2.3%) |
| $5,000 to $9,999 | 59 (1.8%) | 14 (1.4%) |
| $10,000 to $14,999 | 67 (2.0%) | 0 (0.0%) |
| $15,000 to $19,999 | 50 (1.5%) | 89 (8.9%) |
| $20,000 to $24,999 | 21 (0.6%) | 24 (2.4%) |
| $25,000 to $34,999 | 38 (1.2%) | 39 (3.9%) |
| $35,000 to $49,999 | 176 (5.4%) | 139 (14.0%) |
| $50,000 to $74,999 | 412 (12.6%) | 75 (7.5%) |
| $75,000 to $99,999 | 403 (12.3%) | 237 (23.8%) |
| $100,000 to $149,999 | 849 (25.9%) | 158 (15.9%) |
| $150,000 or more | 1,191 (36.3%) | 196 (19.7%) |
| Total | 3,283 (100.0%) | 994 (100.0%) |
Monthly Housing Cost Tiers in Wanaque borough
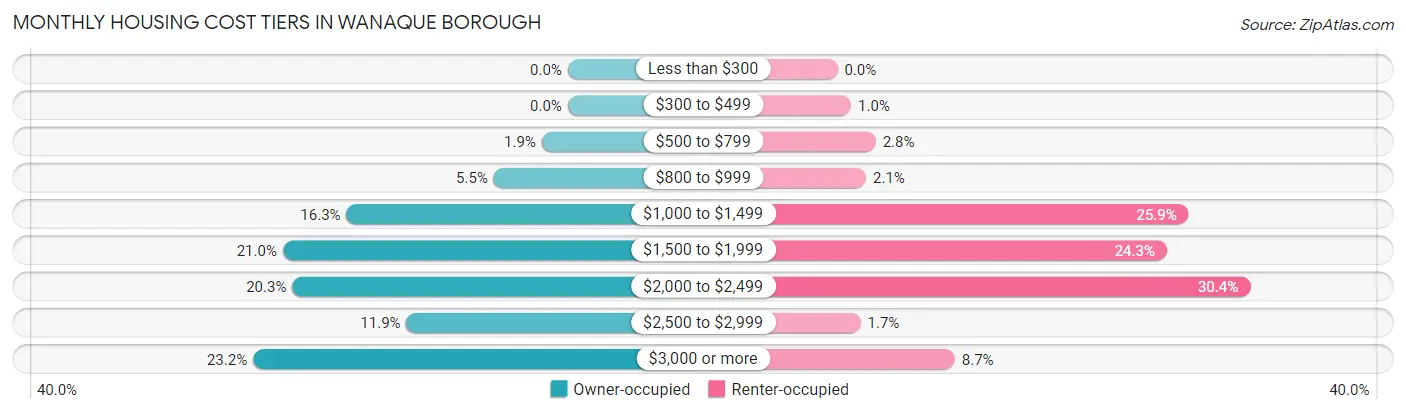
| Monthly Cost | Owner-occupied | Renter-occupied |
| Less than $300 | 0 (0.0%) | 0 (0.0%) |
| $300 to $499 | 0 (0.0%) | 10 (1.0%) |
| $500 to $799 | 63 (1.9%) | 28 (2.8%) |
| $800 to $999 | 179 (5.4%) | 21 (2.1%) |
| $1,000 to $1,499 | 535 (16.3%) | 257 (25.9%) |
| $1,500 to $1,999 | 689 (21.0%) | 241 (24.2%) |
| $2,000 to $2,499 | 666 (20.3%) | 302 (30.4%) |
| $2,500 to $2,999 | 390 (11.9%) | 17 (1.7%) |
| $3,000 or more | 761 (23.2%) | 86 (8.6%) |
| Total | 3,283 (100.0%) | 994 (100.0%) |
Physical Housing Characteristics in Wanaque borough
Housing Structures in Wanaque borough
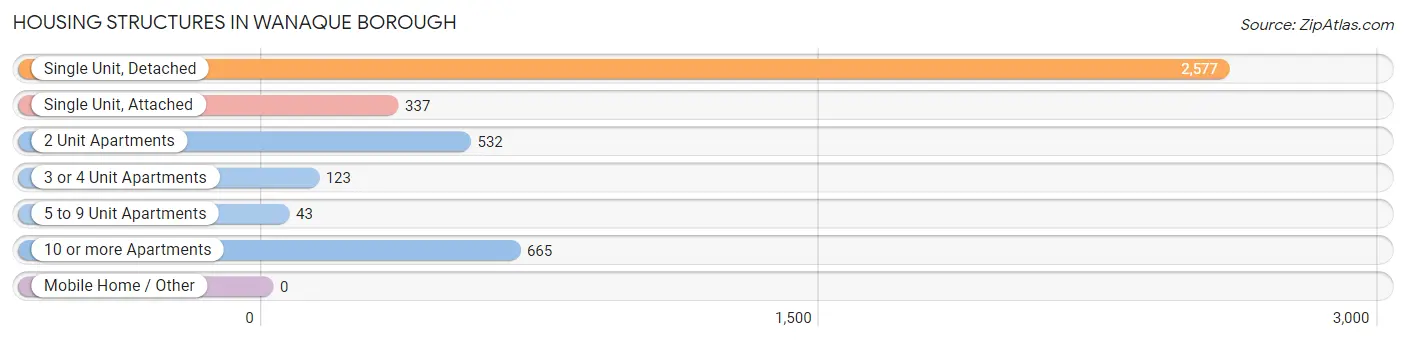
| Structure Type | # Housing Units | % Housing Units |
| Single Unit, Detached | 2,577 | 60.3% |
| Single Unit, Attached | 337 | 7.9% |
| 2 Unit Apartments | 532 | 12.4% |
| 3 or 4 Unit Apartments | 123 | 2.9% |
| 5 to 9 Unit Apartments | 43 | 1.0% |
| 10 or more Apartments | 665 | 15.5% |
| Mobile Home / Other | 0 | 0.0% |
| Total | 4,277 | 100.0% |
Housing Structures by Occupancy in Wanaque borough
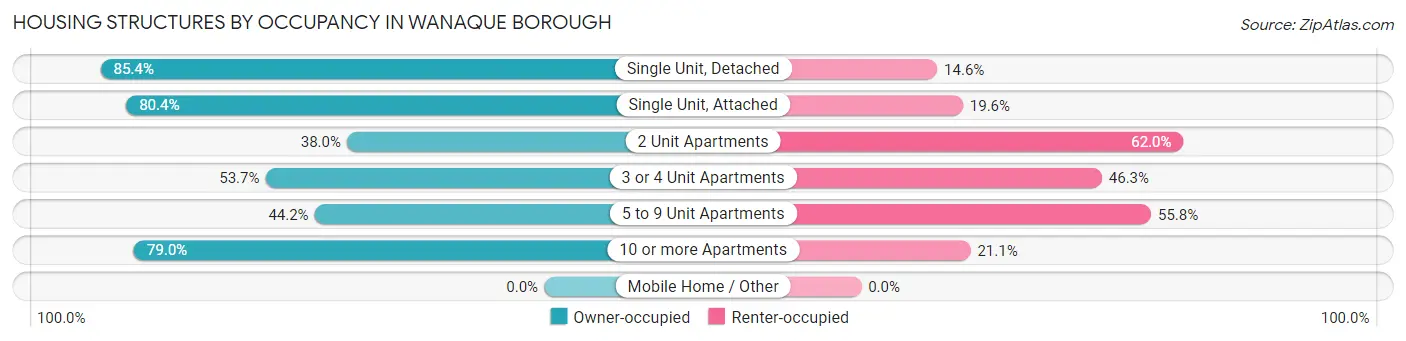
| Structure Type | Owner-occupied | Renter-occupied |
| Single Unit, Detached | 2,200 (85.4%) | 377 (14.6%) |
| Single Unit, Attached | 271 (80.4%) | 66 (19.6%) |
| 2 Unit Apartments | 202 (38.0%) | 330 (62.0%) |
| 3 or 4 Unit Apartments | 66 (53.7%) | 57 (46.3%) |
| 5 to 9 Unit Apartments | 19 (44.2%) | 24 (55.8%) |
| 10 or more Apartments | 525 (78.9%) | 140 (21.0%) |
| Mobile Home / Other | 0 (0.0%) | 0 (0.0%) |
| Total | 3,283 (76.8%) | 994 (23.2%) |
Housing Structures by Number of Rooms in Wanaque borough
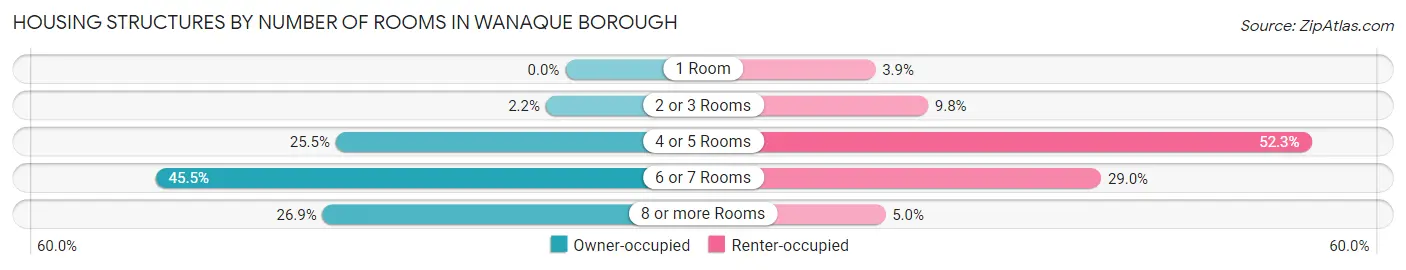
| Number of Rooms | Owner-occupied | Renter-occupied |
| 1 Room | 0 (0.0%) | 39 (3.9%) |
| 2 or 3 Rooms | 71 (2.2%) | 97 (9.8%) |
| 4 or 5 Rooms | 836 (25.5%) | 520 (52.3%) |
| 6 or 7 Rooms | 1,492 (45.5%) | 288 (29.0%) |
| 8 or more Rooms | 884 (26.9%) | 50 (5.0%) |
| Total | 3,283 (100.0%) | 994 (100.0%) |
Housing Structure by Heating Type in Wanaque borough
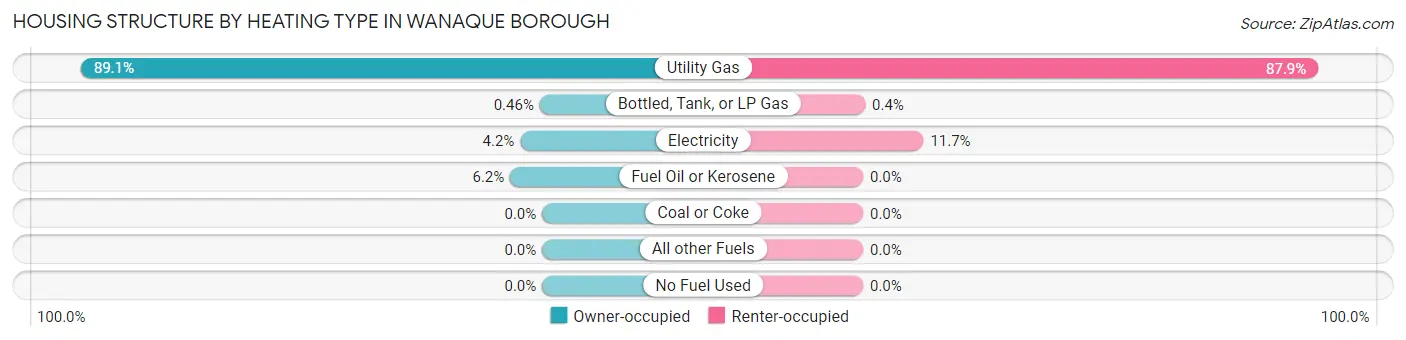
| Heating Type | Owner-occupied | Renter-occupied |
| Utility Gas | 2,926 (89.1%) | 874 (87.9%) |
| Bottled, Tank, or LP Gas | 15 (0.5%) | 4 (0.4%) |
| Electricity | 139 (4.2%) | 116 (11.7%) |
| Fuel Oil or Kerosene | 203 (6.2%) | 0 (0.0%) |
| Coal or Coke | 0 (0.0%) | 0 (0.0%) |
| All other Fuels | 0 (0.0%) | 0 (0.0%) |
| No Fuel Used | 0 (0.0%) | 0 (0.0%) |
| Total | 3,283 (100.0%) | 994 (100.0%) |
Household Vehicle Usage in Wanaque borough
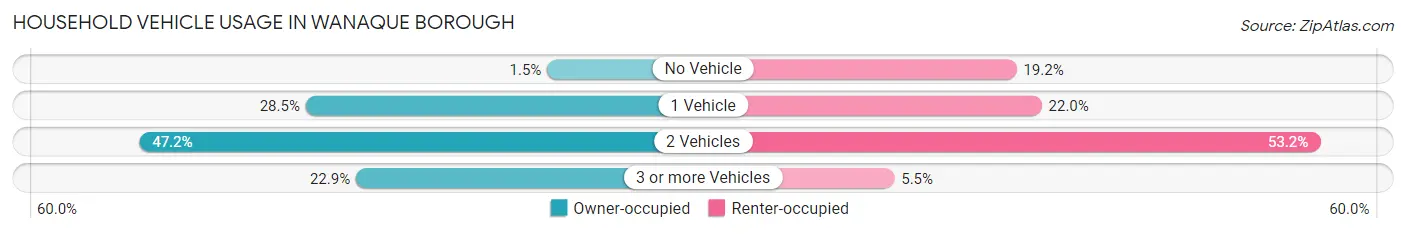
| Vehicles per Household | Owner-occupied | Renter-occupied |
| No Vehicle | 48 (1.5%) | 191 (19.2%) |
| 1 Vehicle | 936 (28.5%) | 219 (22.0%) |
| 2 Vehicles | 1,548 (47.1%) | 529 (53.2%) |
| 3 or more Vehicles | 751 (22.9%) | 55 (5.5%) |
| Total | 3,283 (100.0%) | 994 (100.0%) |
Real Estate & Mortgages in Wanaque borough
Real Estate and Mortgage Overview in Wanaque borough
| Characteristic | Without Mortgage | With Mortgage |
| Housing Units | 1,122 | 2,161 |
| Median Property Value | $342,100 | $353,300 |
| Median Household Income | $96,250 | $873 |
| Monthly Housing Costs | $1,393 | $745 |
| Real Estate Taxes | $10,001 | $29 |
Property Value by Mortgage Status in Wanaque borough
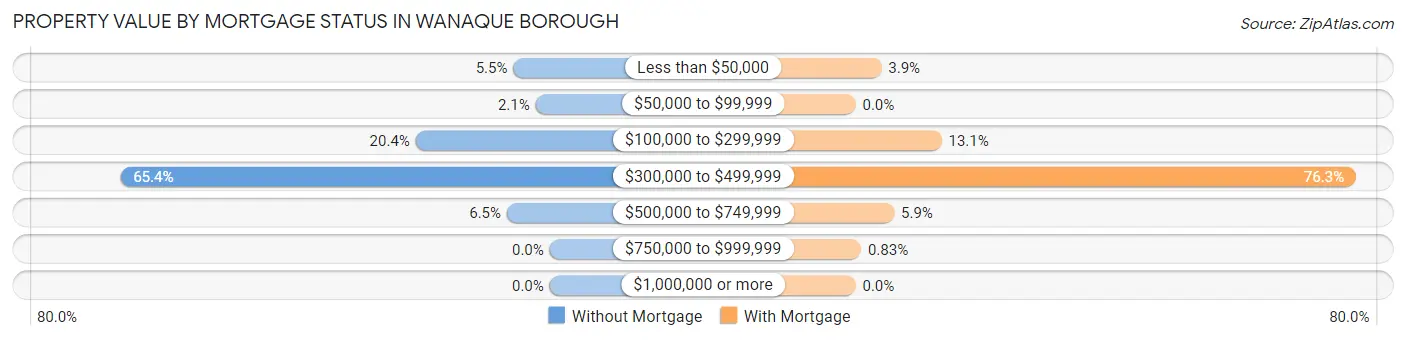
| Property Value | Without Mortgage | With Mortgage |
| Less than $50,000 | 62 (5.5%) | 85 (3.9%) |
| $50,000 to $99,999 | 24 (2.1%) | 0 (0.0%) |
| $100,000 to $299,999 | 229 (20.4%) | 283 (13.1%) |
| $300,000 to $499,999 | 734 (65.4%) | 1,648 (76.3%) |
| $500,000 to $749,999 | 73 (6.5%) | 127 (5.9%) |
| $750,000 to $999,999 | 0 (0.0%) | 18 (0.8%) |
| $1,000,000 or more | 0 (0.0%) | 0 (0.0%) |
| Total | 1,122 (100.0%) | 2,161 (100.0%) |
Household Income by Mortgage Status in Wanaque borough
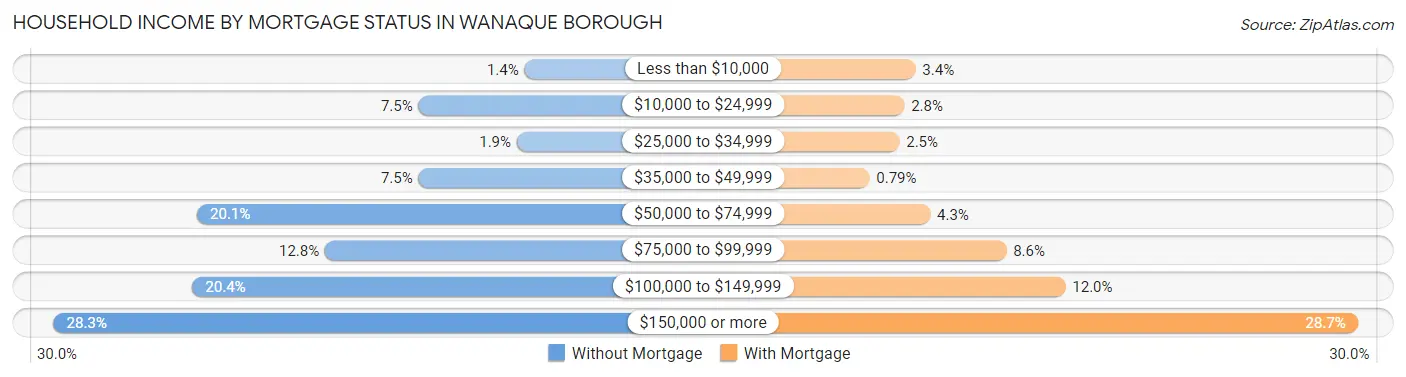
| Household Income | Without Mortgage | With Mortgage |
| Less than $10,000 | 16 (1.4%) | 74 (3.4%) |
| $10,000 to $24,999 | 84 (7.5%) | 60 (2.8%) |
| $25,000 to $34,999 | 21 (1.9%) | 54 (2.5%) |
| $35,000 to $49,999 | 84 (7.5%) | 17 (0.8%) |
| $50,000 to $74,999 | 226 (20.1%) | 92 (4.3%) |
| $75,000 to $99,999 | 144 (12.8%) | 186 (8.6%) |
| $100,000 to $149,999 | 229 (20.4%) | 259 (12.0%) |
| $150,000 or more | 318 (28.3%) | 620 (28.7%) |
| Total | 1,122 (100.0%) | 2,161 (100.0%) |
Property Value to Household Income Ratio in Wanaque borough
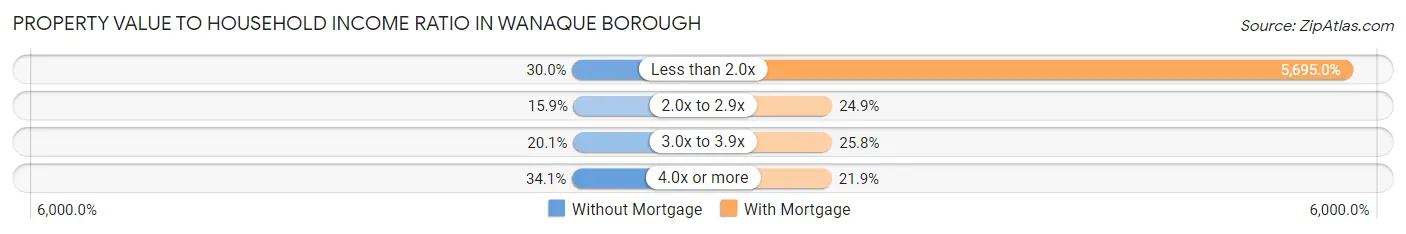
| Value-to-Income Ratio | Without Mortgage | With Mortgage |
| Less than 2.0x | 337 (30.0%) | 123,068 (5,695.0%) |
| 2.0x to 2.9x | 178 (15.9%) | 537 (24.8%) |
| 3.0x to 3.9x | 225 (20.1%) | 558 (25.8%) |
| 4.0x or more | 382 (34.1%) | 473 (21.9%) |
| Total | 1,122 (100.0%) | 2,161 (100.0%) |
Real Estate Taxes by Mortgage Status in Wanaque borough
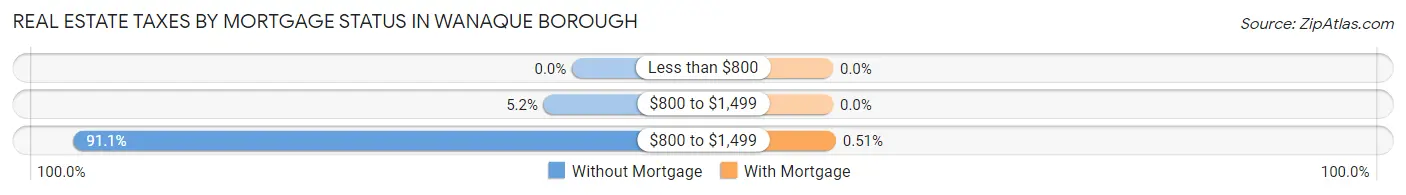
| Property Taxes | Without Mortgage | With Mortgage |
| Less than $800 | 0 (0.0%) | 0 (0.0%) |
| $800 to $1,499 | 58 (5.2%) | 0 (0.0%) |
| $800 to $1,499 | 1,022 (91.1%) | 11 (0.5%) |
| Total | 1,122 (100.0%) | 2,161 (100.0%) |
Health & Disability in Wanaque borough
Health Insurance Coverage by Age in Wanaque borough
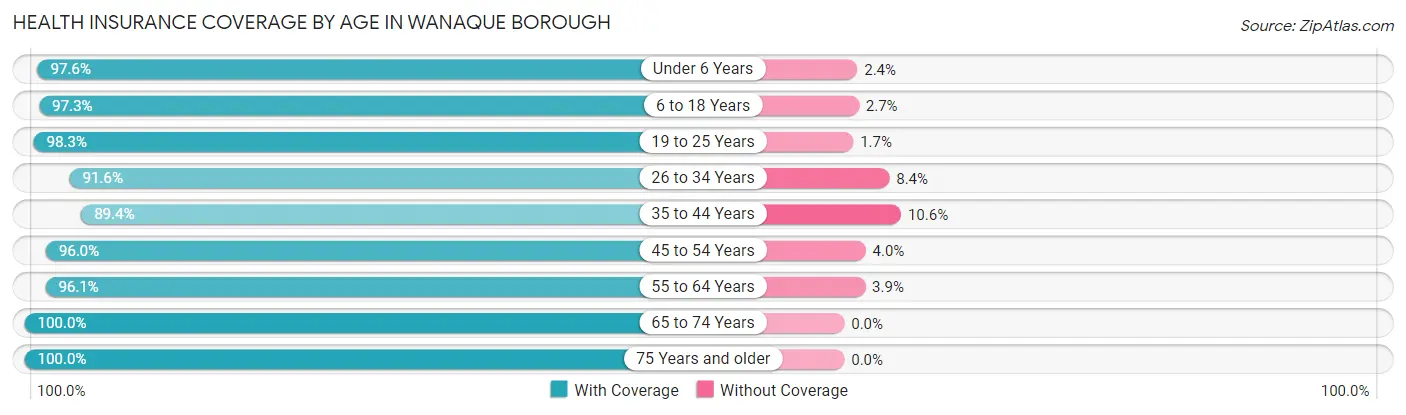
| Age Bracket | With Coverage | Without Coverage |
| Under 6 Years | 645 (97.6%) | 16 (2.4%) |
| 6 to 18 Years | 1,181 (97.3%) | 33 (2.7%) |
| 19 to 25 Years | 940 (98.3%) | 16 (1.7%) |
| 26 to 34 Years | 1,496 (91.6%) | 137 (8.4%) |
| 35 to 44 Years | 812 (89.4%) | 96 (10.6%) |
| 45 to 54 Years | 1,620 (96.0%) | 67 (4.0%) |
| 55 to 64 Years | 1,583 (96.1%) | 64 (3.9%) |
| 65 to 74 Years | 1,097 (100.0%) | 0 (0.0%) |
| 75 Years and older | 1,127 (100.0%) | 0 (0.0%) |
| Total | 10,501 (96.1%) | 429 (3.9%) |
Health Insurance Coverage by Citizenship Status in Wanaque borough
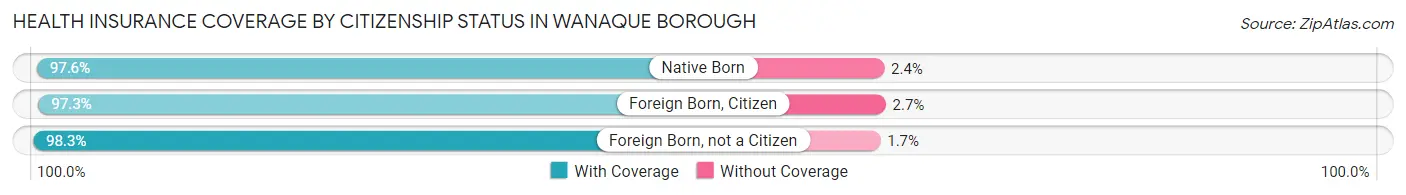
| Citizenship Status | With Coverage | Without Coverage |
| Native Born | 645 (97.6%) | 16 (2.4%) |
| Foreign Born, Citizen | 1,181 (97.3%) | 33 (2.7%) |
| Foreign Born, not a Citizen | 940 (98.3%) | 16 (1.7%) |
Health Insurance Coverage by Household Income in Wanaque borough
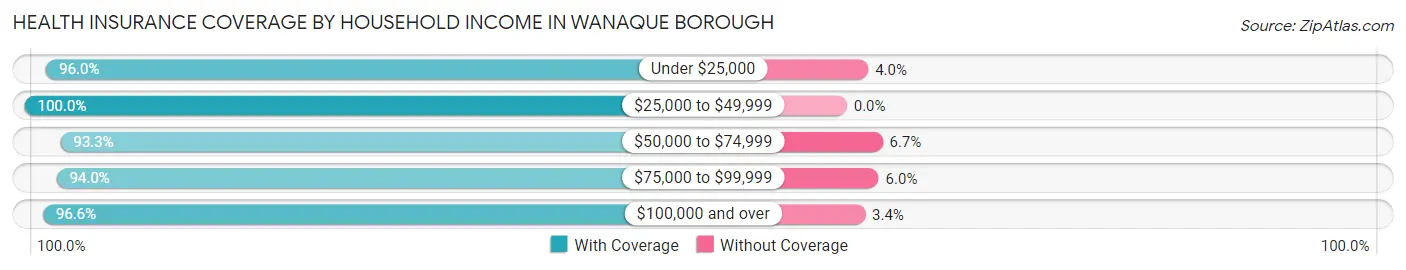
| Household Income | With Coverage | Without Coverage |
| Under $25,000 | 573 (96.0%) | 24 (4.0%) |
| $25,000 to $49,999 | 634 (100.0%) | 0 (0.0%) |
| $50,000 to $74,999 | 878 (93.3%) | 63 (6.7%) |
| $75,000 to $99,999 | 1,592 (94.0%) | 101 (6.0%) |
| $100,000 and over | 6,719 (96.6%) | 239 (3.4%) |
Public vs Private Health Insurance Coverage by Age in Wanaque borough
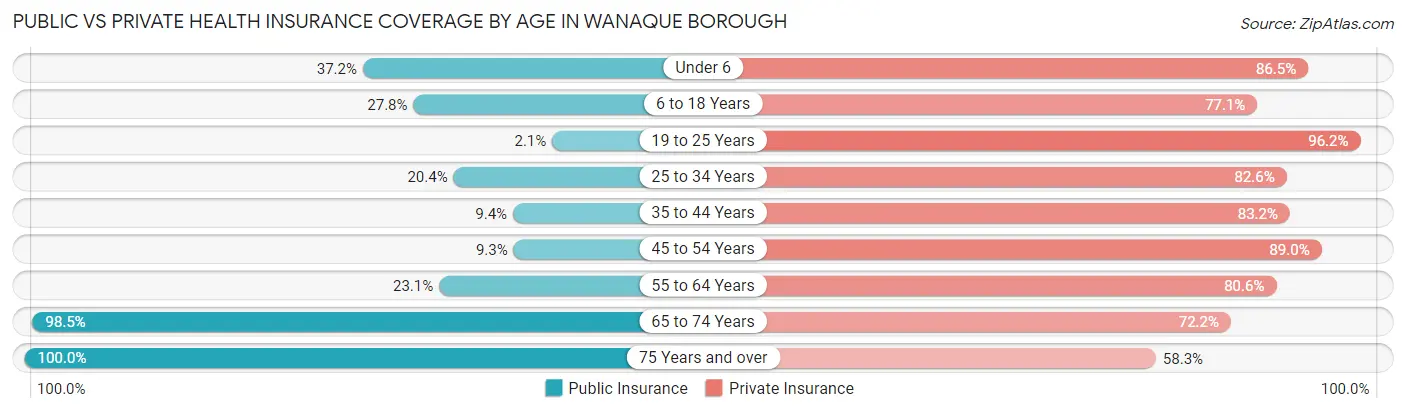
| Age Bracket | Public Insurance | Private Insurance |
| Under 6 | 246 (37.2%) | 572 (86.5%) |
| 6 to 18 Years | 338 (27.8%) | 936 (77.1%) |
| 19 to 25 Years | 20 (2.1%) | 920 (96.2%) |
| 25 to 34 Years | 333 (20.4%) | 1,348 (82.6%) |
| 35 to 44 Years | 85 (9.4%) | 755 (83.2%) |
| 45 to 54 Years | 156 (9.2%) | 1,502 (89.0%) |
| 55 to 64 Years | 380 (23.1%) | 1,328 (80.6%) |
| 65 to 74 Years | 1,081 (98.5%) | 792 (72.2%) |
| 75 Years and over | 1,127 (100.0%) | 657 (58.3%) |
| Total | 3,766 (34.5%) | 8,810 (80.6%) |
Disability Status by Sex by Age in Wanaque borough
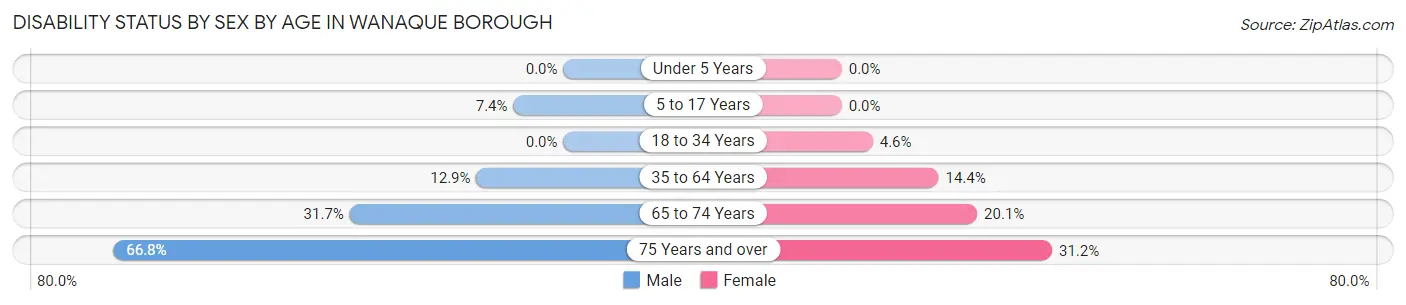
| Age Bracket | Male | Female |
| Under 5 Years | 0 (0.0%) | 0 (0.0%) |
| 5 to 17 Years | 61 (7.4%) | 0 (0.0%) |
| 18 to 34 Years | 0 (0.0%) | 48 (4.6%) |
| 35 to 64 Years | 274 (12.9%) | 305 (14.4%) |
| 65 to 74 Years | 165 (31.7%) | 116 (20.1%) |
| 75 Years and over | 310 (66.8%) | 207 (31.2%) |
Disability Class by Sex by Age in Wanaque borough
Disability Class: Hearing Difficulty
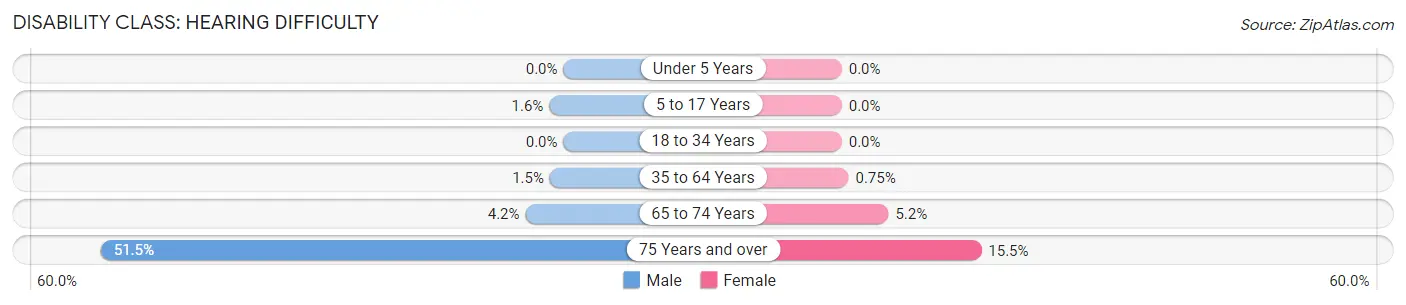
| Age Bracket | Male | Female |
| Under 5 Years | 0 (0.0%) | 0 (0.0%) |
| 5 to 17 Years | 13 (1.6%) | 0 (0.0%) |
| 18 to 34 Years | 0 (0.0%) | 0 (0.0%) |
| 35 to 64 Years | 32 (1.5%) | 16 (0.7%) |
| 65 to 74 Years | 22 (4.2%) | 30 (5.2%) |
| 75 Years and over | 239 (51.5%) | 103 (15.5%) |
Disability Class: Vision Difficulty
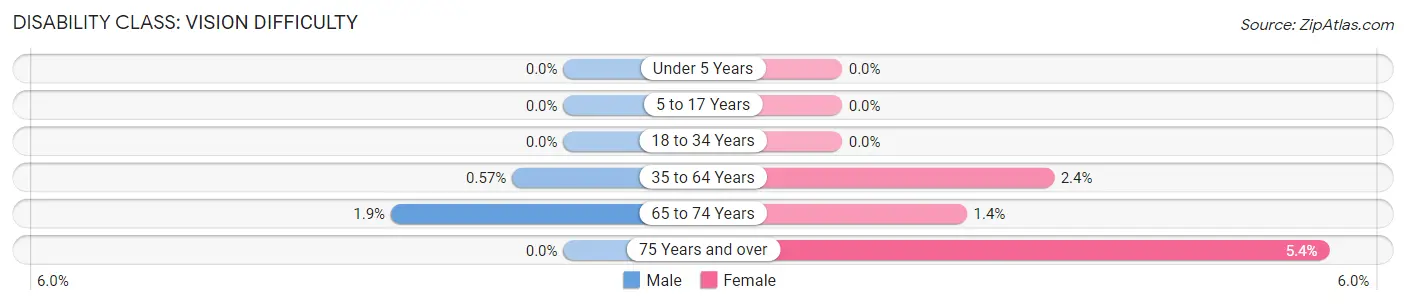
| Age Bracket | Male | Female |
| Under 5 Years | 0 (0.0%) | 0 (0.0%) |
| 5 to 17 Years | 0 (0.0%) | 0 (0.0%) |
| 18 to 34 Years | 0 (0.0%) | 0 (0.0%) |
| 35 to 64 Years | 12 (0.6%) | 50 (2.4%) |
| 65 to 74 Years | 10 (1.9%) | 8 (1.4%) |
| 75 Years and over | 0 (0.0%) | 36 (5.4%) |
Disability Class: Cognitive Difficulty
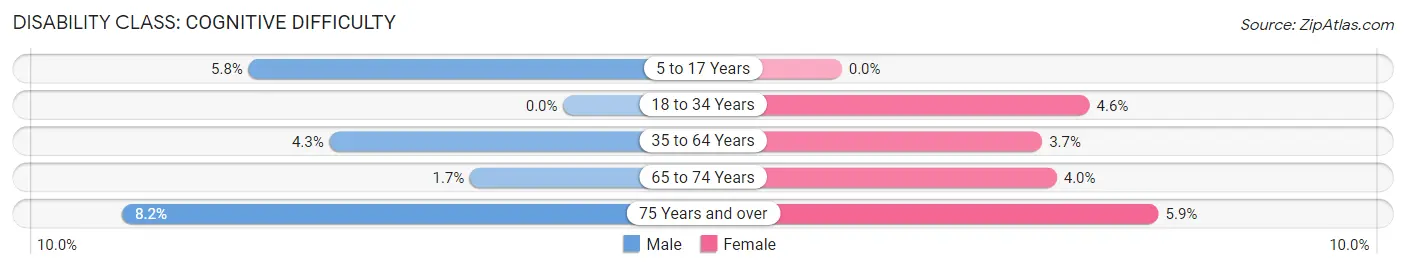
| Age Bracket | Male | Female |
| 5 to 17 Years | 48 (5.8%) | 0 (0.0%) |
| 18 to 34 Years | 0 (0.0%) | 48 (4.6%) |
| 35 to 64 Years | 92 (4.3%) | 79 (3.7%) |
| 65 to 74 Years | 9 (1.7%) | 23 (4.0%) |
| 75 Years and over | 38 (8.2%) | 39 (5.9%) |
Disability Class: Ambulatory Difficulty
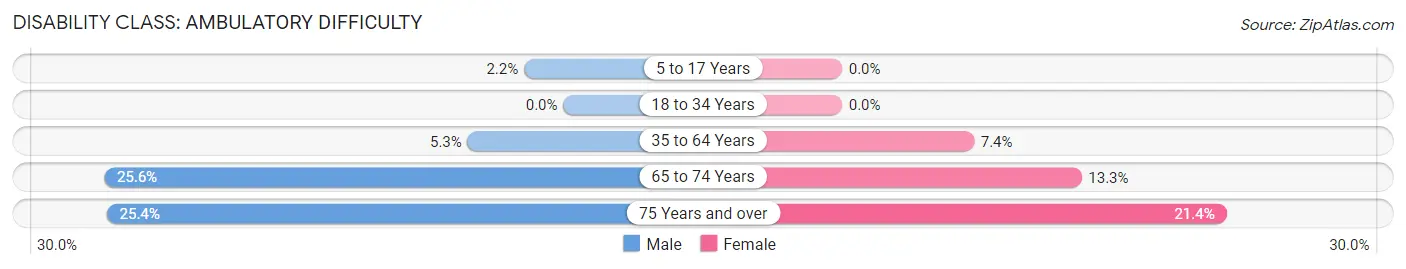
| Age Bracket | Male | Female |
| 5 to 17 Years | 18 (2.2%) | 0 (0.0%) |
| 18 to 34 Years | 0 (0.0%) | 0 (0.0%) |
| 35 to 64 Years | 113 (5.3%) | 156 (7.3%) |
| 65 to 74 Years | 133 (25.6%) | 77 (13.3%) |
| 75 Years and over | 118 (25.4%) | 142 (21.4%) |
Disability Class: Self-Care Difficulty
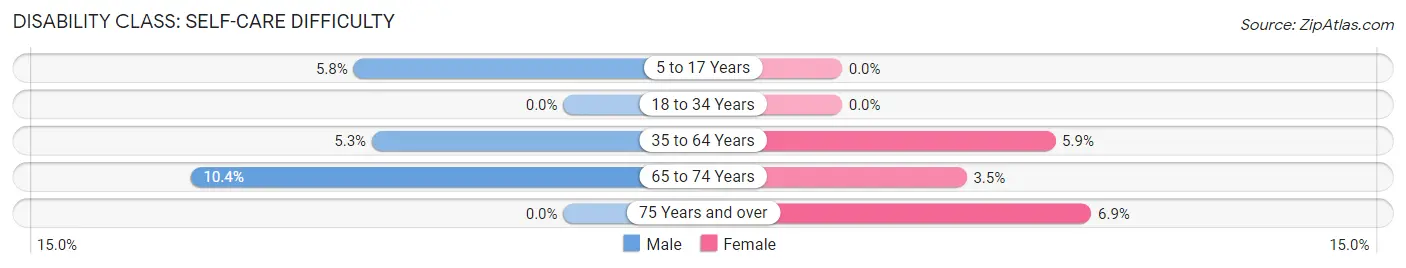
| Age Bracket | Male | Female |
| 5 to 17 Years | 48 (5.8%) | 0 (0.0%) |
| 18 to 34 Years | 0 (0.0%) | 0 (0.0%) |
| 35 to 64 Years | 113 (5.3%) | 126 (5.9%) |
| 65 to 74 Years | 54 (10.4%) | 20 (3.5%) |
| 75 Years and over | 0 (0.0%) | 46 (6.9%) |
Technology Access in Wanaque borough
Computing Device Access in Wanaque borough
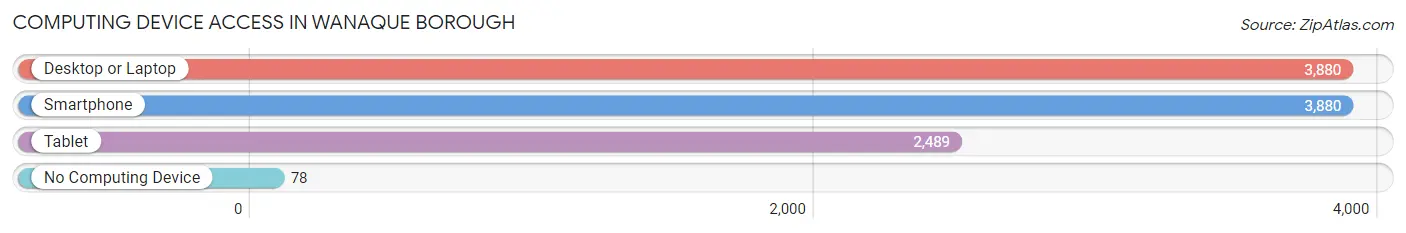
| Device Type | # Households | % Households |
| Desktop or Laptop | 3,880 | 90.7% |
| Smartphone | 3,880 | 90.7% |
| Tablet | 2,489 | 58.2% |
| No Computing Device | 78 | 1.8% |
| Total | 4,277 | 100.0% |
Internet Access in Wanaque borough
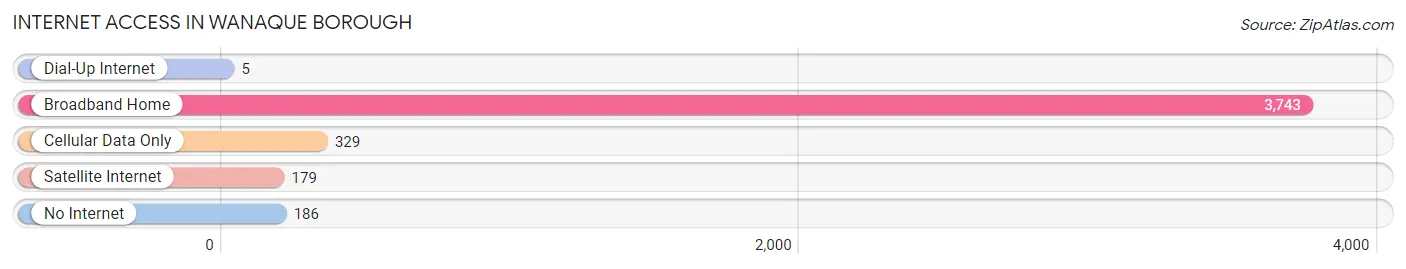
| Internet Type | # Households | % Households |
| Dial-Up Internet | 5 | 0.1% |
| Broadband Home | 3,743 | 87.5% |
| Cellular Data Only | 329 | 7.7% |
| Satellite Internet | 179 | 4.2% |
| No Internet | 186 | 4.3% |
| Total | 4,277 | 100.0% |
Wanaque borough Summary
Wanaque Borough is a small borough located in Passaic County, New Jersey. It is situated in the Ramapo Mountains and is part of the New York metropolitan area. The borough is bordered by the towns of Ringwood, Bloomingdale, and Pompton Lakes. As of the 2010 United States Census, the borough had a total population of 11,116.
Geography
Wanaque Borough is located at 40°59'N 74°17'W (40.983, -74.283). According to the United States Census Bureau, the borough has a total area of 4.3 square miles (11.2 km2), all of which is land.
The borough is located in the Ramapo Mountains, which are part of the Appalachian Mountains. The borough is located in the Passaic River watershed. The borough is located in the northern part of Passaic County, and is bordered by the towns of Ringwood, Bloomingdale, and Pompton Lakes.
Demographics
As of the 2010 United States Census, there were 11,116 people, 3,945 households, and 2,845 families residing in the borough. The population density was 2,569.2 people per square mile (991.2/km2). There were 4,093 housing units at an average density of 951.2 per square mile (367.3/km2). The racial makeup of the borough was 81.2% White, 5.2% African American, 0.2% Native American, 8.2% Asian, 0.0% Pacific Islander, 3.2% from other races, and 2.2% from two or more races. Hispanic or Latino of any race were 11.7% of the population.
There were 3,945 households, out of which 33.2% had children under the age of 18 living with them, 56.2% were married couples living together, 11.3% had a female householder with no husband present, and 27.2% were non-families. 22.2% of all households were made up of individuals, and 9.2% had someone living alone who was 65 years of age or older. The average household size was 2.81 and the average family size was 3.30.
In the borough, the population was spread out, with 23.2% under the age of 18, 7.3% from 18 to 24, 29.2% from 25 to 44, 26.2% from 45 to 64, and 14.1% who were 65 years of age or older. The median age was 38.7 years. For every 100 females, there were 94.3 males. For every 100 females ages 18 and older there were 91.2 males.
The median income for a household in the borough was $76,945, and the median income for a family was $86,945. Males had a median income of $60,945 versus $45,945 for females. The per capita income for the borough was $30,945. About 2.2% of families and 3.2% of the population were below the poverty line, including 3.2% of those under age 18 and 4.2% of those age 65 or over.
Economy
The economy of Wanaque Borough is largely based on the service industry. The borough is home to a variety of restaurants, retail stores, and other businesses. The borough also has a number of manufacturing and industrial businesses, including a paper mill and a plastics factory.
The borough is also home to a number of parks and recreational facilities, including Wanaque Reservoir, which is a popular destination for fishing, boating, and other outdoor activities.
Conclusion
Wanaque Borough is a small borough located in Passaic County, New Jersey. It is situated in the Ramapo Mountains and is part of the New York metropolitan area. The borough has a total population of 11,116, as of the 2010 United States Census. The economy of Wanaque Borough is largely based on the service industry, with a variety of restaurants, retail stores, and other businesses. The borough also has a number of manufacturing and industrial businesses, as well as a number of parks and recreational facilities.
Common Questions
What is Per Capita Income in Wanaque borough?
Per Capita income in Wanaque borough is $47,518.
What is the Median Family Income in Wanaque borough?
Median Family Income in Wanaque borough is $124,239.
What is the Median Household income in Wanaque borough?
Median Household Income in Wanaque borough is $108,650.
What is Income or Wage Gap in Wanaque borough?
Income or Wage Gap in Wanaque borough is 15.3%.
Women in Wanaque borough earn 84.7 cents for every dollar earned by a man.
What is Family Income Deficit in Wanaque borough?
Family Income Deficit in Wanaque borough is $9,143.
Families that are below poverty line in Wanaque borough earn $9,143 less on average than the poverty threshold level.
What is Inequality or Gini Index in Wanaque borough?
Inequality or Gini Index in Wanaque borough is 0.34.
What is the Total Population of Wanaque borough?
Total Population of Wanaque borough is 11,217.
What is the Total Male Population of Wanaque borough?
Total Male Population of Wanaque borough is 5,861.
What is the Total Female Population of Wanaque borough?
Total Female Population of Wanaque borough is 5,356.
What is the Ratio of Males per 100 Females in Wanaque borough?
There are 109.43 Males per 100 Females in Wanaque borough.
What is the Ratio of Females per 100 Males in Wanaque borough?
There are 91.38 Females per 100 Males in Wanaque borough.
What is the Median Population Age in Wanaque borough?
Median Population Age in Wanaque borough is 47.3 Years.
What is the Average Family Size in Wanaque borough
Average Family Size in Wanaque borough is 3.1 People.
What is the Average Household Size in Wanaque borough
Average Household Size in Wanaque borough is 2.5 People.
How Large is the Labor Force in Wanaque borough?
There are 6,307 People in the Labor Forcein in Wanaque borough.
What is the Percentage of People in the Labor Force in Wanaque borough?
66.4% of People are in the Labor Force in Wanaque borough.
What is the Unemployment Rate in Wanaque borough?
Unemployment Rate in Wanaque borough is 4.2%.