Audubon borough, NJ Map & Demographics
Audubon borough Overview
$45,562
PER CAPITA INCOME
$117,336
AVG FAMILY INCOME
$103,379
AVG HOUSEHOLD INCOME
18.4%
WAGE / INCOME GAP [ % ]
81.6¢/ $1
WAGE / INCOME GAP [ $ ]
0.38
INEQUALITY / GINI INDEX
8,695
TOTAL POPULATION
4,189
MALE POPULATION
4,506
FEMALE POPULATION
92.96
MALES / 100 FEMALES
107.57
FEMALES / 100 MALES
38.0
MEDIAN AGE
3.2
AVG FAMILY SIZE
2.6
AVG HOUSEHOLD SIZE
4,990
LABOR FORCE [ PEOPLE ]
72.8%
PERCENT IN LABOR FORCE
5.0%
UNEMPLOYMENT RATE
Income in Audubon borough
Income Overview in Audubon borough
Per Capita Income in Audubon borough is $45,562, while median incomes of families and households are $117,336 and $103,379 respectively.
| Characteristic | Number | Measure |
| Per Capita Income | 8,695 | $45,562 |
| Median Family Income | 2,134 | $117,336 |
| Mean Family Income | 2,134 | $133,894 |
| Median Household Income | 3,329 | $103,379 |
| Mean Household Income | 3,329 | $117,312 |
| Income Deficit | 2,134 | $0 |
| Wage / Income Gap (%) | 8,695 | 18.38% |
| Wage / Income Gap ($) | 8,695 | 81.62¢ per $1 |
| Gini / Inequality Index | 8,695 | 0.38 |
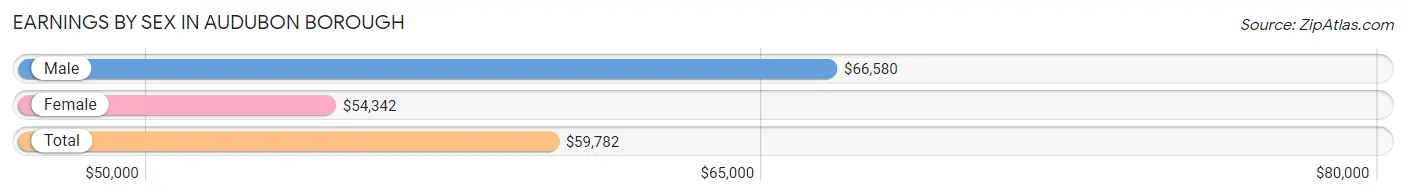
Earnings by Sex in Audubon borough
Average Earnings in Audubon borough are $59,782, $66,580 for men and $54,342 for women, a difference of 18.4%.
| Sex | Number | Average Earnings |
| Male | 2,597 (50.7%) | $66,580 |
| Female | 2,528 (49.3%) | $54,342 |
| Total | 5,125 (100.0%) | $59,782 |
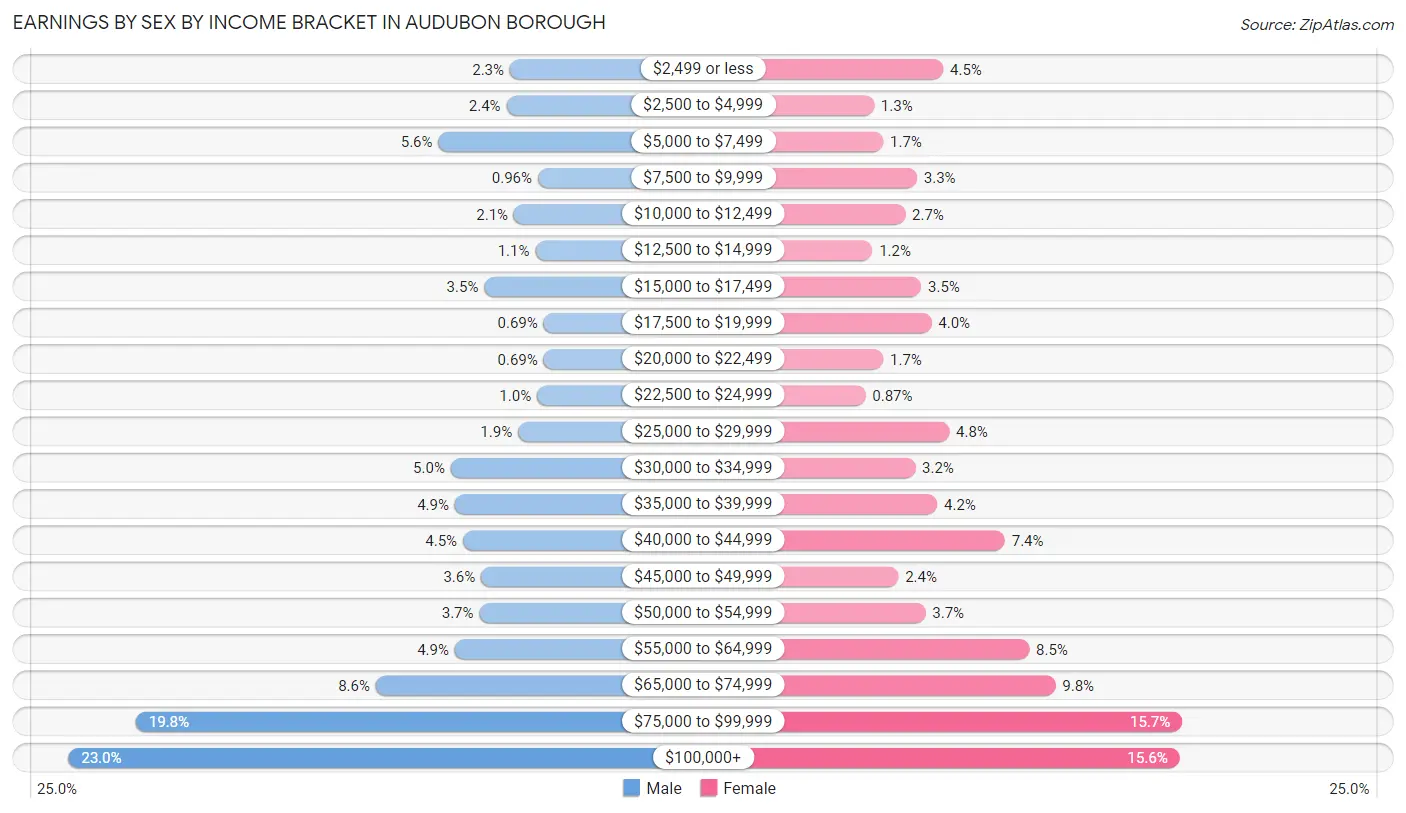
Earnings by Sex by Income Bracket in Audubon borough
The most common earnings brackets in Audubon borough are $100,000+ for men (596 | 23.0%) and $75,000 to $99,999 for women (397 | 15.7%).
| Income | Male | Female |
| $2,499 or less | 59 (2.3%) | 114 (4.5%) |
| $2,500 to $4,999 | 63 (2.4%) | 32 (1.3%) |
| $5,000 to $7,499 | 146 (5.6%) | 43 (1.7%) |
| $7,500 to $9,999 | 25 (1.0%) | 83 (3.3%) |
| $10,000 to $12,499 | 54 (2.1%) | 69 (2.7%) |
| $12,500 to $14,999 | 28 (1.1%) | 30 (1.2%) |
| $15,000 to $17,499 | 90 (3.5%) | 88 (3.5%) |
| $17,500 to $19,999 | 18 (0.7%) | 100 (4.0%) |
| $20,000 to $22,499 | 18 (0.7%) | 43 (1.7%) |
| $22,500 to $24,999 | 26 (1.0%) | 22 (0.9%) |
| $25,000 to $29,999 | 49 (1.9%) | 121 (4.8%) |
| $30,000 to $34,999 | 131 (5.0%) | 81 (3.2%) |
| $35,000 to $39,999 | 126 (4.9%) | 107 (4.2%) |
| $40,000 to $44,999 | 116 (4.5%) | 187 (7.4%) |
| $45,000 to $49,999 | 94 (3.6%) | 61 (2.4%) |
| $50,000 to $54,999 | 96 (3.7%) | 93 (3.7%) |
| $55,000 to $64,999 | 126 (4.9%) | 216 (8.5%) |
| $65,000 to $74,999 | 222 (8.6%) | 247 (9.8%) |
| $75,000 to $99,999 | 514 (19.8%) | 397 (15.7%) |
| $100,000+ | 596 (23.0%) | 394 (15.6%) |
| Total | 2,597 (100.0%) | 2,528 (100.0%) |
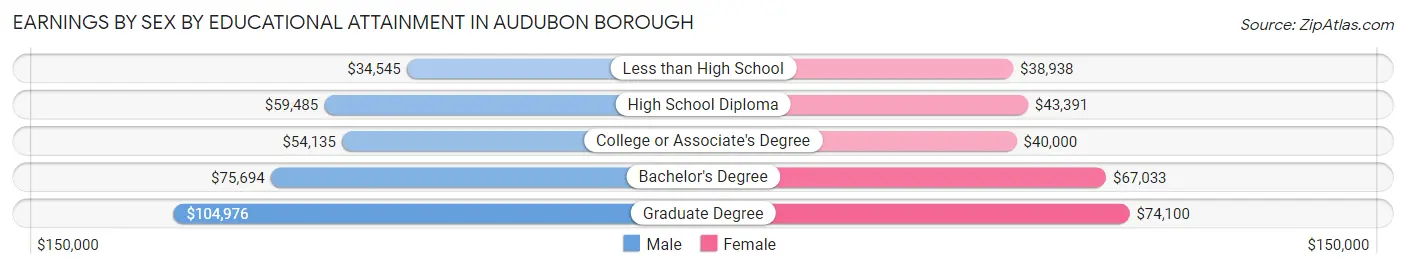
Earnings by Sex by Educational Attainment in Audubon borough
Average earnings in Audubon borough are $71,793 for men and $61,593 for women, a difference of 14.2%. Men with an educational attainment of graduate degree enjoy the highest average annual earnings of $104,976, while those with less than high school education earn the least with $34,545. Women with an educational attainment of graduate degree earn the most with the average annual earnings of $74,100, while those with less than high school education have the smallest earnings of $38,938.
| Educational Attainment | Male Income | Female Income |
| Less than High School | $34,545 | $38,938 |
| High School Diploma | $59,485 | $43,391 |
| College or Associate's Degree | $54,135 | $40,000 |
| Bachelor's Degree | $75,694 | $67,033 |
| Graduate Degree | $104,976 | $74,100 |
| Total | $71,793 | $61,593 |
Family Income in Audubon borough
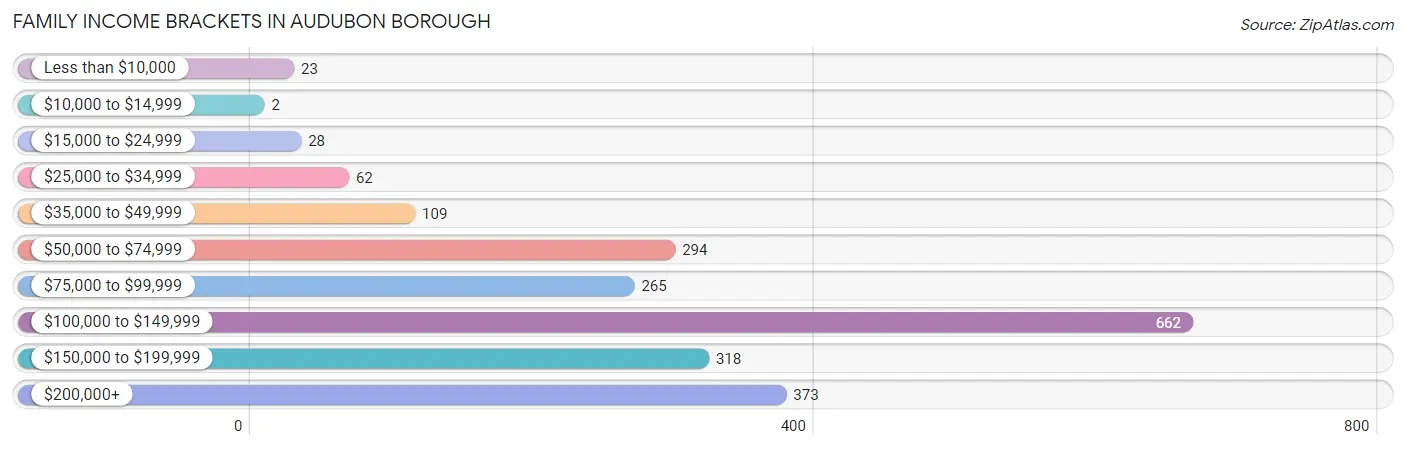
Family Income Brackets in Audubon borough
According to the Audubon borough family income data, there are 662 families falling into the $100,000 to $149,999 income range, which is the most common income bracket and makes up 31.0% of all families. Conversely, the $10,000 to $14,999 income bracket is the least frequent group with only 2 families (0.1%) belonging to this category.
| Income Bracket | # Families | % Families |
| Less than $10,000 | 23 | 1.1% |
| $10,000 to $14,999 | 2 | 0.1% |
| $15,000 to $24,999 | 28 | 1.3% |
| $25,000 to $34,999 | 62 | 2.9% |
| $35,000 to $49,999 | 109 | 5.1% |
| $50,000 to $74,999 | 294 | 13.8% |
| $75,000 to $99,999 | 265 | 12.4% |
| $100,000 to $149,999 | 662 | 31.0% |
| $150,000 to $199,999 | 318 | 14.9% |
| $200,000+ | 373 | 17.5% |
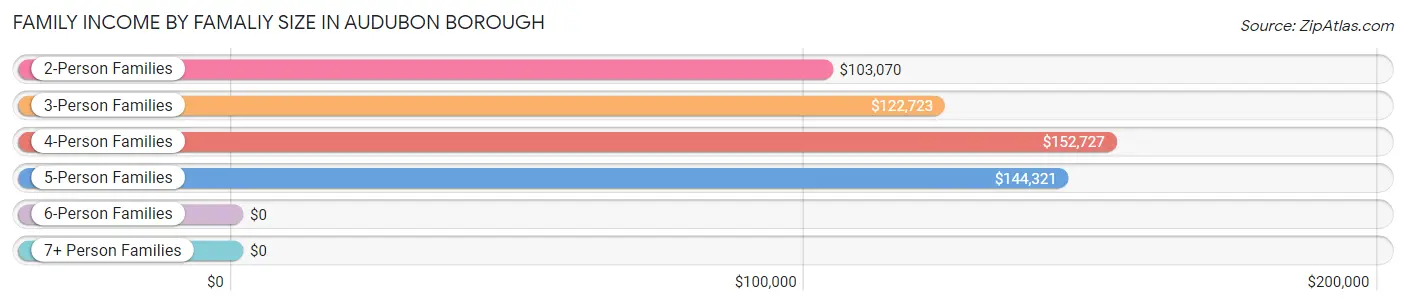
Family Income by Famaliy Size in Audubon borough
4-person families (562 | 26.3%) account for the highest median family income in Audubon borough with $152,727 per family, while 2-person families (851 | 39.9%) have the highest median income of $51,535 per family member.
| Income Bracket | # Families | Median Income |
| 2-Person Families | 851 (39.9%) | $103,070 |
| 3-Person Families | 469 (22.0%) | $122,723 |
| 4-Person Families | 562 (26.3%) | $152,727 |
| 5-Person Families | 209 (9.8%) | $144,321 |
| 6-Person Families | 9 (0.4%) | $0 |
| 7+ Person Families | 34 (1.6%) | $0 |
| Total | 2,134 (100.0%) | $117,336 |
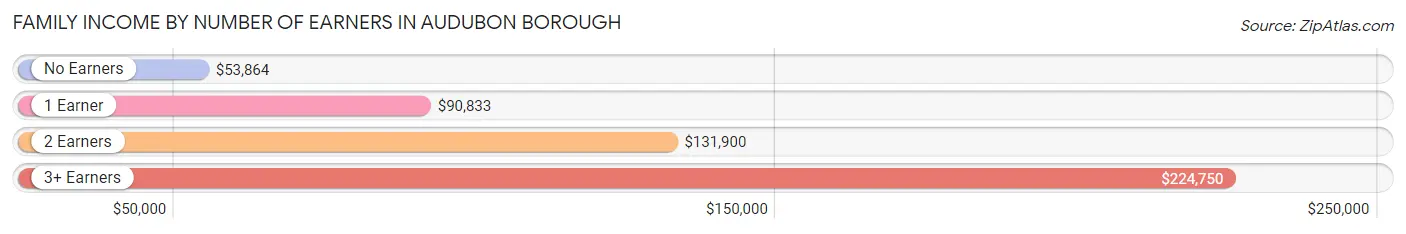
Family Income by Number of Earners in Audubon borough
The median family income in Audubon borough is $117,336, with families comprising 3+ earners (340) having the highest median family income of $224,750, while families with no earners (190) have the lowest median family income of $53,864, accounting for 15.9% and 8.9% of families, respectively.
| Number of Earners | # Families | Median Income |
| No Earners | 190 (8.9%) | $53,864 |
| 1 Earner | 610 (28.6%) | $90,833 |
| 2 Earners | 994 (46.6%) | $131,900 |
| 3+ Earners | 340 (15.9%) | $224,750 |
| Total | 2,134 (100.0%) | $117,336 |
Household Income in Audubon borough
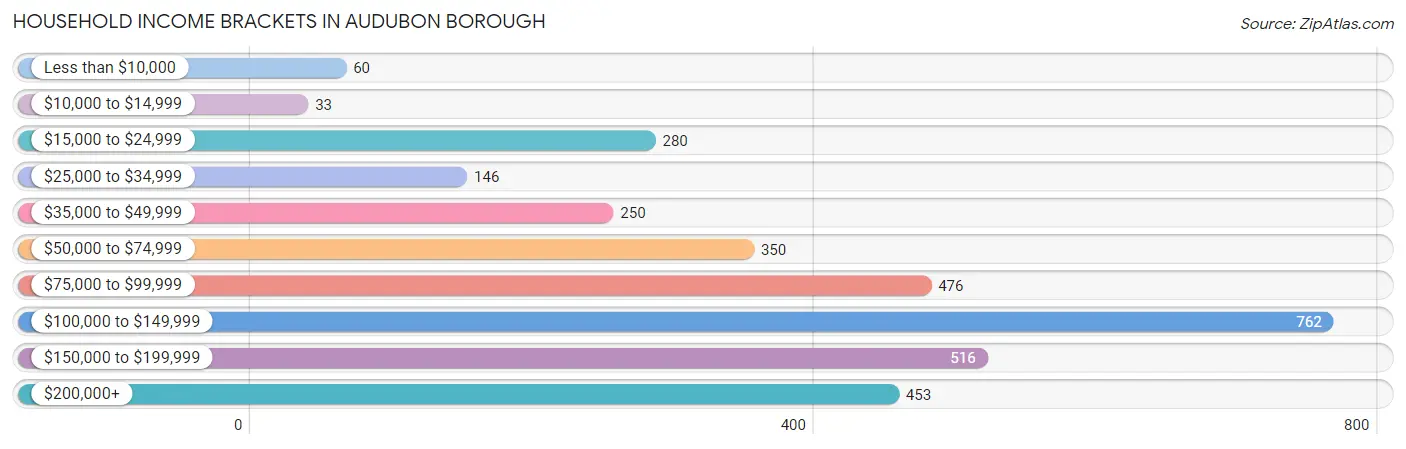
Household Income Brackets in Audubon borough
With 762 households falling in the category, the $100,000 to $149,999 income range is the most frequent in Audubon borough, accounting for 22.9% of all households. In contrast, only 33 households (1.0%) fall into the $10,000 to $14,999 income bracket, making it the least populous group.
| Income Bracket | # Households | % Households |
| Less than $10,000 | 60 | 1.8% |
| $10,000 to $14,999 | 33 | 1.0% |
| $15,000 to $24,999 | 280 | 8.4% |
| $25,000 to $34,999 | 146 | 4.4% |
| $35,000 to $49,999 | 250 | 7.5% |
| $50,000 to $74,999 | 350 | 10.5% |
| $75,000 to $99,999 | 476 | 14.3% |
| $100,000 to $149,999 | 762 | 22.9% |
| $150,000 to $199,999 | 516 | 15.5% |
| $200,000+ | 453 | 13.6% |
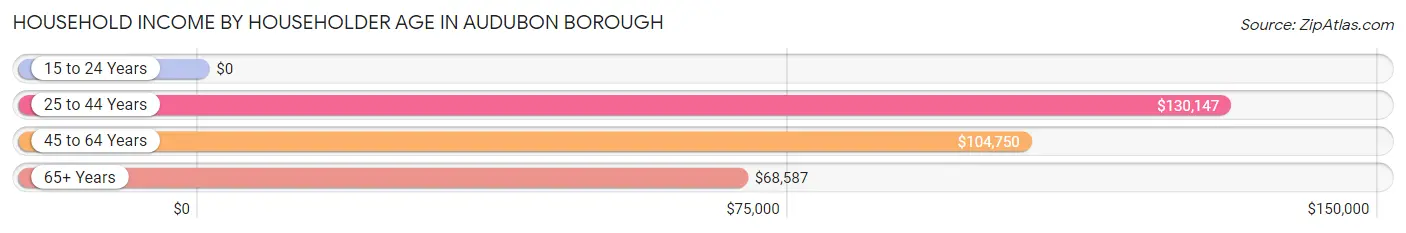
Household Income by Householder Age in Audubon borough
The median household income in Audubon borough is $103,379, with the highest median household income of $130,147 found in the 25 to 44 years age bracket for the primary householder. A total of 1,108 households (33.3%) fall into this category. Meanwhile, the 15 to 24 years age bracket for the primary householder has the lowest median household income of $0, with 25 households (0.7%) in this group.
| Income Bracket | # Households | Median Income |
| 15 to 24 Years | 25 (0.7%) | $0 |
| 25 to 44 Years | 1,108 (33.3%) | $130,147 |
| 45 to 64 Years | 1,332 (40.0%) | $104,750 |
| 65+ Years | 864 (26.0%) | $68,587 |
| Total | 3,329 (100.0%) | $103,379 |
Poverty in Audubon borough
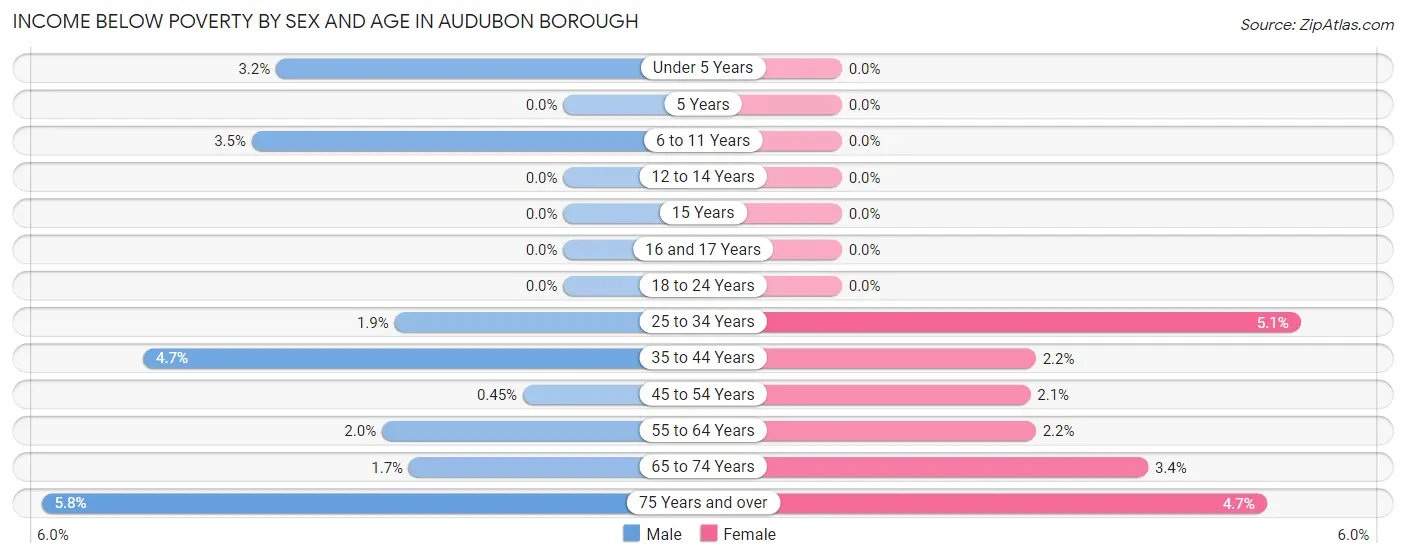
Income Below Poverty by Sex and Age in Audubon borough
With 2.4% poverty level for males and 2.3% for females among the residents of Audubon borough, 75 year old and over males and 25 to 34 year old females are the most vulnerable to poverty, with 9 males (5.8%) and 33 females (5.1%) in their respective age groups living below the poverty level.
| Age Bracket | Male | Female |
| Under 5 Years | 14 (3.2%) | 0 (0.0%) |
| 5 Years | 0 (0.0%) | 0 (0.0%) |
| 6 to 11 Years | 12 (3.5%) | 0 (0.0%) |
| 12 to 14 Years | 0 (0.0%) | 0 (0.0%) |
| 15 Years | 0 (0.0%) | 0 (0.0%) |
| 16 and 17 Years | 0 (0.0%) | 0 (0.0%) |
| 18 to 24 Years | 0 (0.0%) | 0 (0.0%) |
| 25 to 34 Years | 10 (1.9%) | 33 (5.1%) |
| 35 to 44 Years | 34 (4.7%) | 13 (2.2%) |
| 45 to 54 Years | 2 (0.4%) | 11 (2.1%) |
| 55 to 64 Years | 10 (2.0%) | 17 (2.2%) |
| 65 to 74 Years | 7 (1.7%) | 14 (3.4%) |
| 75 Years and over | 9 (5.8%) | 16 (4.7%) |
| Total | 98 (2.4%) | 104 (2.3%) |
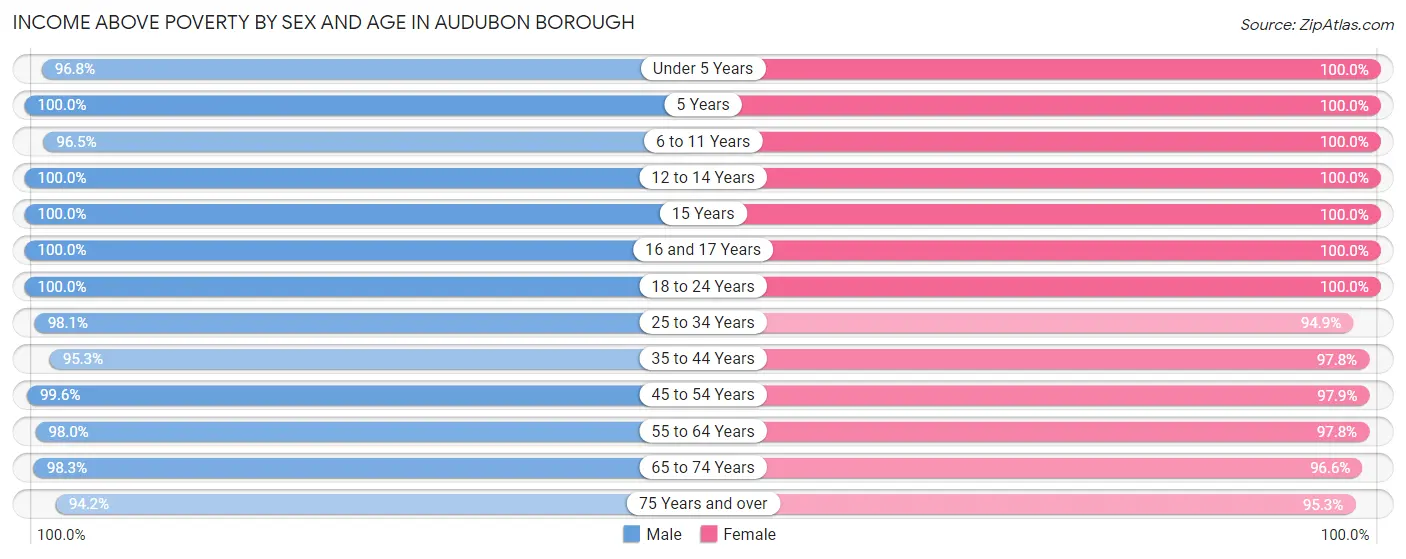
Income Above Poverty by Sex and Age in Audubon borough
According to the poverty statistics in Audubon borough, males aged 5 years and females aged under 5 years are the age groups that are most secure financially, with 100.0% of males and 100.0% of females in these age groups living above the poverty line.
| Age Bracket | Male | Female |
| Under 5 Years | 423 (96.8%) | 211 (100.0%) |
| 5 Years | 18 (100.0%) | 82 (100.0%) |
| 6 to 11 Years | 334 (96.5%) | 288 (100.0%) |
| 12 to 14 Years | 144 (100.0%) | 214 (100.0%) |
| 15 Years | 21 (100.0%) | 40 (100.0%) |
| 16 and 17 Years | 90 (100.0%) | 128 (100.0%) |
| 18 to 24 Years | 336 (100.0%) | 234 (100.0%) |
| 25 to 34 Years | 522 (98.1%) | 613 (94.9%) |
| 35 to 44 Years | 693 (95.3%) | 590 (97.8%) |
| 45 to 54 Years | 440 (99.6%) | 514 (97.9%) |
| 55 to 64 Years | 484 (98.0%) | 769 (97.8%) |
| 65 to 74 Years | 401 (98.3%) | 397 (96.6%) |
| 75 Years and over | 146 (94.2%) | 322 (95.3%) |
| Total | 4,052 (97.6%) | 4,402 (97.7%) |
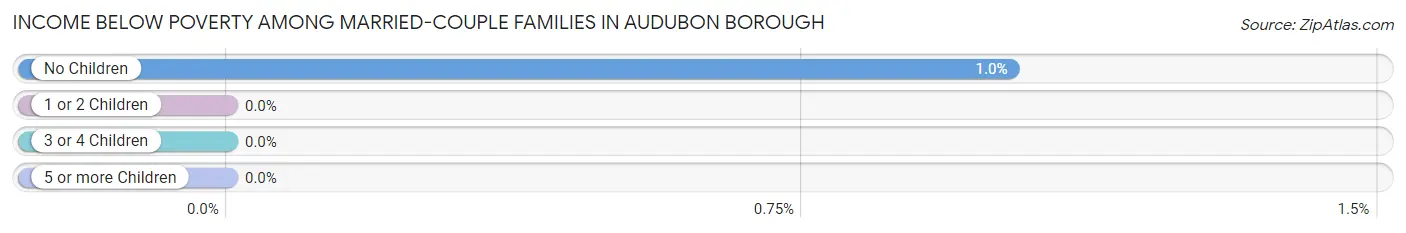
Income Below Poverty Among Married-Couple Families in Audubon borough
The poverty statistics for married-couple families in Audubon borough show that 0.6% or 10 of the total 1,535 families live below the poverty line. Families with no children have the highest poverty rate of 1.0%, comprising of 10 families. On the other hand, families with 1 or 2 children have the lowest poverty rate of 0.0%, which includes 0 families.
| Children | Above Poverty | Below Poverty |
| No Children | 972 (99.0%) | 10 (1.0%) |
| 1 or 2 Children | 409 (100.0%) | 0 (0.0%) |
| 3 or 4 Children | 110 (100.0%) | 0 (0.0%) |
| 5 or more Children | 34 (100.0%) | 0 (0.0%) |
| Total | 1,525 (99.4%) | 10 (0.6%) |
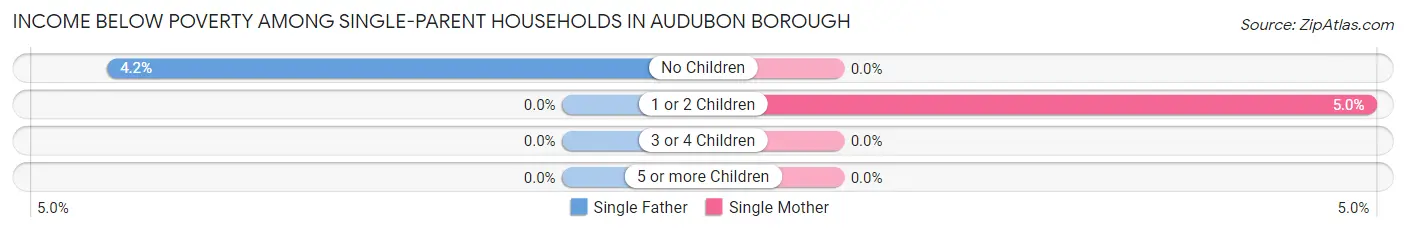
Income Below Poverty Among Single-Parent Households in Audubon borough
According to the poverty data in Audubon borough, 1.5% or 3 single-father households and 3.3% or 13 single-mother households are living below the poverty line. Among single-father households, those with no children have the highest poverty rate, with 3 households (4.2%) experiencing poverty. Likewise, among single-mother households, those with 1 or 2 children have the highest poverty rate, with 13 households (5.0%) falling below the poverty line.
| Children | Single Father | Single Mother |
| No Children | 3 (4.2%) | 0 (0.0%) |
| 1 or 2 Children | 0 (0.0%) | 13 (5.0%) |
| 3 or 4 Children | 0 (0.0%) | 0 (0.0%) |
| 5 or more Children | 0 (0.0%) | 0 (0.0%) |
| Total | 3 (1.5%) | 13 (3.3%) |
Income Below Poverty Among Married-Couple vs Single-Parent Households in Audubon borough
The poverty data for Audubon borough shows that 10 of the married-couple family households (0.6%) and 16 of the single-parent households (2.7%) are living below the poverty level. Within the married-couple family households, those with no children have the highest poverty rate, with 10 households (1.0%) falling below the poverty line. Among the single-parent households, those with 1 or 2 children have the highest poverty rate, with 13 household (4.2%) living below poverty.
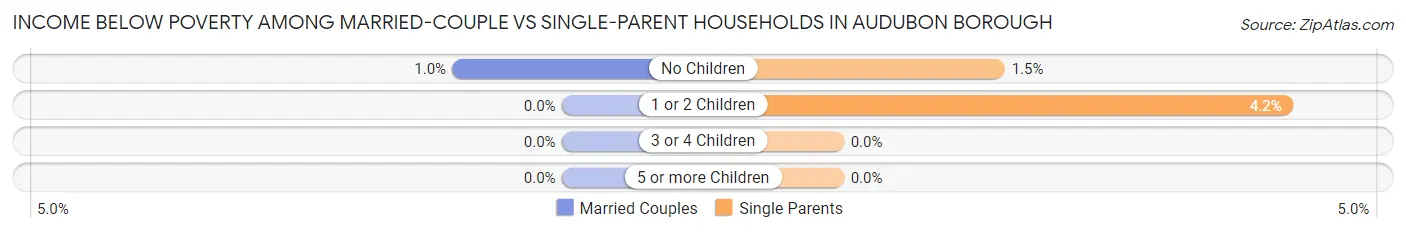
| Children | Married-Couple Families | Single-Parent Households |
| No Children | 10 (1.0%) | 3 (1.5%) |
| 1 or 2 Children | 0 (0.0%) | 13 (4.2%) |
| 3 or 4 Children | 0 (0.0%) | 0 (0.0%) |
| 5 or more Children | 0 (0.0%) | 0 (0.0%) |
| Total | 10 (0.6%) | 16 (2.7%) |
Race in Audubon borough
The most populous races in Audubon borough are White / Caucasian (8,163 | 93.9%), Hispanic or Latino (354 | 4.1%), and Black / African American (206 | 2.4%).
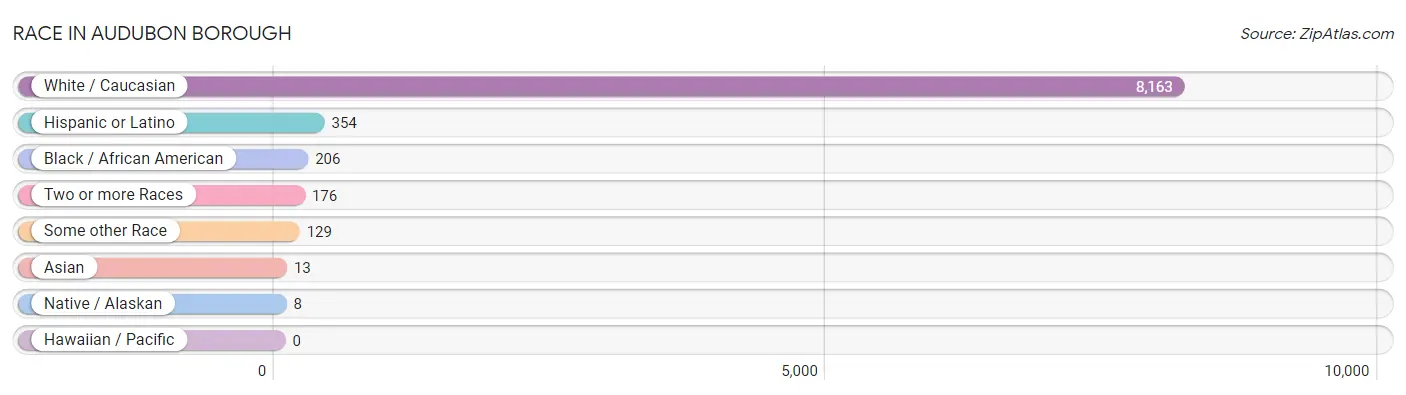
| Race | # Population | % Population |
| Asian | 13 | 0.2% |
| Black / African American | 206 | 2.4% |
| Hawaiian / Pacific | 0 | 0.0% |
| Hispanic or Latino | 354 | 4.1% |
| Native / Alaskan | 8 | 0.1% |
| White / Caucasian | 8,163 | 93.9% |
| Two or more Races | 176 | 2.0% |
| Some other Race | 129 | 1.5% |
| Total | 8,695 | 100.0% |
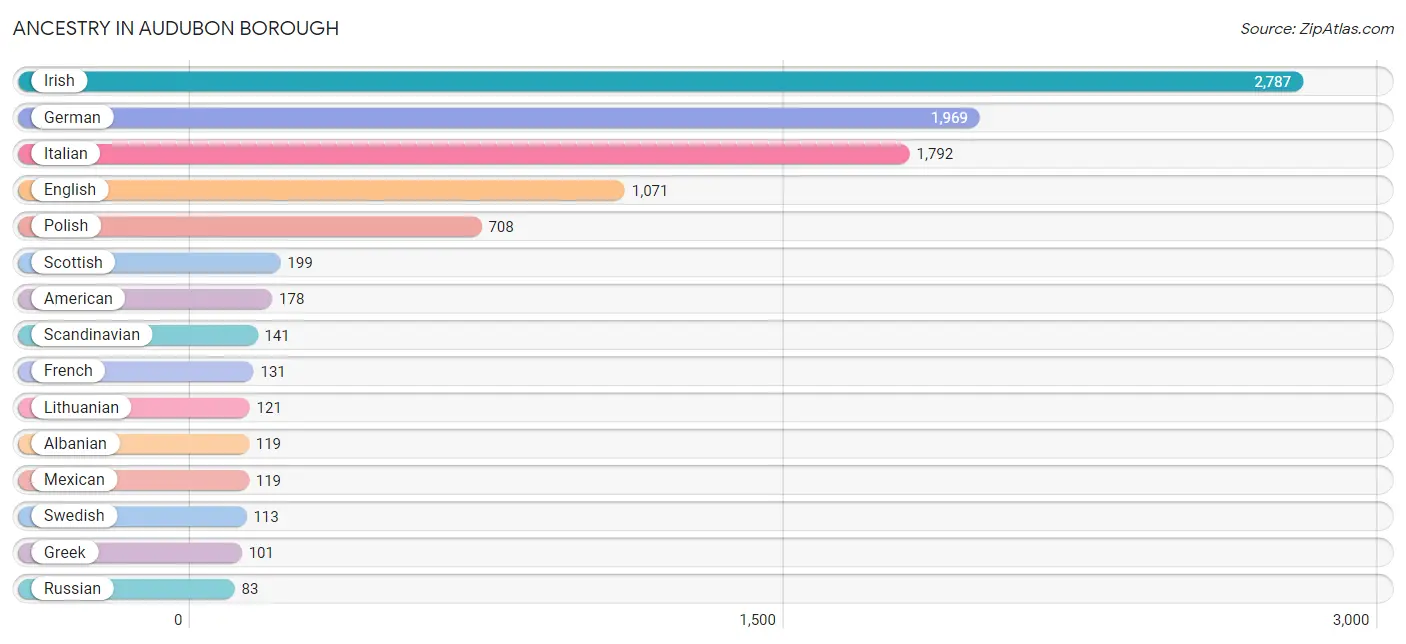
Ancestry in Audubon borough
The most populous ancestries reported in Audubon borough are Irish (2,787 | 32.1%), German (1,969 | 22.7%), Italian (1,792 | 20.6%), English (1,071 | 12.3%), and Polish (708 | 8.1%), together accounting for 95.8% of all Audubon borough residents.
| Ancestry | # Population | % Population |
| Albanian | 119 | 1.4% |
| American | 178 | 2.1% |
| Austrian | 25 | 0.3% |
| Basque | 33 | 0.4% |
| Bhutanese | 7 | 0.1% |
| Blackfeet | 10 | 0.1% |
| British | 15 | 0.2% |
| Canadian | 20 | 0.2% |
| Central American | 68 | 0.8% |
| Central American Indian | 10 | 0.1% |
| Cherokee | 6 | 0.1% |
| Colombian | 11 | 0.1% |
| Croatian | 6 | 0.1% |
| Cuban | 61 | 0.7% |
| Czech | 7 | 0.1% |
| Czechoslovakian | 19 | 0.2% |
| Dutch | 65 | 0.7% |
| Eastern European | 14 | 0.2% |
| English | 1,071 | 12.3% |
| European | 63 | 0.7% |
| French | 131 | 1.5% |
| French Canadian | 31 | 0.4% |
| German | 1,969 | 22.7% |
| Greek | 101 | 1.2% |
| Hungarian | 22 | 0.3% |
| Irish | 2,787 | 32.1% |
| Italian | 1,792 | 20.6% |
| Korean | 40 | 0.5% |
| Lithuanian | 121 | 1.4% |
| Mexican | 119 | 1.4% |
| Navajo | 7 | 0.1% |
| Northern European | 5 | 0.1% |
| Norwegian | 36 | 0.4% |
| Polish | 708 | 8.1% |
| Portuguese | 3 | 0.0% |
| Puerto Rican | 45 | 0.5% |
| Romanian | 34 | 0.4% |
| Russian | 83 | 0.9% |
| Salvadoran | 68 | 0.8% |
| Scandinavian | 141 | 1.6% |
| Scotch-Irish | 49 | 0.6% |
| Scottish | 199 | 2.3% |
| Sioux | 9 | 0.1% |
| Slavic | 35 | 0.4% |
| Slovak | 37 | 0.4% |
| Slovene | 5 | 0.1% |
| South American | 11 | 0.1% |
| Spaniard | 17 | 0.2% |
| Spanish | 33 | 0.4% |
| Sri Lankan | 5 | 0.1% |
| Swedish | 113 | 1.3% |
| Swiss | 39 | 0.4% |
| Thai | 8 | 0.1% |
| Ukrainian | 38 | 0.4% |
| Welsh | 21 | 0.2% | View All 55 Rows |
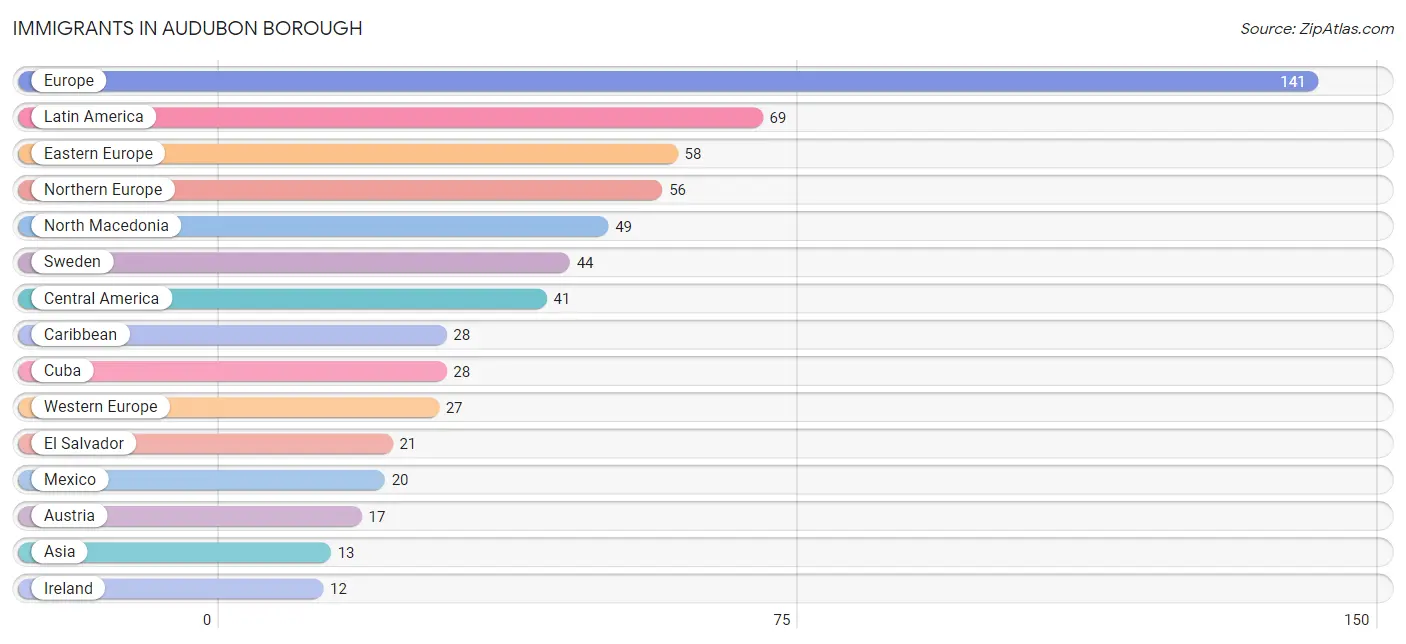
Immigrants in Audubon borough
The most numerous immigrant groups reported in Audubon borough came from Europe (141 | 1.6%), Latin America (69 | 0.8%), Eastern Europe (58 | 0.7%), Northern Europe (56 | 0.6%), and North Macedonia (49 | 0.6%), together accounting for 4.3% of all Audubon borough residents.
| Immigration Origin | # Population | % Population |
| Asia | 13 | 0.2% |
| Austria | 17 | 0.2% |
| Caribbean | 28 | 0.3% |
| Central America | 41 | 0.5% |
| Croatia | 9 | 0.1% |
| Cuba | 28 | 0.3% |
| Eastern Europe | 58 | 0.7% |
| El Salvador | 21 | 0.2% |
| Europe | 141 | 1.6% |
| India | 8 | 0.1% |
| Ireland | 12 | 0.1% |
| Latin America | 69 | 0.8% |
| Mexico | 20 | 0.2% |
| Netherlands | 10 | 0.1% |
| North Macedonia | 49 | 0.6% |
| Northern Europe | 56 | 0.6% |
| South Central Asia | 8 | 0.1% |
| South Eastern Asia | 5 | 0.1% |
| Sweden | 44 | 0.5% |
| Vietnam | 5 | 0.1% |
| Western Europe | 27 | 0.3% | View All 21 Rows |
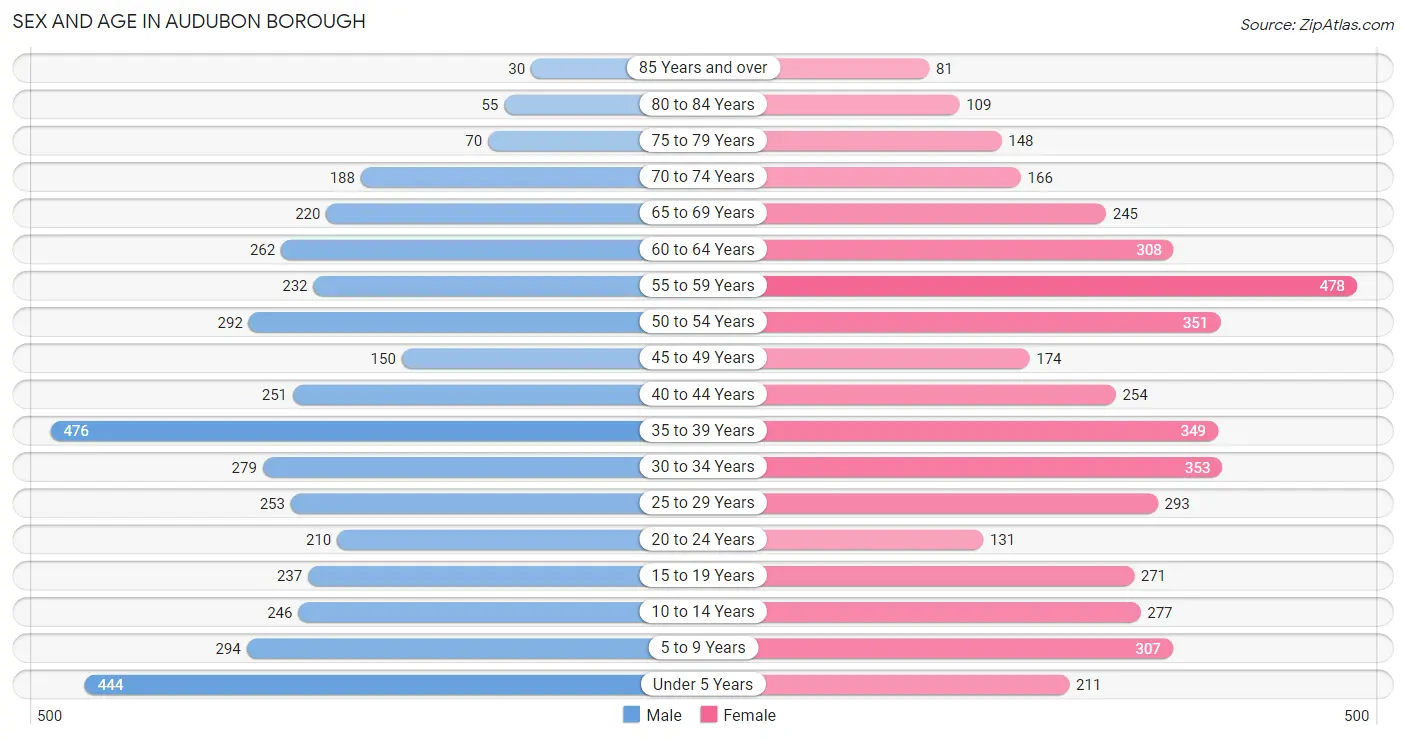
Sex and Age in Audubon borough
Sex and Age in Audubon borough
The most populous age groups in Audubon borough are 35 to 39 Years (476 | 11.4%) for men and 55 to 59 Years (478 | 10.6%) for women.
| Age Bracket | Male | Female |
| Under 5 Years | 444 (10.6%) | 211 (4.7%) |
| 5 to 9 Years | 294 (7.0%) | 307 (6.8%) |
| 10 to 14 Years | 246 (5.9%) | 277 (6.1%) |
| 15 to 19 Years | 237 (5.7%) | 271 (6.0%) |
| 20 to 24 Years | 210 (5.0%) | 131 (2.9%) |
| 25 to 29 Years | 253 (6.0%) | 293 (6.5%) |
| 30 to 34 Years | 279 (6.7%) | 353 (7.8%) |
| 35 to 39 Years | 476 (11.4%) | 349 (7.7%) |
| 40 to 44 Years | 251 (6.0%) | 254 (5.6%) |
| 45 to 49 Years | 150 (3.6%) | 174 (3.9%) |
| 50 to 54 Years | 292 (7.0%) | 351 (7.8%) |
| 55 to 59 Years | 232 (5.5%) | 478 (10.6%) |
| 60 to 64 Years | 262 (6.2%) | 308 (6.8%) |
| 65 to 69 Years | 220 (5.2%) | 245 (5.4%) |
| 70 to 74 Years | 188 (4.5%) | 166 (3.7%) |
| 75 to 79 Years | 70 (1.7%) | 148 (3.3%) |
| 80 to 84 Years | 55 (1.3%) | 109 (2.4%) |
| 85 Years and over | 30 (0.7%) | 81 (1.8%) |
| Total | 4,189 (100.0%) | 4,506 (100.0%) |
Families and Households in Audubon borough
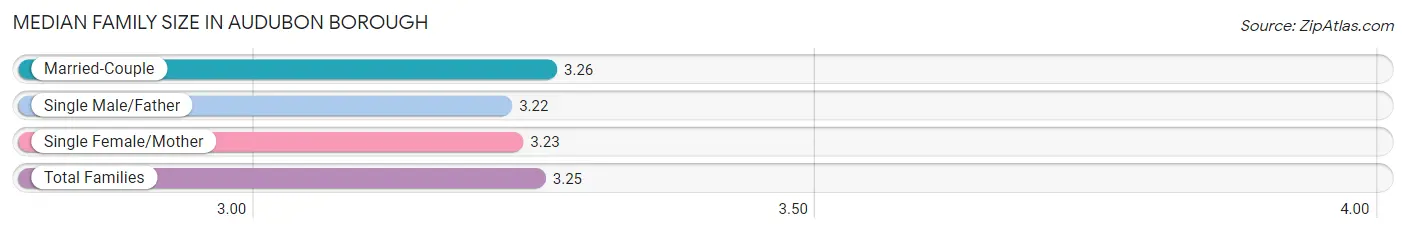
Median Family Size in Audubon borough
The median family size in Audubon borough is 3.25 persons per family, with married-couple families (1,535 | 71.9%) accounting for the largest median family size of 3.26 persons per family. On the other hand, single male/father families (202 | 9.5%) represent the smallest median family size with 3.22 persons per family.
| Family Type | # Families | Family Size |
| Married-Couple | 1,535 (71.9%) | 3.26 |
| Single Male/Father | 202 (9.5%) | 3.22 |
| Single Female/Mother | 397 (18.6%) | 3.23 |
| Total Families | 2,134 (100.0%) | 3.25 |
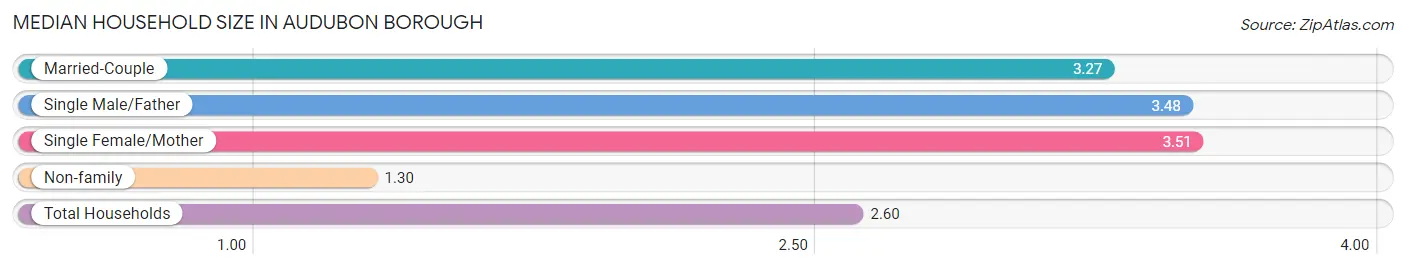
Median Household Size in Audubon borough
The median household size in Audubon borough is 2.60 persons per household, with single female/mother households (397 | 11.9%) accounting for the largest median household size of 3.51 persons per household. non-family households (1,195 | 35.9%) represent the smallest median household size with 1.30 persons per household.
| Household Type | # Households | Household Size |
| Married-Couple | 1,535 (46.1%) | 3.27 |
| Single Male/Father | 202 (6.1%) | 3.48 |
| Single Female/Mother | 397 (11.9%) | 3.51 |
| Non-family | 1,195 (35.9%) | 1.30 |
| Total Households | 3,329 (100.0%) | 2.60 |
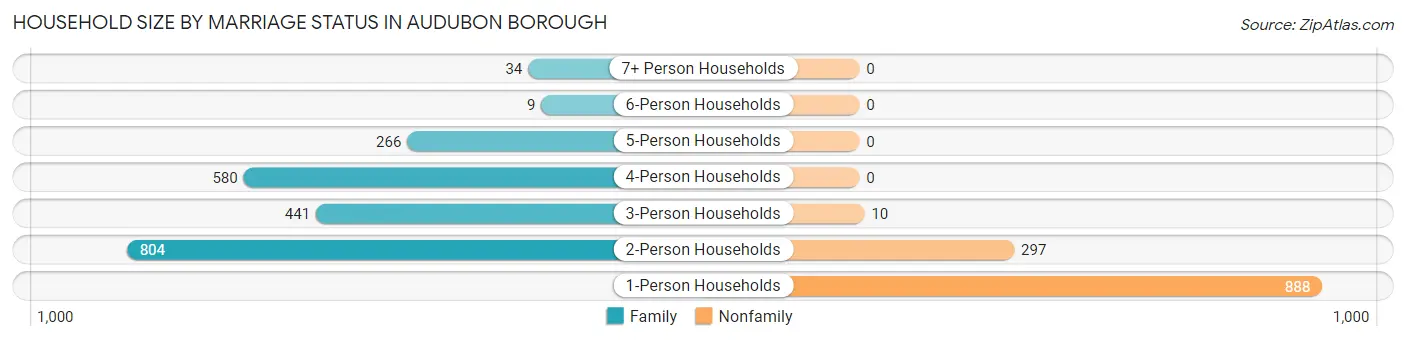
Household Size by Marriage Status in Audubon borough
Out of a total of 3,329 households in Audubon borough, 2,134 (64.1%) are family households, while 1,195 (35.9%) are nonfamily households. The most numerous type of family households are 2-person households, comprising 804, and the most common type of nonfamily households are 1-person households, comprising 888.
| Household Size | Family Households | Nonfamily Households |
| 1-Person Households | - | 888 (26.7%) |
| 2-Person Households | 804 (24.1%) | 297 (8.9%) |
| 3-Person Households | 441 (13.3%) | 10 (0.3%) |
| 4-Person Households | 580 (17.4%) | 0 (0.0%) |
| 5-Person Households | 266 (8.0%) | 0 (0.0%) |
| 6-Person Households | 9 (0.3%) | 0 (0.0%) |
| 7+ Person Households | 34 (1.0%) | 0 (0.0%) |
| Total | 2,134 (64.1%) | 1,195 (35.9%) |
Female Fertility in Audubon borough
Fertility by Age in Audubon borough
Average fertility rate in Audubon borough is 74.0 births per 1,000 women. Women in the age bracket of 35 to 50 years have the highest fertility rate with 130.0 births per 1,000 women. Women in the age bracket of 35 to 50 years acount for 77.9% of all women with births.
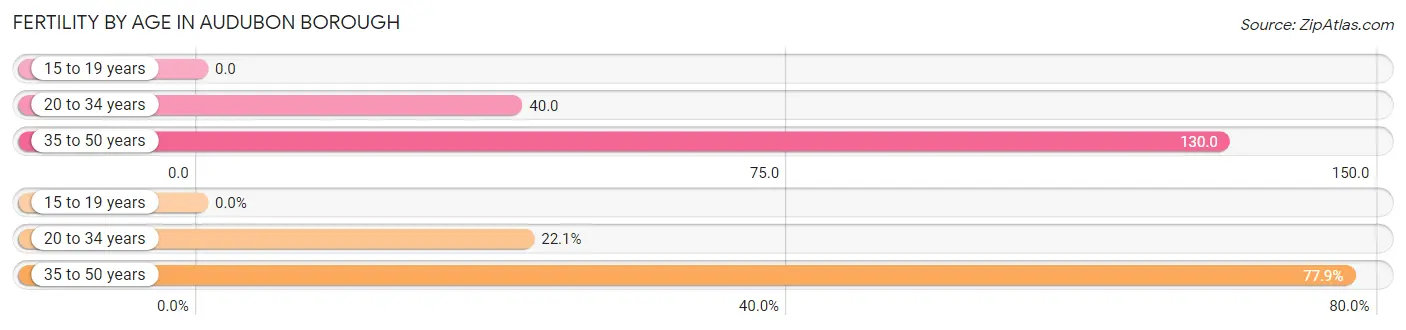
| Age Bracket | Women with Births | Births / 1,000 Women |
| 15 to 19 years | 0 (0.0%) | 0.0 |
| 20 to 34 years | 31 (22.1%) | 40.0 |
| 35 to 50 years | 109 (77.9%) | 130.0 |
| Total | 140 (100.0%) | 74.0 |
Fertility by Age by Marriage Status in Audubon borough
92.1% of women with births (140) in Audubon borough are married. The highest percentage of unmarried women with births falls into 20 to 34 years age bracket with 12.9% of them unmarried at the time of birth, while the lowest percentage of unmarried women with births belong to 35 to 50 years age bracket with 6.4% of them unmarried.
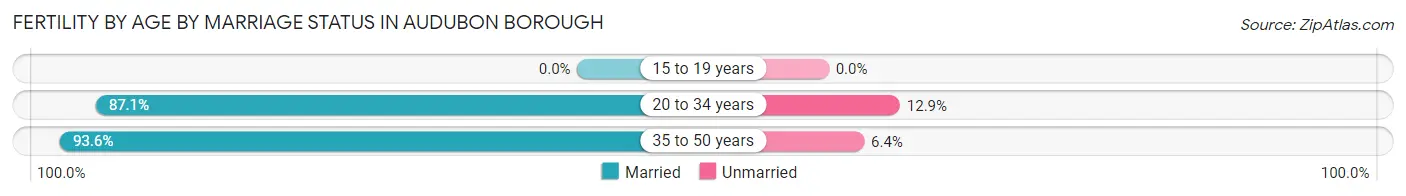
| Age Bracket | Married | Unmarried |
| 15 to 19 years | 0 (0.0%) | 0 (0.0%) |
| 20 to 34 years | 27 (87.1%) | 4 (12.9%) |
| 35 to 50 years | 102 (93.6%) | 7 (6.4%) |
| Total | 129 (92.1%) | 11 (7.9%) |
Fertility by Education in Audubon borough
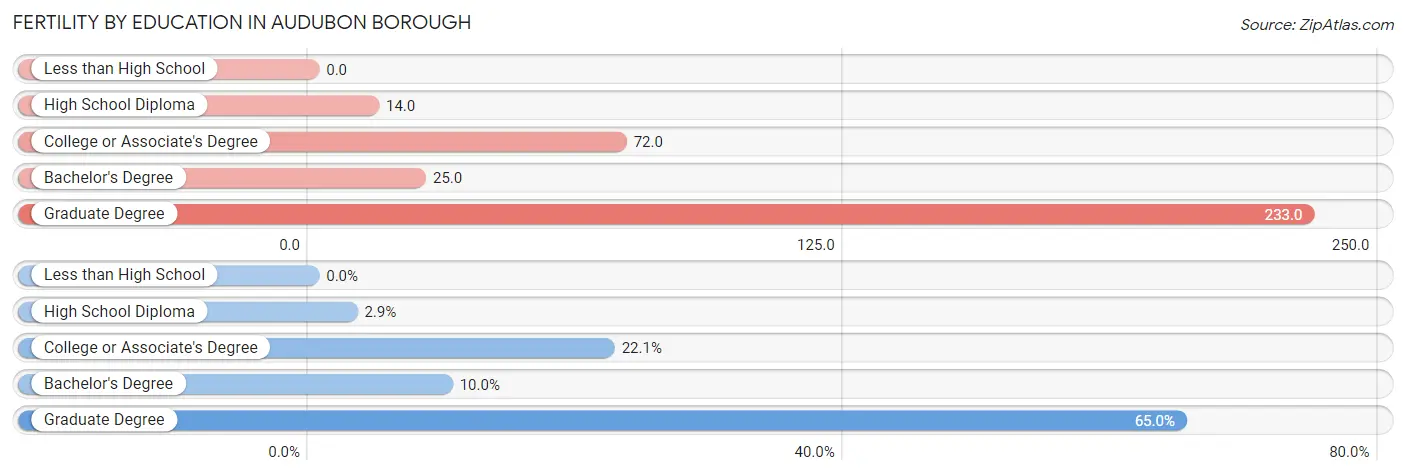
| Educational Attainment | Women with Births | Births / 1,000 Women |
| Less than High School | 0 (0.0%) | 0.0 |
| High School Diploma | 4 (2.9%) | 14.0 |
| College or Associate's Degree | 31 (22.1%) | 72.0 |
| Bachelor's Degree | 14 (10.0%) | 25.0 |
| Graduate Degree | 91 (65.0%) | 233.0 |
| Total | 140 (100.0%) | 74.0 |
Fertility by Education by Marriage Status in Audubon borough
7.9% of women with births in Audubon borough are unmarried. Women with the educational attainment of bachelor's degree are most likely to be married with 100.0% of them married at childbirth, while women with the educational attainment of high school diploma are least likely to be married with 100.0% of them unmarried at childbirth.
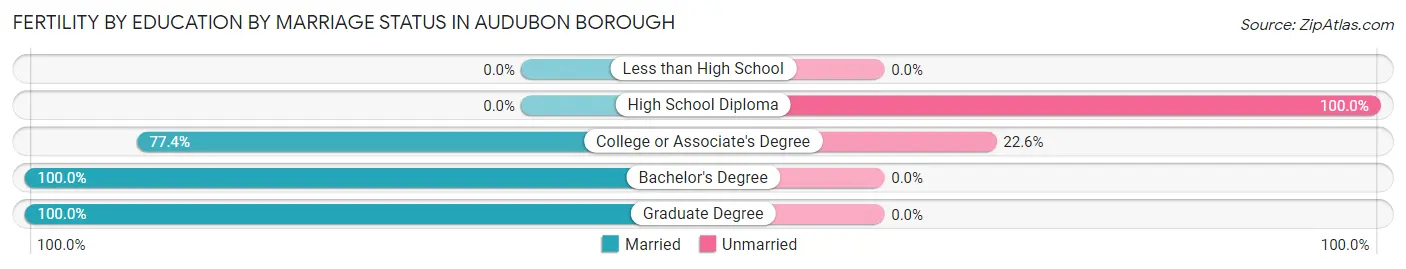
| Educational Attainment | Married | Unmarried |
| Less than High School | 0 (0.0%) | 0 (0.0%) |
| High School Diploma | 0 (0.0%) | 4 (100.0%) |
| College or Associate's Degree | 24 (77.4%) | 7 (22.6%) |
| Bachelor's Degree | 14 (100.0%) | 0 (0.0%) |
| Graduate Degree | 91 (100.0%) | 0 (0.0%) |
| Total | 129 (92.1%) | 11 (7.9%) |
Employment Characteristics in Audubon borough
Employment by Class of Employer in Audubon borough
Among the 4,588 employed individuals in Audubon borough, private company employees (3,089 | 67.3%), self-employed (not incorporated) (424 | 9.2%), and not-for-profit organizations (406 | 8.8%) make up the most common classes of employment.
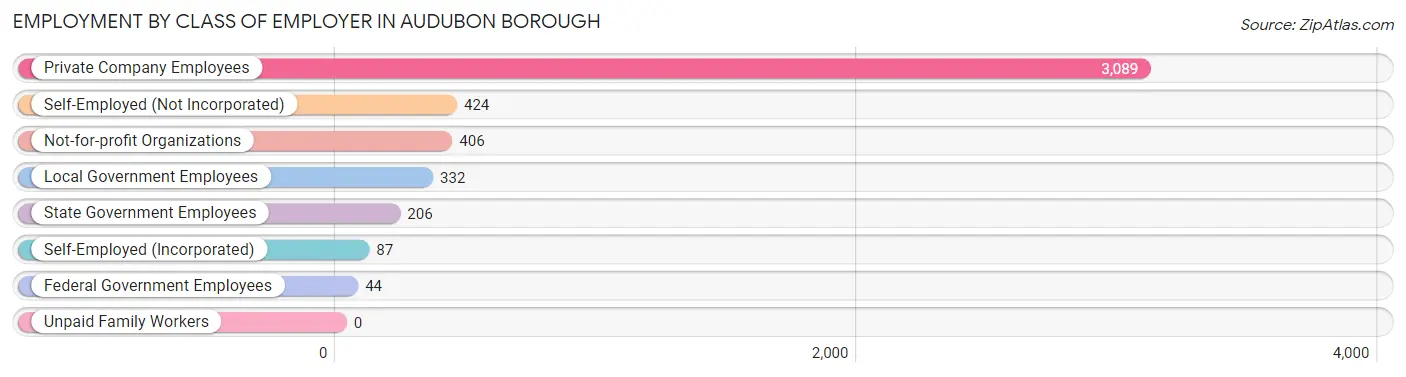
| Employer Class | # Employees | % Employees |
| Private Company Employees | 3,089 | 67.3% |
| Self-Employed (Incorporated) | 87 | 1.9% |
| Self-Employed (Not Incorporated) | 424 | 9.2% |
| Not-for-profit Organizations | 406 | 8.8% |
| Local Government Employees | 332 | 7.2% |
| State Government Employees | 206 | 4.5% |
| Federal Government Employees | 44 | 1.0% |
| Unpaid Family Workers | 0 | 0.0% |
| Total | 4,588 | 100.0% |
Employment Status by Age in Audubon borough
According to the labor force statistics for Audubon borough, out of the total population over 16 years of age (6,855), 72.8% or 4,990 individuals are in the labor force, with 5.0% or 250 of them unemployed. The age group with the highest labor force participation rate is 30 to 34 years, with 93.8% or 593 individuals in the labor force. Within the labor force, the 16 to 19 years age range has the highest percentage of unemployed individuals, with 24.7% or 60 of them being unemployed.
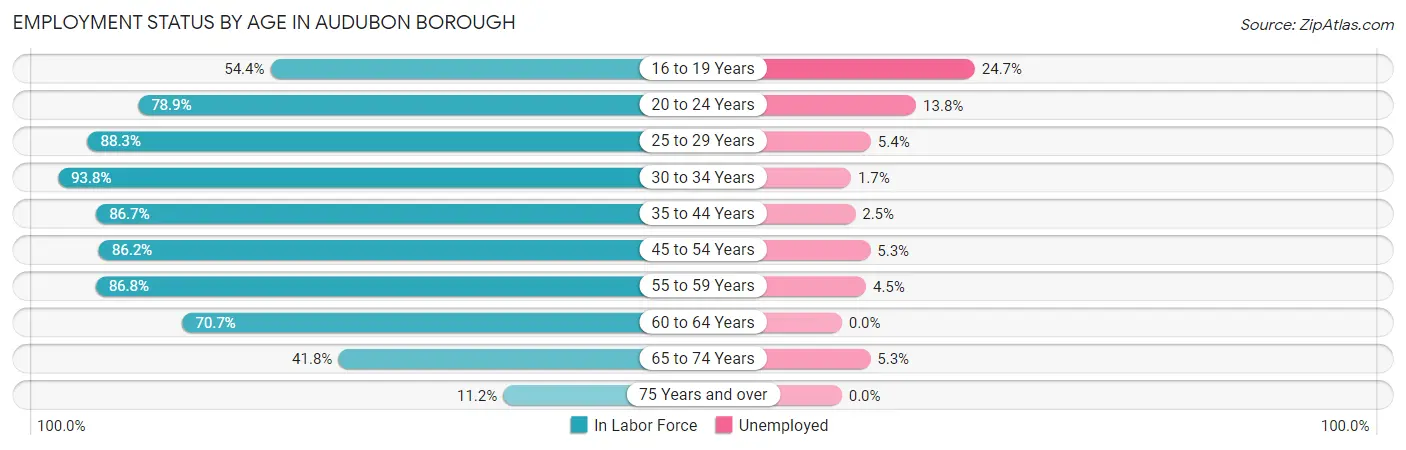
| Age Bracket | In Labor Force | Unemployed |
| 16 to 19 Years | 243 (54.4%) | 60 (24.7%) |
| 20 to 24 Years | 269 (78.9%) | 37 (13.8%) |
| 25 to 29 Years | 482 (88.3%) | 26 (5.4%) |
| 30 to 34 Years | 593 (93.8%) | 10 (1.7%) |
| 35 to 44 Years | 1,153 (86.7%) | 29 (2.5%) |
| 45 to 54 Years | 834 (86.2%) | 44 (5.3%) |
| 55 to 59 Years | 616 (86.8%) | 28 (4.5%) |
| 60 to 64 Years | 403 (70.7%) | 0 (0.0%) |
| 65 to 74 Years | 342 (41.8%) | 18 (5.3%) |
| 75 Years and over | 55 (11.2%) | 0 (0.0%) |
| Total | 4,990 (72.8%) | 250 (5.0%) |
Employment Status by Educational Attainment in Audubon borough
According to labor force statistics for Audubon borough, 85.8% of individuals (4,080) out of the total population between 25 and 64 years of age (4,755) are in the labor force, with 3.3% or 135 of them being unemployed. The group with the highest labor force participation rate are those with the educational attainment of college / associate degree, with 89.2% or 1,062 individuals in the labor force. Within the labor force, individuals with less than high school education have the highest percentage of unemployment, with 11.4% or 9 of them being unemployed.
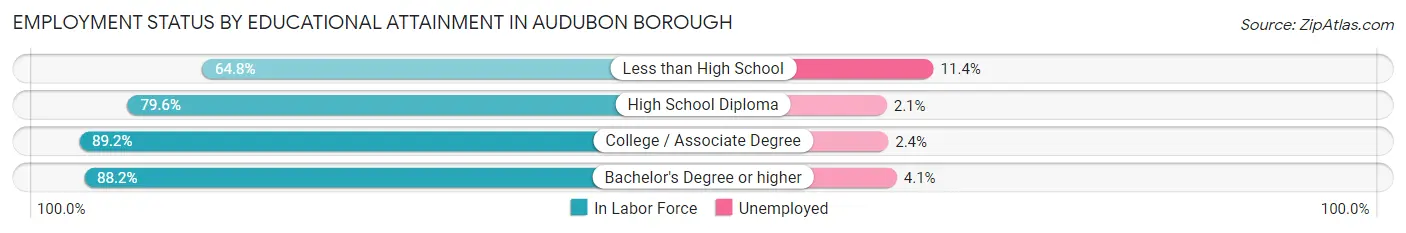
| Educational Attainment | In Labor Force | Unemployed |
| Less than High School | 79 (64.8%) | 14 (11.4%) |
| High School Diploma | 877 (79.6%) | 23 (2.1%) |
| College / Associate Degree | 1,062 (89.2%) | 29 (2.4%) |
| Bachelor's Degree or higher | 2,064 (88.2%) | 96 (4.1%) |
| Total | 4,080 (85.8%) | 157 (3.3%) |
Employment Occupations by Sex in Audubon borough
Management, Business, Science and Arts Occupations
The most common Management, Business, Science and Arts occupations in Audubon borough are Community & Social Service (693 | 14.7%), Management (578 | 12.2%), Health Diagnosing & Treating (519 | 11.0%), Business & Financial (497 | 10.5%), and Health Technologists (403 | 8.5%).
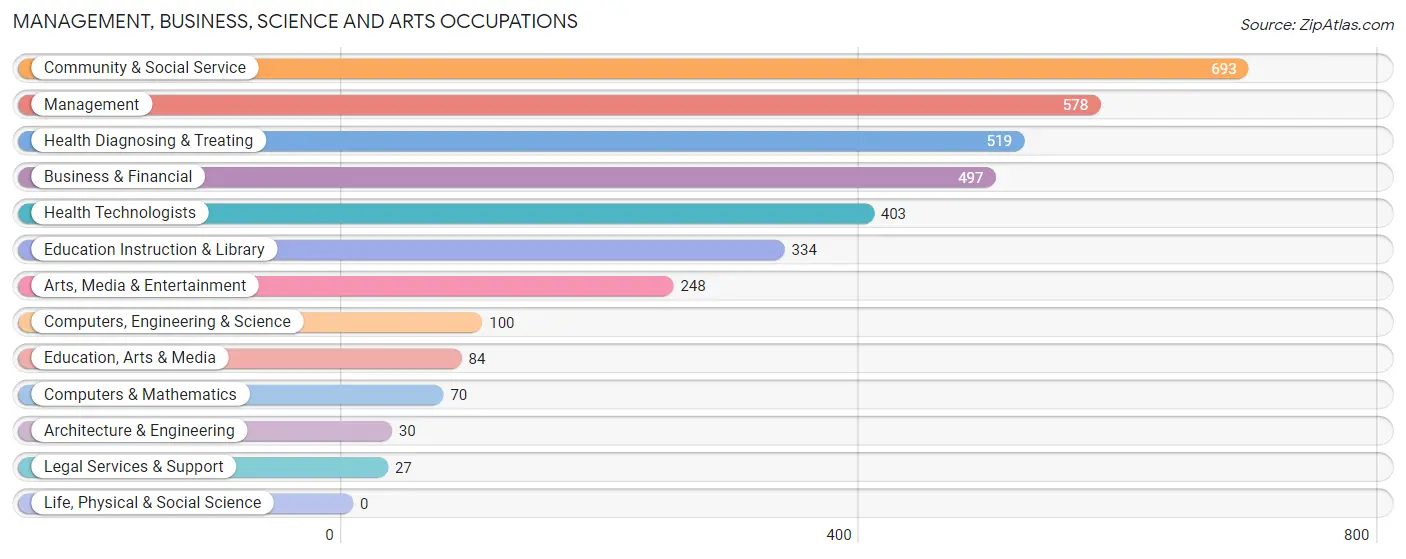
Management, Business, Science and Arts Occupations by Sex
Within the Management, Business, Science and Arts occupations in Audubon borough, the most male-oriented occupations are Architecture & Engineering (76.7%), Computers, Engineering & Science (65.0%), and Business & Financial (62.0%), while the most female-oriented occupations are Education, Arts & Media (86.9%), Health Diagnosing & Treating (83.6%), and Health Technologists (83.4%).
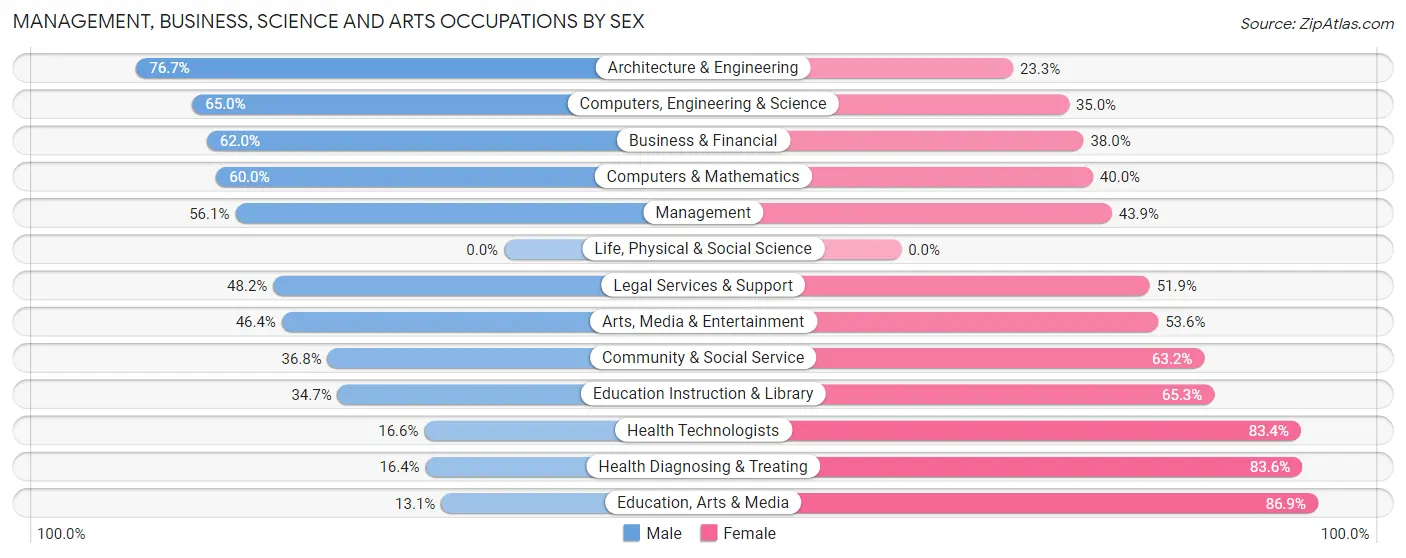
| Occupation | Male | Female |
| Management | 324 (56.1%) | 254 (43.9%) |
| Business & Financial | 308 (62.0%) | 189 (38.0%) |
| Computers, Engineering & Science | 65 (65.0%) | 35 (35.0%) |
| Computers & Mathematics | 42 (60.0%) | 28 (40.0%) |
| Architecture & Engineering | 23 (76.7%) | 7 (23.3%) |
| Life, Physical & Social Science | 0 (0.0%) | 0 (0.0%) |
| Community & Social Service | 255 (36.8%) | 438 (63.2%) |
| Education, Arts & Media | 11 (13.1%) | 73 (86.9%) |
| Legal Services & Support | 13 (48.1%) | 14 (51.8%) |
| Education Instruction & Library | 116 (34.7%) | 218 (65.3%) |
| Arts, Media & Entertainment | 115 (46.4%) | 133 (53.6%) |
| Health Diagnosing & Treating | 85 (16.4%) | 434 (83.6%) |
| Health Technologists | 67 (16.6%) | 336 (83.4%) |
| Total (Category) | 1,037 (43.4%) | 1,350 (56.6%) |
| Total (Overall) | 2,284 (48.4%) | 2,439 (51.6%) |
Services Occupations
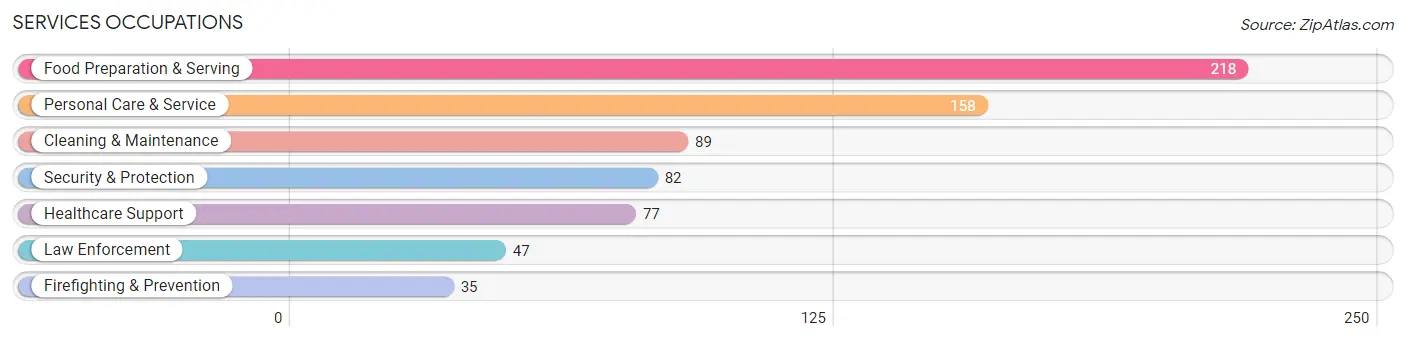
The most common Services occupations in Audubon borough are Food Preparation & Serving (218 | 4.6%), Personal Care & Service (158 | 3.4%), Cleaning & Maintenance (89 | 1.9%), Security & Protection (82 | 1.7%), and Healthcare Support (77 | 1.6%).
Services Occupations by Sex
Within the Services occupations in Audubon borough, the most male-oriented occupations are Cleaning & Maintenance (100.0%), Firefighting & Prevention (80.0%), and Security & Protection (47.6%), while the most female-oriented occupations are Personal Care & Service (82.9%), Law Enforcement (76.6%), and Food Preparation & Serving (72.5%).
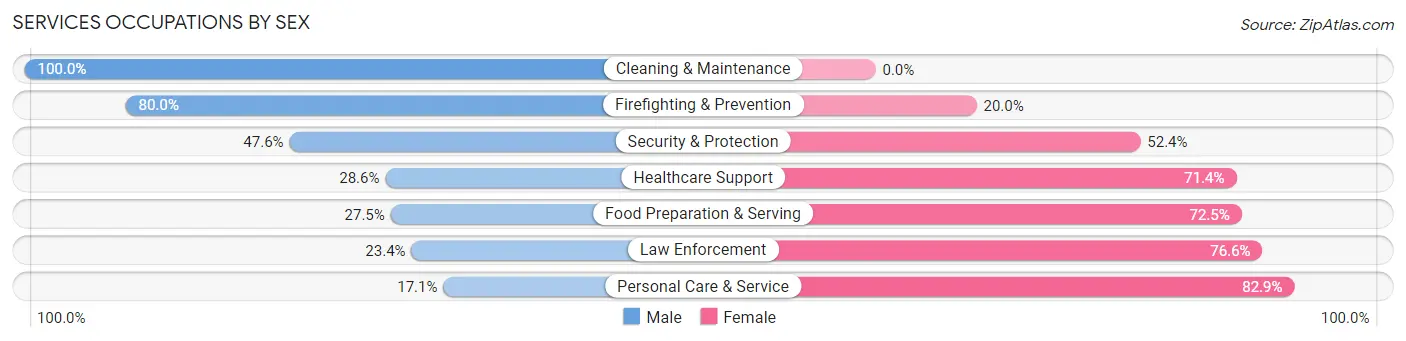
| Occupation | Male | Female |
| Healthcare Support | 22 (28.6%) | 55 (71.4%) |
| Security & Protection | 39 (47.6%) | 43 (52.4%) |
| Firefighting & Prevention | 28 (80.0%) | 7 (20.0%) |
| Law Enforcement | 11 (23.4%) | 36 (76.6%) |
| Food Preparation & Serving | 60 (27.5%) | 158 (72.5%) |
| Cleaning & Maintenance | 89 (100.0%) | 0 (0.0%) |
| Personal Care & Service | 27 (17.1%) | 131 (82.9%) |
| Total (Category) | 237 (38.0%) | 387 (62.0%) |
| Total (Overall) | 2,284 (48.4%) | 2,439 (51.6%) |
Sales and Office Occupations
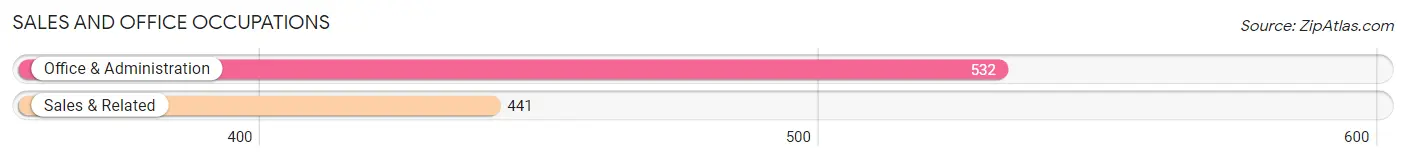
The most common Sales and Office occupations in Audubon borough are Office & Administration (532 | 11.3%), and Sales & Related (441 | 9.3%).
Sales and Office Occupations by Sex

| Occupation | Male | Female |
| Sales & Related | 255 (57.8%) | 186 (42.2%) |
| Office & Administration | 116 (21.8%) | 416 (78.2%) |
| Total (Category) | 371 (38.1%) | 602 (61.9%) |
| Total (Overall) | 2,284 (48.4%) | 2,439 (51.6%) |
Natural Resources, Construction and Maintenance Occupations
The most common Natural Resources, Construction and Maintenance occupations in Audubon borough are Construction & Extraction (189 | 4.0%), Installation, Maintenance & Repair (73 | 1.5%), and Farming, Fishing & Forestry (18 | 0.4%).
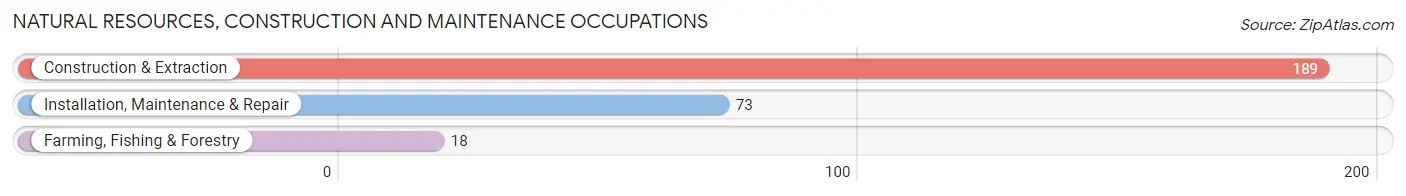
Natural Resources, Construction and Maintenance Occupations by Sex
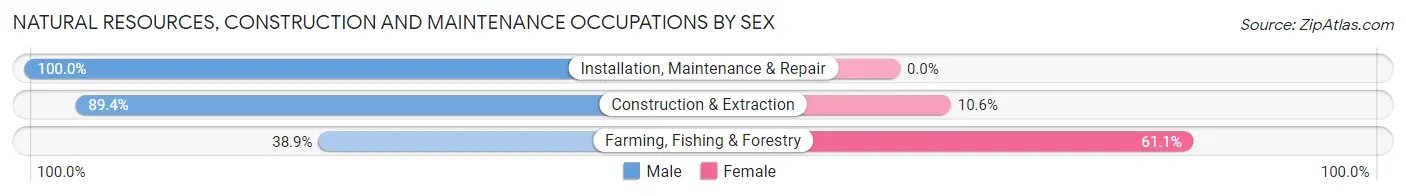
| Occupation | Male | Female |
| Farming, Fishing & Forestry | 7 (38.9%) | 11 (61.1%) |
| Construction & Extraction | 169 (89.4%) | 20 (10.6%) |
| Installation, Maintenance & Repair | 73 (100.0%) | 0 (0.0%) |
| Total (Category) | 249 (88.9%) | 31 (11.1%) |
| Total (Overall) | 2,284 (48.4%) | 2,439 (51.6%) |
Production, Transportation and Moving Occupations
The most common Production, Transportation and Moving occupations in Audubon borough are Production (227 | 4.8%), Material Moving (152 | 3.2%), and Transportation (80 | 1.7%).
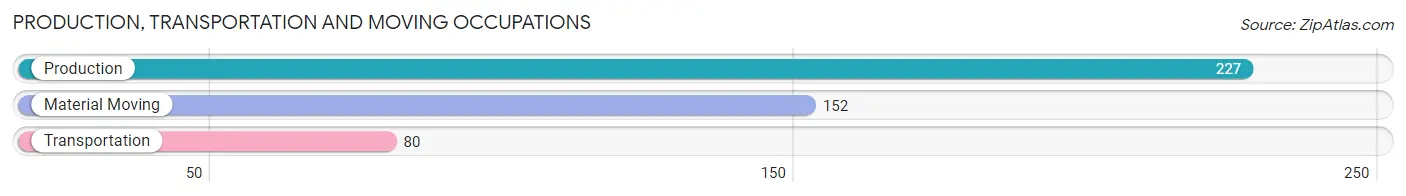
Production, Transportation and Moving Occupations by Sex
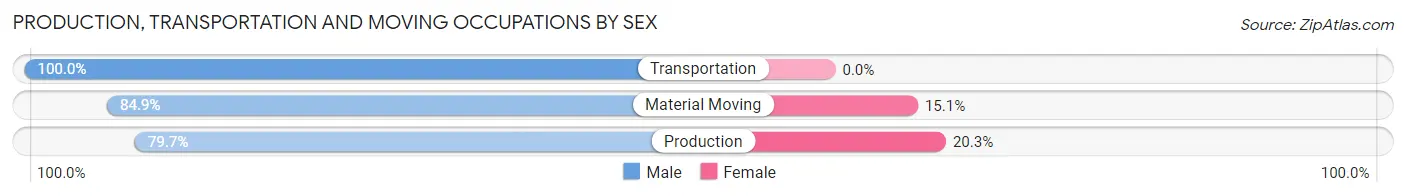
| Occupation | Male | Female |
| Production | 181 (79.7%) | 46 (20.3%) |
| Transportation | 80 (100.0%) | 0 (0.0%) |
| Material Moving | 129 (84.9%) | 23 (15.1%) |
| Total (Category) | 390 (85.0%) | 69 (15.0%) |
| Total (Overall) | 2,284 (48.4%) | 2,439 (51.6%) |
Employment Industries by Sex in Audubon borough
Employment Industries in Audubon borough
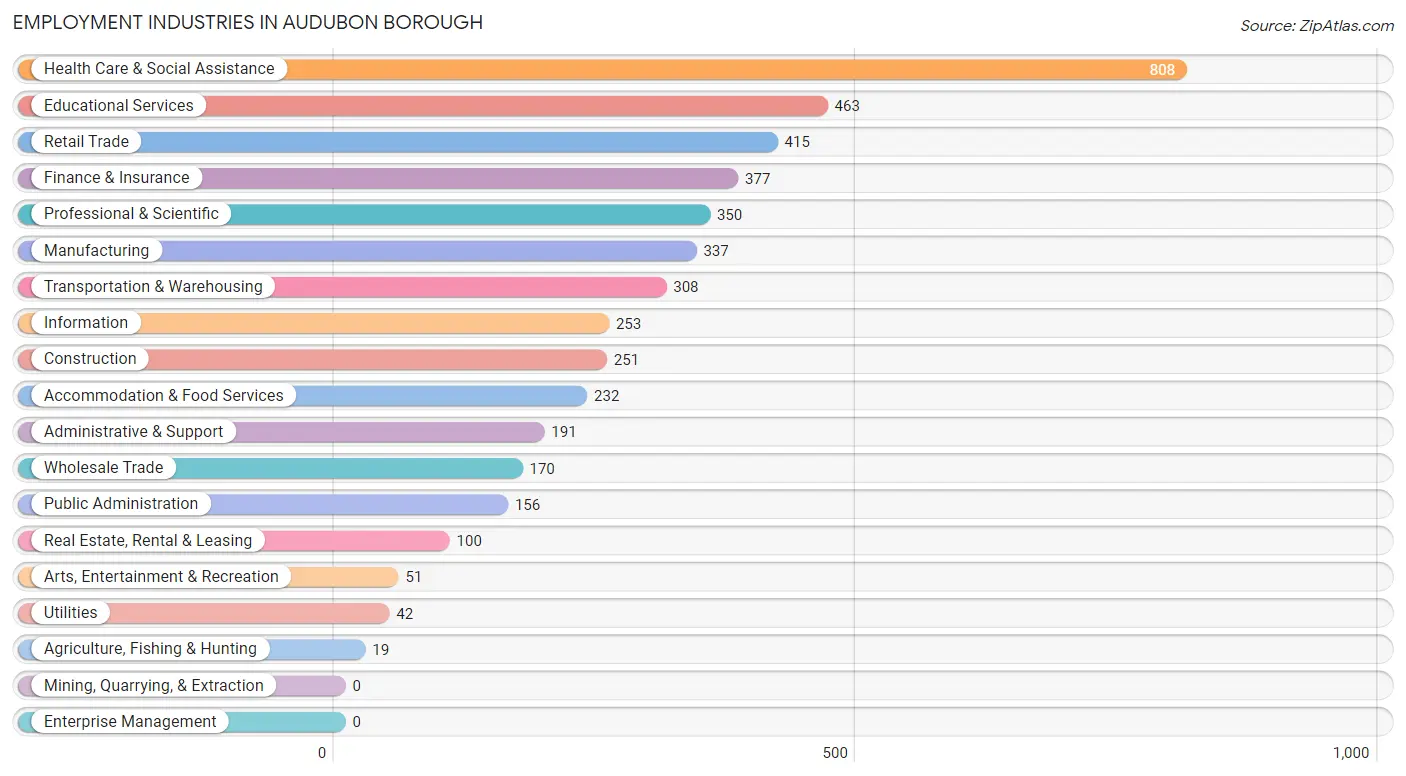
The major employment industries in Audubon borough include Health Care & Social Assistance (808 | 17.1%), Educational Services (463 | 9.8%), Retail Trade (415 | 8.8%), Finance & Insurance (377 | 8.0%), and Professional & Scientific (350 | 7.4%).
Employment Industries by Sex in Audubon borough
The Audubon borough industries that see more men than women are Construction (100.0%), Arts, Entertainment & Recreation (100.0%), and Transportation & Warehousing (84.4%), whereas the industries that tend to have a higher number of women are Health Care & Social Assistance (77.2%), Accommodation & Food Services (73.7%), and Professional & Scientific (68.0%).
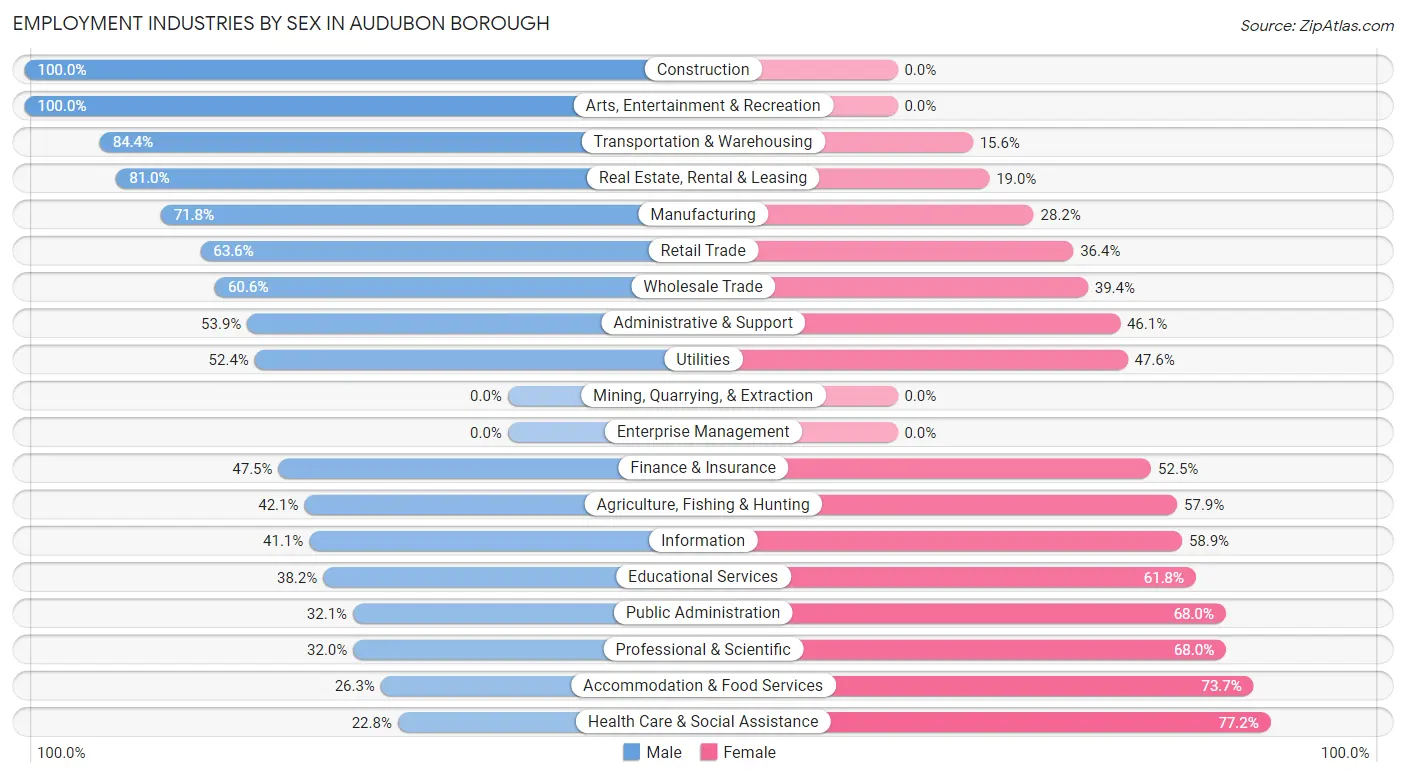
| Industry | Male | Female |
| Agriculture, Fishing & Hunting | 8 (42.1%) | 11 (57.9%) |
| Mining, Quarrying, & Extraction | 0 (0.0%) | 0 (0.0%) |
| Construction | 251 (100.0%) | 0 (0.0%) |
| Manufacturing | 242 (71.8%) | 95 (28.2%) |
| Wholesale Trade | 103 (60.6%) | 67 (39.4%) |
| Retail Trade | 264 (63.6%) | 151 (36.4%) |
| Transportation & Warehousing | 260 (84.4%) | 48 (15.6%) |
| Utilities | 22 (52.4%) | 20 (47.6%) |
| Information | 104 (41.1%) | 149 (58.9%) |
| Finance & Insurance | 179 (47.5%) | 198 (52.5%) |
| Real Estate, Rental & Leasing | 81 (81.0%) | 19 (19.0%) |
| Professional & Scientific | 112 (32.0%) | 238 (68.0%) |
| Enterprise Management | 0 (0.0%) | 0 (0.0%) |
| Administrative & Support | 103 (53.9%) | 88 (46.1%) |
| Educational Services | 177 (38.2%) | 286 (61.8%) |
| Health Care & Social Assistance | 184 (22.8%) | 624 (77.2%) |
| Arts, Entertainment & Recreation | 51 (100.0%) | 0 (0.0%) |
| Accommodation & Food Services | 61 (26.3%) | 171 (73.7%) |
| Public Administration | 50 (32.1%) | 106 (67.9%) |
| Total | 2,284 (48.4%) | 2,439 (51.6%) |
Education in Audubon borough
School Enrollment in Audubon borough
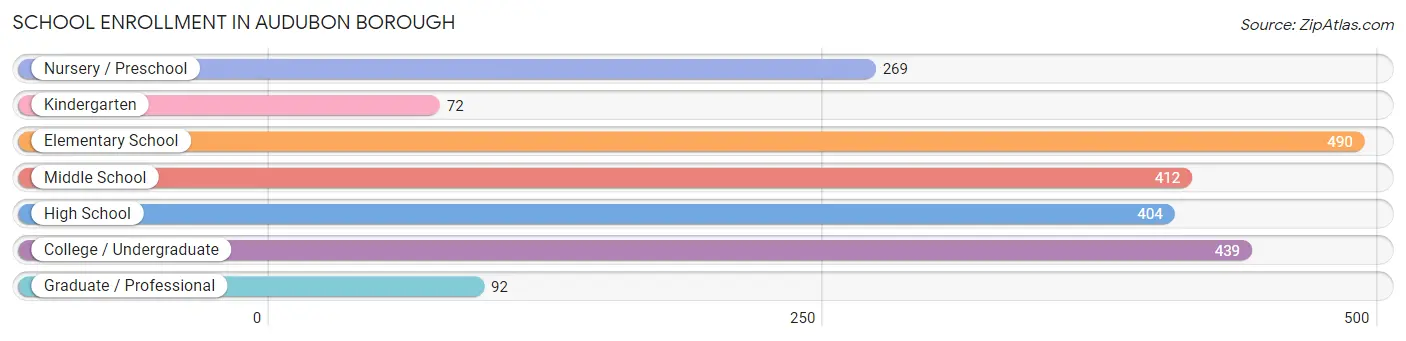
The most common levels of schooling among the 2,178 students in Audubon borough are elementary school (490 | 22.5%), college / undergraduate (439 | 20.2%), and middle school (412 | 18.9%).
| School Level | # Students | % Students |
| Nursery / Preschool | 269 | 12.3% |
| Kindergarten | 72 | 3.3% |
| Elementary School | 490 | 22.5% |
| Middle School | 412 | 18.9% |
| High School | 404 | 18.5% |
| College / Undergraduate | 439 | 20.2% |
| Graduate / Professional | 92 | 4.2% |
| Total | 2,178 | 100.0% |
School Enrollment by Age by Funding Source in Audubon borough
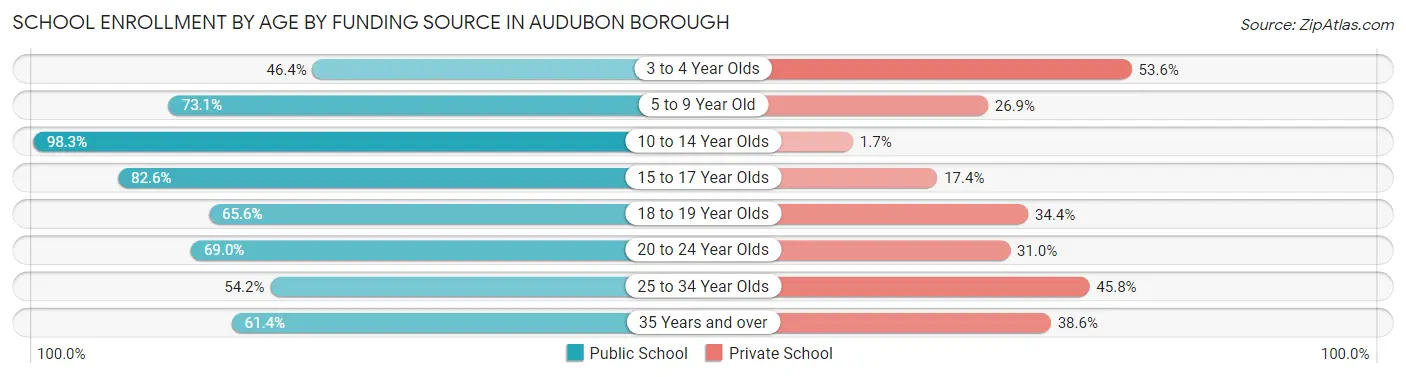
Out of a total of 2,178 students who are enrolled in schools in Audubon borough, 547 (25.1%) attend a private institution, while the remaining 1,631 (74.9%) are enrolled in public schools. The age group of 3 to 4 year olds has the highest likelihood of being enrolled in private schools, with 118 (53.6% in the age bracket) enrolled. Conversely, the age group of 10 to 14 year olds has the lowest likelihood of being enrolled in a private school, with 514 (98.3% in the age bracket) attending a public institution.
| Age Bracket | Public School | Private School |
| 3 to 4 Year Olds | 102 (46.4%) | 118 (53.6%) |
| 5 to 9 Year Old | 422 (73.1%) | 155 (26.9%) |
| 10 to 14 Year Olds | 514 (98.3%) | 9 (1.7%) |
| 15 to 17 Year Olds | 199 (82.6%) | 42 (17.4%) |
| 18 to 19 Year Olds | 107 (65.6%) | 56 (34.4%) |
| 20 to 24 Year Olds | 167 (69.0%) | 75 (31.0%) |
| 25 to 34 Year Olds | 77 (54.2%) | 65 (45.8%) |
| 35 Years and over | 43 (61.4%) | 27 (38.6%) |
| Total | 1,631 (74.9%) | 547 (25.1%) |
Educational Attainment by Field of Study in Audubon borough
Business (780 | 26.5%), science & technology (293 | 10.0%), education (277 | 9.4%), social sciences (246 | 8.4%), and psychology (196 | 6.7%) are the most common fields of study among 2,946 individuals in Audubon borough who have obtained a bachelor's degree or higher.
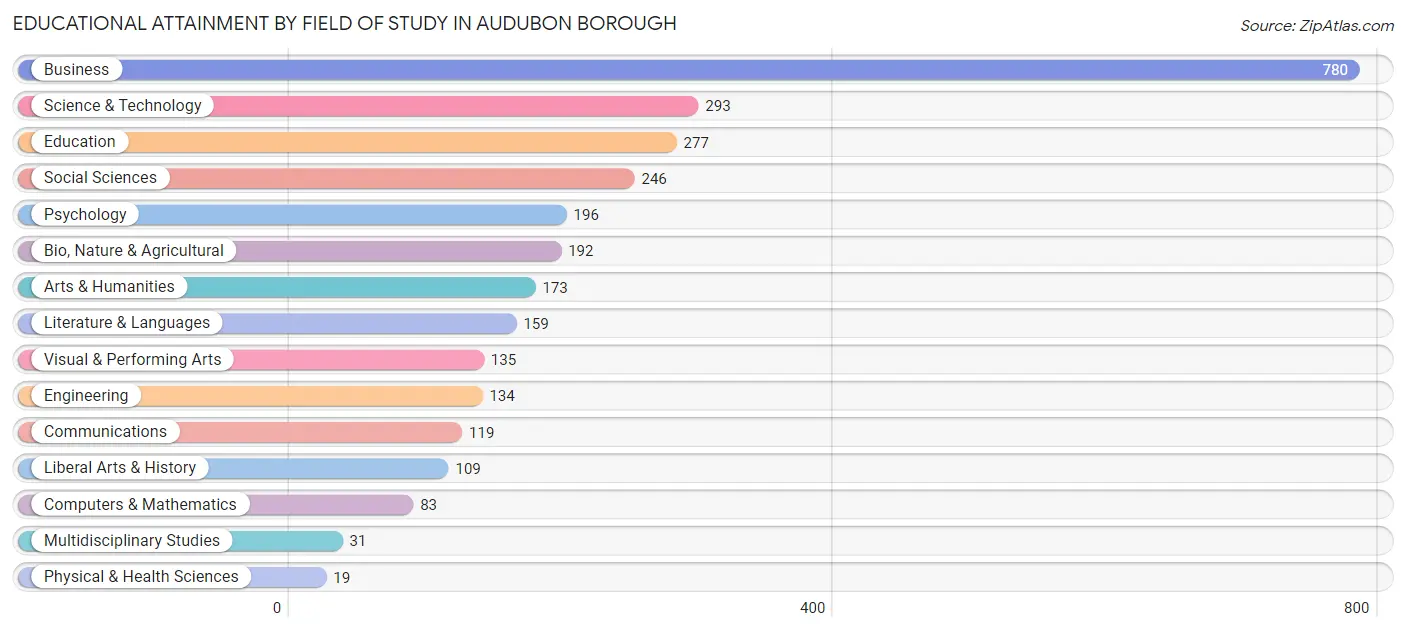
| Field of Study | # Graduates | % Graduates |
| Computers & Mathematics | 83 | 2.8% |
| Bio, Nature & Agricultural | 192 | 6.5% |
| Physical & Health Sciences | 19 | 0.6% |
| Psychology | 196 | 6.7% |
| Social Sciences | 246 | 8.4% |
| Engineering | 134 | 4.5% |
| Multidisciplinary Studies | 31 | 1.1% |
| Science & Technology | 293 | 10.0% |
| Business | 780 | 26.5% |
| Education | 277 | 9.4% |
| Literature & Languages | 159 | 5.4% |
| Liberal Arts & History | 109 | 3.7% |
| Visual & Performing Arts | 135 | 4.6% |
| Communications | 119 | 4.0% |
| Arts & Humanities | 173 | 5.9% |
| Total | 2,946 | 100.0% |
Transportation & Commute in Audubon borough
Vehicle Availability by Sex in Audubon borough
The most prevalent vehicle ownership categories in Audubon borough are males with 2 vehicles (1,147, accounting for 51.2%) and females with 2 vehicles (1,254, making up 48.9%).

| Vehicles Available | Male | Female |
| No Vehicle | 98 (4.4%) | 17 (0.7%) |
| 1 Vehicle | 189 (8.4%) | 389 (16.6%) |
| 2 Vehicles | 1,147 (51.2%) | 1,254 (53.4%) |
| 3 Vehicles | 404 (18.0%) | 404 (17.2%) |
| 4 Vehicles | 388 (17.3%) | 259 (11.0%) |
| 5 or more Vehicles | 15 (0.7%) | 24 (1.0%) |
| Total | 2,241 (100.0%) | 2,347 (100.0%) |
Commute Time in Audubon borough
The most frequently occuring commute durations in Audubon borough are 20 to 24 minutes (684 commuters, 18.2%), 15 to 19 minutes (520 commuters, 13.8%), and 25 to 29 minutes (445 commuters, 11.8%).
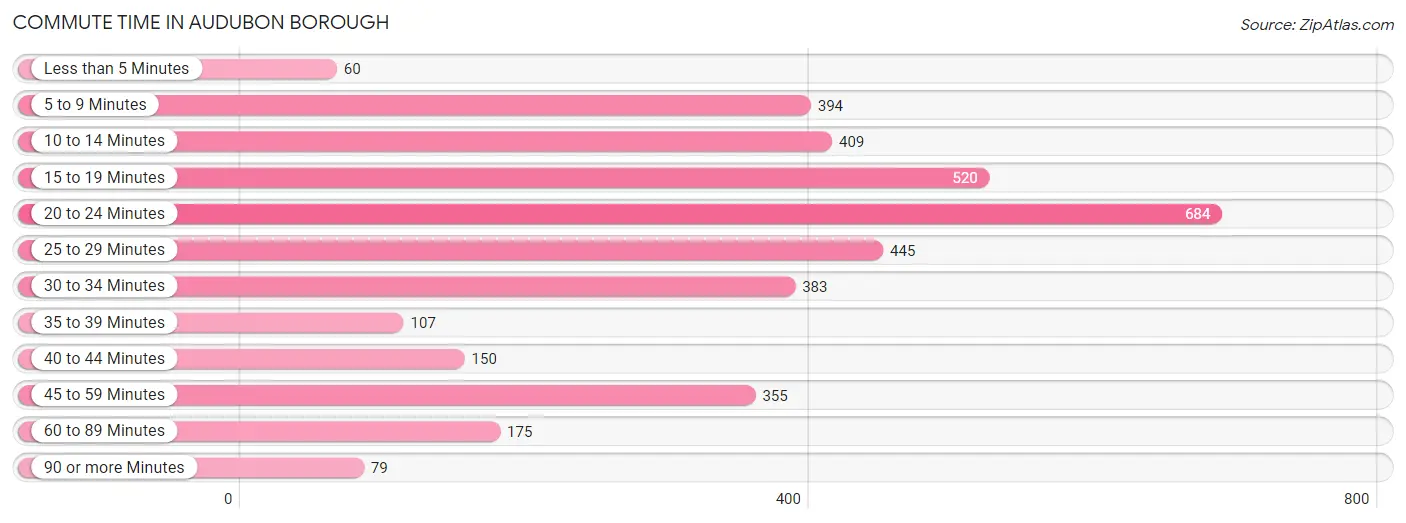
| Commute Time | # Commuters | % Commuters |
| Less than 5 Minutes | 60 | 1.6% |
| 5 to 9 Minutes | 394 | 10.5% |
| 10 to 14 Minutes | 409 | 10.9% |
| 15 to 19 Minutes | 520 | 13.8% |
| 20 to 24 Minutes | 684 | 18.2% |
| 25 to 29 Minutes | 445 | 11.8% |
| 30 to 34 Minutes | 383 | 10.2% |
| 35 to 39 Minutes | 107 | 2.8% |
| 40 to 44 Minutes | 150 | 4.0% |
| 45 to 59 Minutes | 355 | 9.4% |
| 60 to 89 Minutes | 175 | 4.6% |
| 90 or more Minutes | 79 | 2.1% |
Commute Time by Sex in Audubon borough
The most common commute times in Audubon borough are 20 to 24 minutes (331 commuters, 17.9%) for males and 20 to 24 minutes (353 commuters, 18.5%) for females.
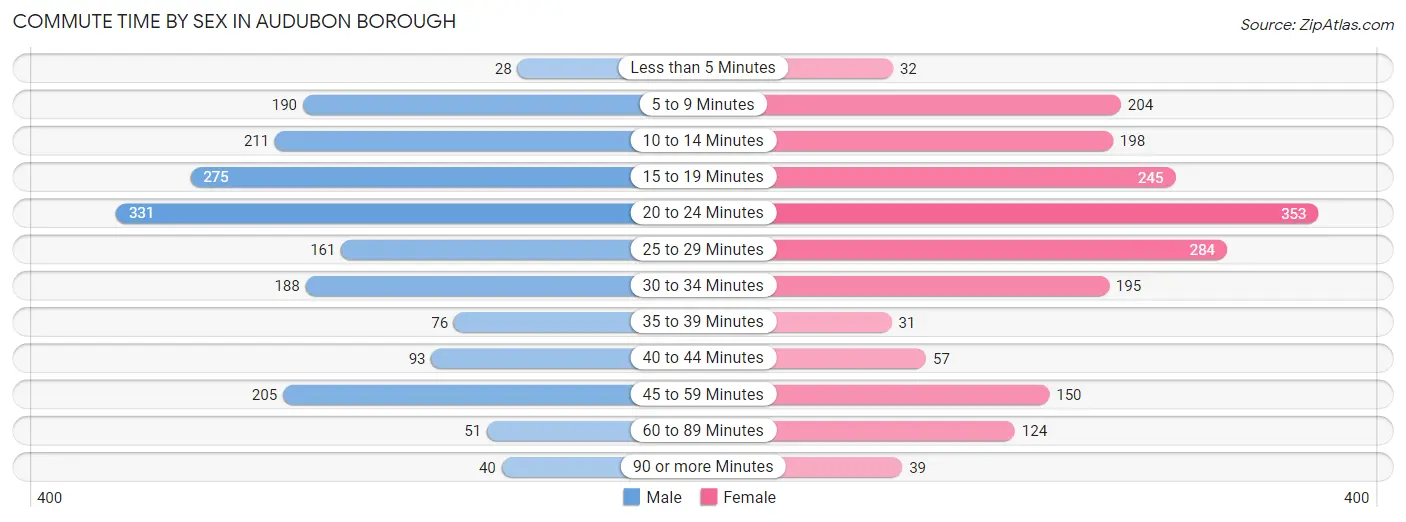
| Commute Time | Male | Female |
| Less than 5 Minutes | 28 (1.5%) | 32 (1.7%) |
| 5 to 9 Minutes | 190 (10.3%) | 204 (10.7%) |
| 10 to 14 Minutes | 211 (11.4%) | 198 (10.4%) |
| 15 to 19 Minutes | 275 (14.9%) | 245 (12.8%) |
| 20 to 24 Minutes | 331 (17.9%) | 353 (18.5%) |
| 25 to 29 Minutes | 161 (8.7%) | 284 (14.8%) |
| 30 to 34 Minutes | 188 (10.2%) | 195 (10.2%) |
| 35 to 39 Minutes | 76 (4.1%) | 31 (1.6%) |
| 40 to 44 Minutes | 93 (5.0%) | 57 (3.0%) |
| 45 to 59 Minutes | 205 (11.1%) | 150 (7.9%) |
| 60 to 89 Minutes | 51 (2.8%) | 124 (6.5%) |
| 90 or more Minutes | 40 (2.2%) | 39 (2.0%) |
Time of Departure to Work by Sex in Audubon borough
The most frequent times of departure to work in Audubon borough are 6:30 AM to 6:59 AM (319, 17.2%) for males and 7:30 AM to 7:59 AM (385, 20.1%) for females.
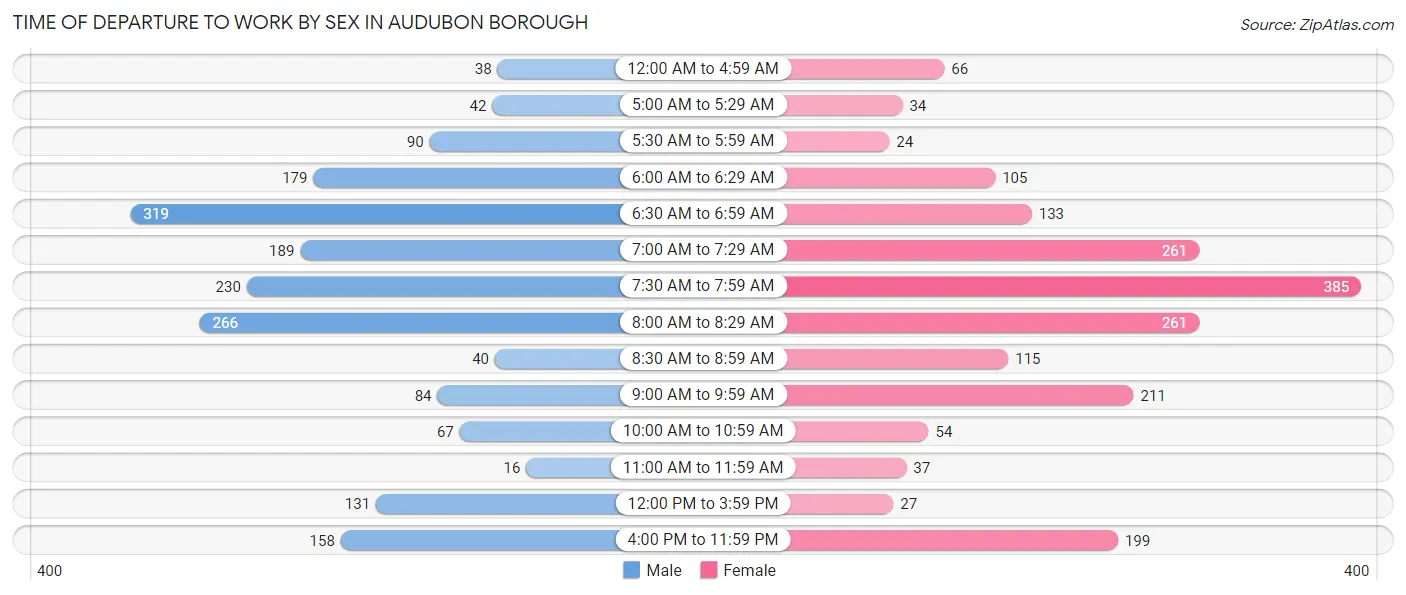
| Time of Departure | Male | Female |
| 12:00 AM to 4:59 AM | 38 (2.1%) | 66 (3.5%) |
| 5:00 AM to 5:29 AM | 42 (2.3%) | 34 (1.8%) |
| 5:30 AM to 5:59 AM | 90 (4.9%) | 24 (1.3%) |
| 6:00 AM to 6:29 AM | 179 (9.7%) | 105 (5.5%) |
| 6:30 AM to 6:59 AM | 319 (17.2%) | 133 (7.0%) |
| 7:00 AM to 7:29 AM | 189 (10.2%) | 261 (13.7%) |
| 7:30 AM to 7:59 AM | 230 (12.4%) | 385 (20.1%) |
| 8:00 AM to 8:29 AM | 266 (14.4%) | 261 (13.7%) |
| 8:30 AM to 8:59 AM | 40 (2.2%) | 115 (6.0%) |
| 9:00 AM to 9:59 AM | 84 (4.5%) | 211 (11.0%) |
| 10:00 AM to 10:59 AM | 67 (3.6%) | 54 (2.8%) |
| 11:00 AM to 11:59 AM | 16 (0.9%) | 37 (1.9%) |
| 12:00 PM to 3:59 PM | 131 (7.1%) | 27 (1.4%) |
| 4:00 PM to 11:59 PM | 158 (8.6%) | 199 (10.4%) |
| Total | 1,849 (100.0%) | 1,912 (100.0%) |
Housing Occupancy in Audubon borough
Occupancy by Ownership in Audubon borough
Of the total 3,329 dwellings in Audubon borough, owner-occupied units account for 2,413 (72.5%), while renter-occupied units make up 916 (27.5%).
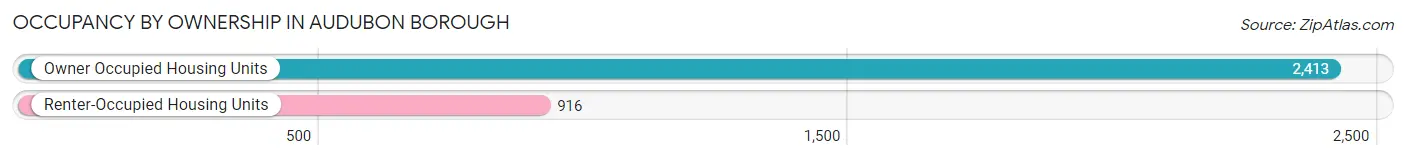
| Occupancy | # Housing Units | % Housing Units |
| Owner Occupied Housing Units | 2,413 | 72.5% |
| Renter-Occupied Housing Units | 916 | 27.5% |
| Total Occupied Housing Units | 3,329 | 100.0% |
Occupancy by Household Size in Audubon borough
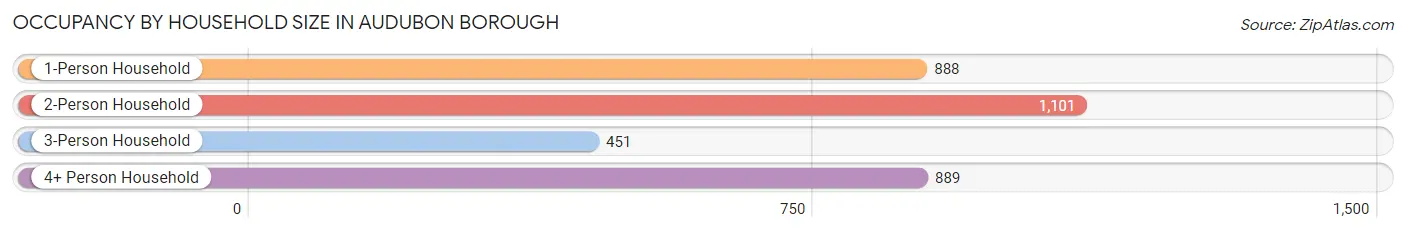
| Household Size | # Housing Units | % Housing Units |
| 1-Person Household | 888 | 26.7% |
| 2-Person Household | 1,101 | 33.1% |
| 3-Person Household | 451 | 13.6% |
| 4+ Person Household | 889 | 26.7% |
| Total Housing Units | 3,329 | 100.0% |
Occupancy by Ownership by Household Size in Audubon borough
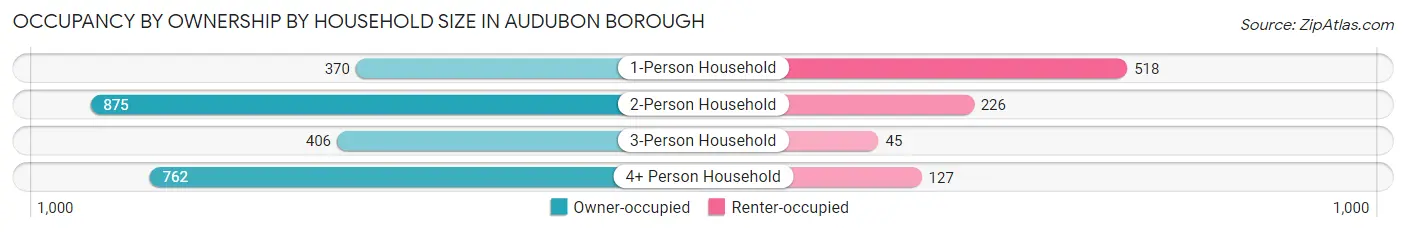
| Household Size | Owner-occupied | Renter-occupied |
| 1-Person Household | 370 (41.7%) | 518 (58.3%) |
| 2-Person Household | 875 (79.5%) | 226 (20.5%) |
| 3-Person Household | 406 (90.0%) | 45 (10.0%) |
| 4+ Person Household | 762 (85.7%) | 127 (14.3%) |
| Total Housing Units | 2,413 (72.5%) | 916 (27.5%) |
Occupancy by Educational Attainment in Audubon borough
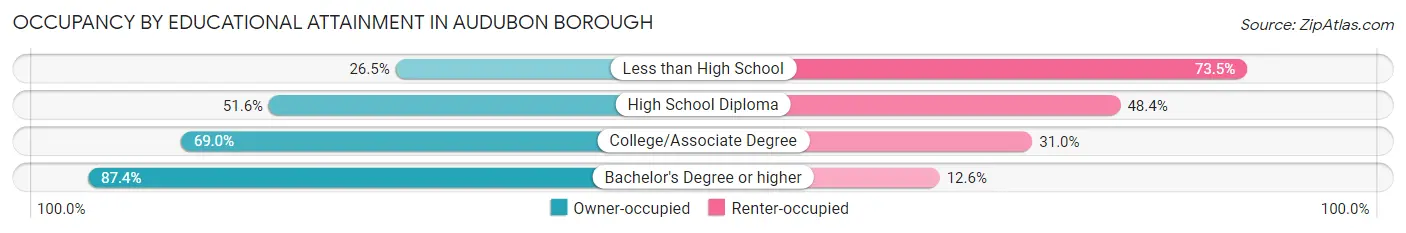
| Household Size | Owner-occupied | Renter-occupied |
| Less than High School | 18 (26.5%) | 50 (73.5%) |
| High School Diploma | 431 (51.6%) | 405 (48.4%) |
| College/Associate Degree | 584 (69.0%) | 262 (31.0%) |
| Bachelor's Degree or higher | 1,380 (87.4%) | 199 (12.6%) |
Occupancy by Age of Householder in Audubon borough
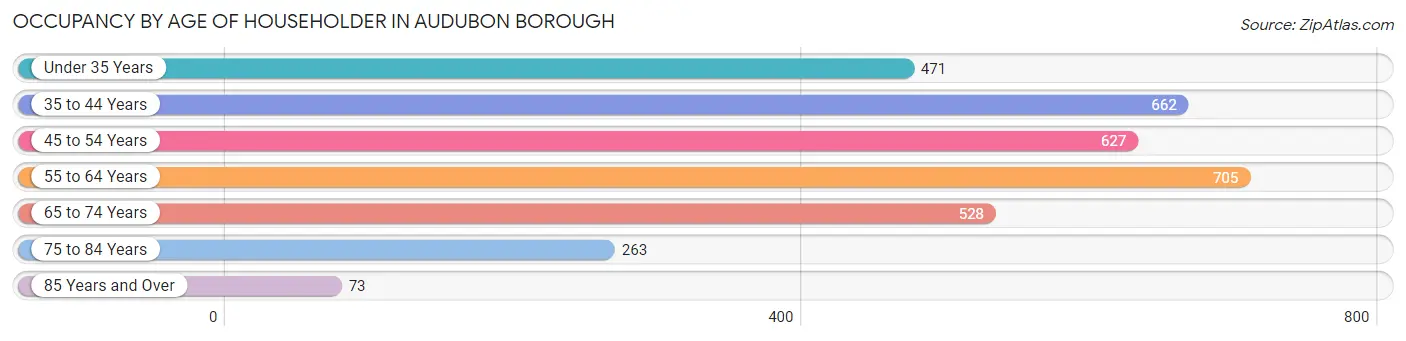
| Age Bracket | # Households | % Households |
| Under 35 Years | 471 | 14.1% |
| 35 to 44 Years | 662 | 19.9% |
| 45 to 54 Years | 627 | 18.8% |
| 55 to 64 Years | 705 | 21.2% |
| 65 to 74 Years | 528 | 15.9% |
| 75 to 84 Years | 263 | 7.9% |
| 85 Years and Over | 73 | 2.2% |
| Total | 3,329 | 100.0% |
Housing Finances in Audubon borough
Median Income by Occupancy in Audubon borough
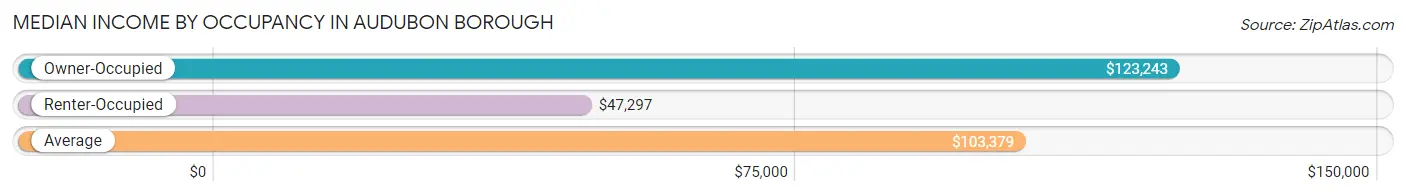
| Occupancy Type | # Households | Median Income |
| Owner-Occupied | 2,413 (72.5%) | $123,243 |
| Renter-Occupied | 916 (27.5%) | $47,297 |
| Average | 3,329 (100.0%) | $103,379 |
Occupancy by Householder Income Bracket in Audubon borough
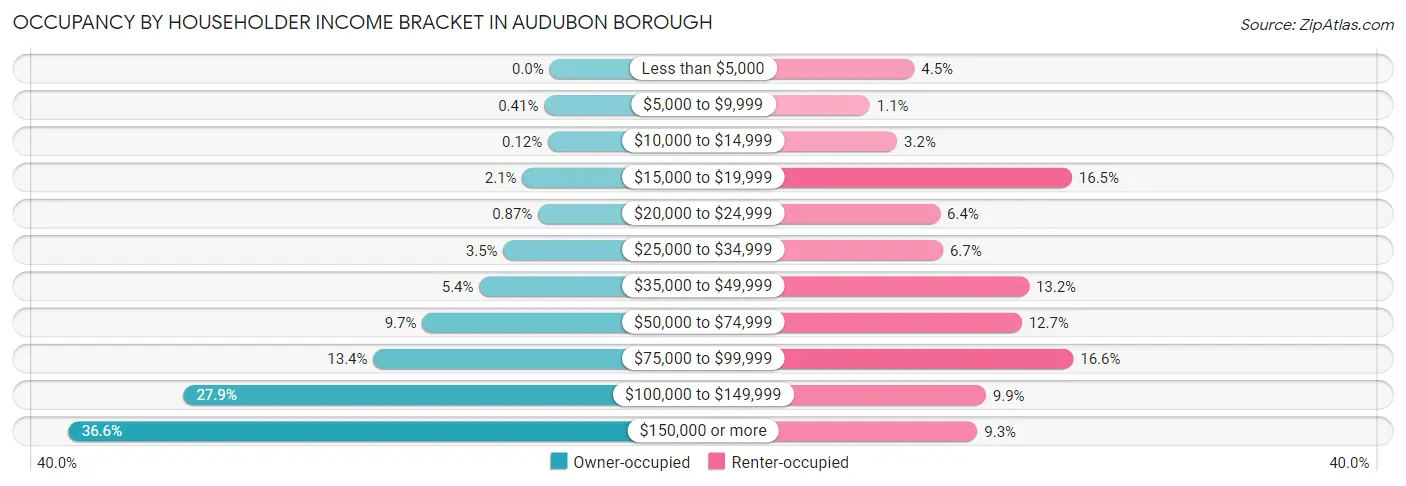
| Income Bracket | Owner-occupied | Renter-occupied |
| Less than $5,000 | 0 (0.0%) | 41 (4.5%) |
| $5,000 to $9,999 | 10 (0.4%) | 10 (1.1%) |
| $10,000 to $14,999 | 3 (0.1%) | 29 (3.2%) |
| $15,000 to $19,999 | 50 (2.1%) | 151 (16.5%) |
| $20,000 to $24,999 | 21 (0.9%) | 59 (6.4%) |
| $25,000 to $34,999 | 85 (3.5%) | 61 (6.7%) |
| $35,000 to $49,999 | 129 (5.3%) | 121 (13.2%) |
| $50,000 to $74,999 | 234 (9.7%) | 116 (12.7%) |
| $75,000 to $99,999 | 324 (13.4%) | 152 (16.6%) |
| $100,000 to $149,999 | 673 (27.9%) | 91 (9.9%) |
| $150,000 or more | 884 (36.6%) | 85 (9.3%) |
| Total | 2,413 (100.0%) | 916 (100.0%) |
Monthly Housing Cost Tiers in Audubon borough
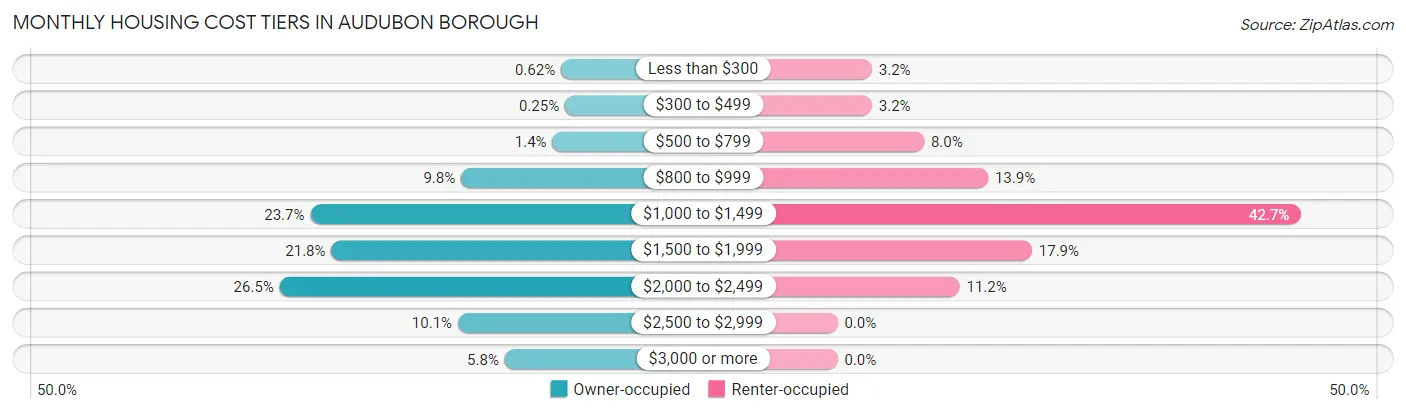
| Monthly Cost | Owner-occupied | Renter-occupied |
| Less than $300 | 15 (0.6%) | 29 (3.2%) |
| $300 to $499 | 6 (0.3%) | 29 (3.2%) |
| $500 to $799 | 34 (1.4%) | 73 (8.0%) |
| $800 to $999 | 237 (9.8%) | 127 (13.9%) |
| $1,000 to $1,499 | 572 (23.7%) | 391 (42.7%) |
| $1,500 to $1,999 | 525 (21.8%) | 164 (17.9%) |
| $2,000 to $2,499 | 640 (26.5%) | 103 (11.2%) |
| $2,500 to $2,999 | 244 (10.1%) | 0 (0.0%) |
| $3,000 or more | 140 (5.8%) | 0 (0.0%) |
| Total | 2,413 (100.0%) | 916 (100.0%) |
Physical Housing Characteristics in Audubon borough
Housing Structures in Audubon borough
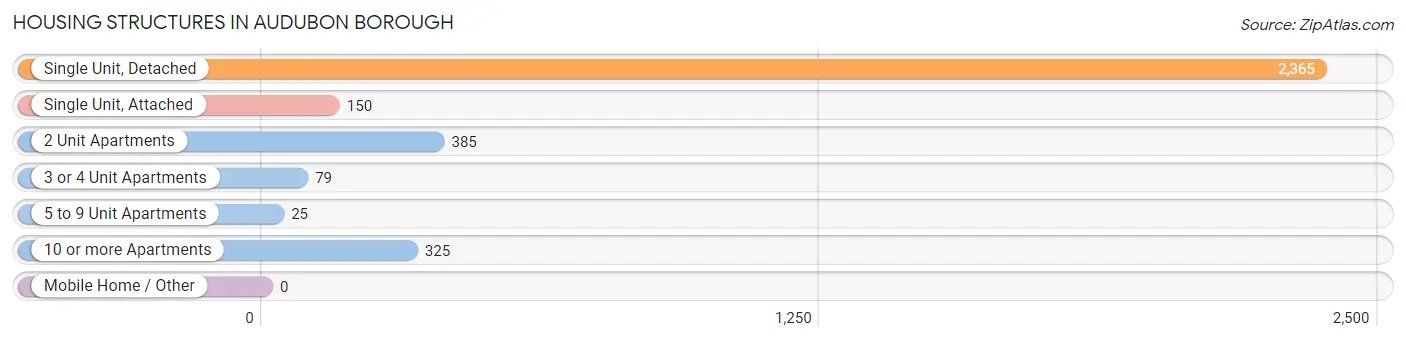
| Structure Type | # Housing Units | % Housing Units |
| Single Unit, Detached | 2,365 | 71.0% |
| Single Unit, Attached | 150 | 4.5% |
| 2 Unit Apartments | 385 | 11.6% |
| 3 or 4 Unit Apartments | 79 | 2.4% |
| 5 to 9 Unit Apartments | 25 | 0.7% |
| 10 or more Apartments | 325 | 9.8% |
| Mobile Home / Other | 0 | 0.0% |
| Total | 3,329 | 100.0% |
Housing Structures by Occupancy in Audubon borough
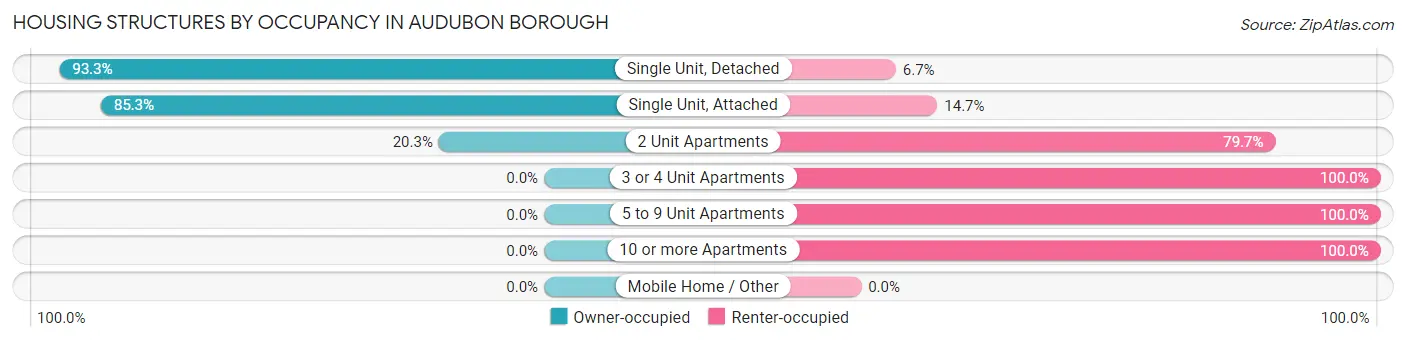
| Structure Type | Owner-occupied | Renter-occupied |
| Single Unit, Detached | 2,207 (93.3%) | 158 (6.7%) |
| Single Unit, Attached | 128 (85.3%) | 22 (14.7%) |
| 2 Unit Apartments | 78 (20.3%) | 307 (79.7%) |
| 3 or 4 Unit Apartments | 0 (0.0%) | 79 (100.0%) |
| 5 to 9 Unit Apartments | 0 (0.0%) | 25 (100.0%) |
| 10 or more Apartments | 0 (0.0%) | 325 (100.0%) |
| Mobile Home / Other | 0 (0.0%) | 0 (0.0%) |
| Total | 2,413 (72.5%) | 916 (27.5%) |
Housing Structures by Number of Rooms in Audubon borough
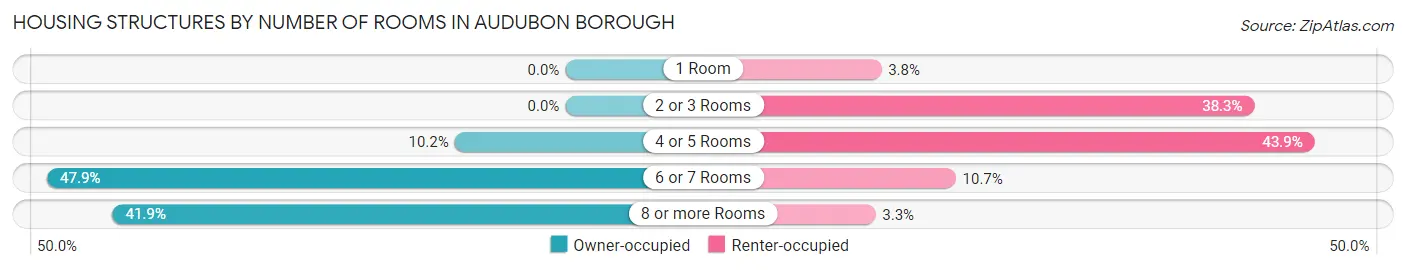
| Number of Rooms | Owner-occupied | Renter-occupied |
| 1 Room | 0 (0.0%) | 35 (3.8%) |
| 2 or 3 Rooms | 0 (0.0%) | 351 (38.3%) |
| 4 or 5 Rooms | 247 (10.2%) | 402 (43.9%) |
| 6 or 7 Rooms | 1,156 (47.9%) | 98 (10.7%) |
| 8 or more Rooms | 1,010 (41.9%) | 30 (3.3%) |
| Total | 2,413 (100.0%) | 916 (100.0%) |
Housing Structure by Heating Type in Audubon borough
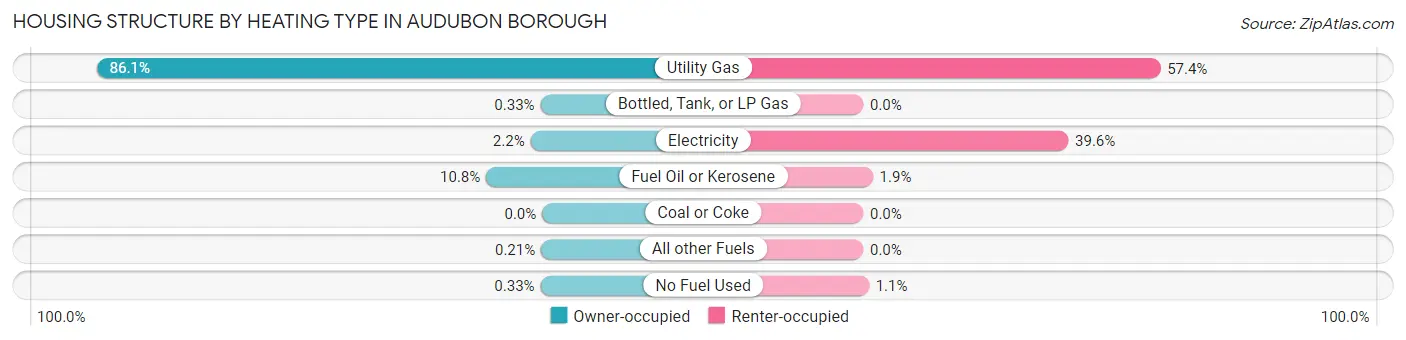
| Heating Type | Owner-occupied | Renter-occupied |
| Utility Gas | 2,077 (86.1%) | 526 (57.4%) |
| Bottled, Tank, or LP Gas | 8 (0.3%) | 0 (0.0%) |
| Electricity | 54 (2.2%) | 363 (39.6%) |
| Fuel Oil or Kerosene | 261 (10.8%) | 17 (1.9%) |
| Coal or Coke | 0 (0.0%) | 0 (0.0%) |
| All other Fuels | 5 (0.2%) | 0 (0.0%) |
| No Fuel Used | 8 (0.3%) | 10 (1.1%) |
| Total | 2,413 (100.0%) | 916 (100.0%) |
Household Vehicle Usage in Audubon borough
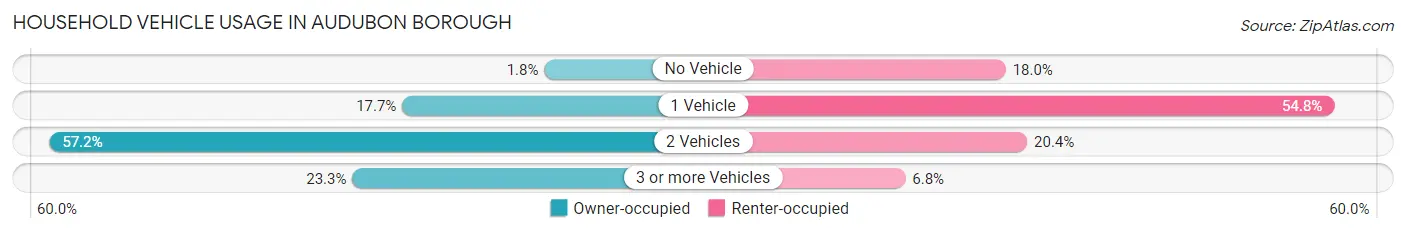
| Vehicles per Household | Owner-occupied | Renter-occupied |
| No Vehicle | 43 (1.8%) | 165 (18.0%) |
| 1 Vehicle | 427 (17.7%) | 502 (54.8%) |
| 2 Vehicles | 1,381 (57.2%) | 187 (20.4%) |
| 3 or more Vehicles | 562 (23.3%) | 62 (6.8%) |
| Total | 2,413 (100.0%) | 916 (100.0%) |
Real Estate & Mortgages in Audubon borough
Real Estate and Mortgage Overview in Audubon borough
| Characteristic | Without Mortgage | With Mortgage |
| Housing Units | 736 | 1,677 |
| Median Property Value | $263,900 | $290,300 |
| Median Household Income | $98,816 | $667 |
| Monthly Housing Costs | $1,120 | $140 |
| Real Estate Taxes | $7,956 | $20 |
Property Value by Mortgage Status in Audubon borough
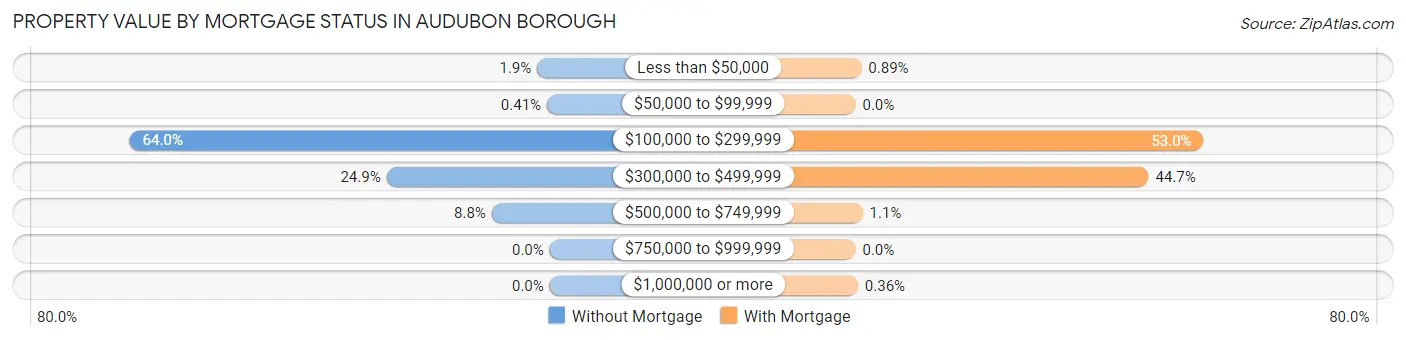
| Property Value | Without Mortgage | With Mortgage |
| Less than $50,000 | 14 (1.9%) | 15 (0.9%) |
| $50,000 to $99,999 | 3 (0.4%) | 0 (0.0%) |
| $100,000 to $299,999 | 471 (64.0%) | 889 (53.0%) |
| $300,000 to $499,999 | 183 (24.9%) | 749 (44.7%) |
| $500,000 to $749,999 | 65 (8.8%) | 18 (1.1%) |
| $750,000 to $999,999 | 0 (0.0%) | 0 (0.0%) |
| $1,000,000 or more | 0 (0.0%) | 6 (0.4%) |
| Total | 736 (100.0%) | 1,677 (100.0%) |
Household Income by Mortgage Status in Audubon borough
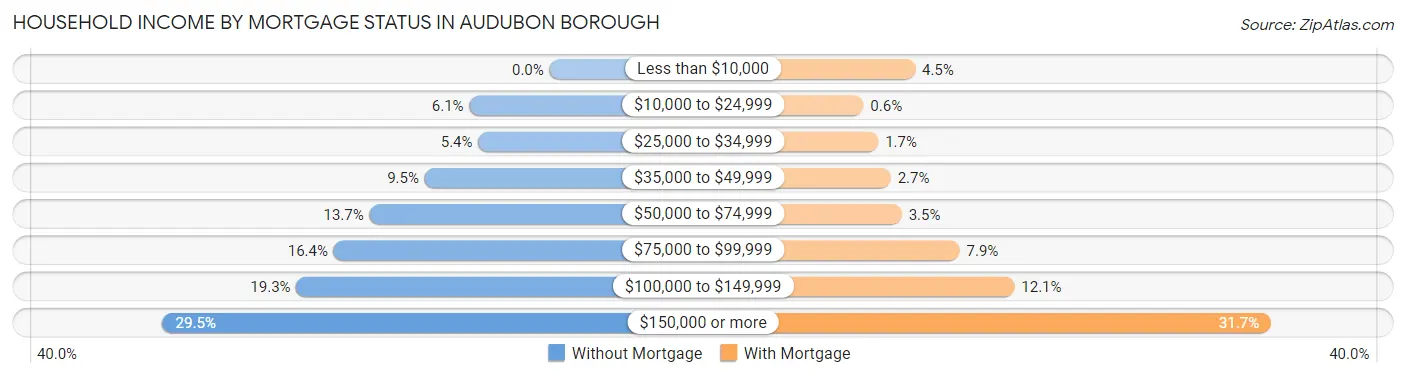
| Household Income | Without Mortgage | With Mortgage |
| Less than $10,000 | 0 (0.0%) | 76 (4.5%) |
| $10,000 to $24,999 | 45 (6.1%) | 10 (0.6%) |
| $25,000 to $34,999 | 40 (5.4%) | 29 (1.7%) |
| $35,000 to $49,999 | 70 (9.5%) | 45 (2.7%) |
| $50,000 to $74,999 | 101 (13.7%) | 59 (3.5%) |
| $75,000 to $99,999 | 121 (16.4%) | 133 (7.9%) |
| $100,000 to $149,999 | 142 (19.3%) | 203 (12.1%) |
| $150,000 or more | 217 (29.5%) | 531 (31.7%) |
| Total | 736 (100.0%) | 1,677 (100.0%) |
Property Value to Household Income Ratio in Audubon borough
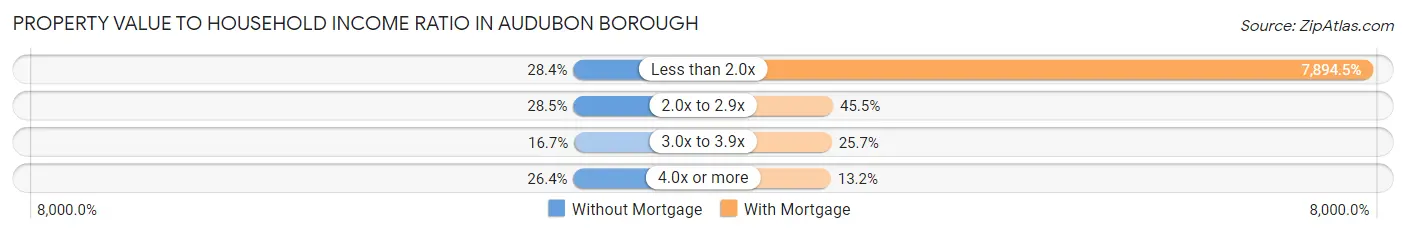
| Value-to-Income Ratio | Without Mortgage | With Mortgage |
| Less than 2.0x | 209 (28.4%) | 132,390 (7,894.5%) |
| 2.0x to 2.9x | 210 (28.5%) | 763 (45.5%) |
| 3.0x to 3.9x | 123 (16.7%) | 431 (25.7%) |
| 4.0x or more | 194 (26.4%) | 222 (13.2%) |
| Total | 736 (100.0%) | 1,677 (100.0%) |
Real Estate Taxes by Mortgage Status in Audubon borough
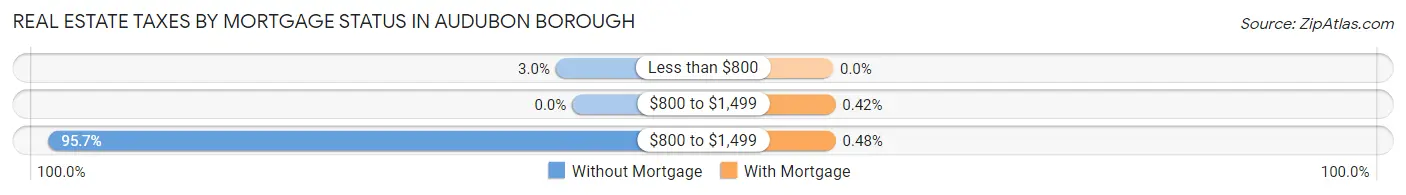
| Property Taxes | Without Mortgage | With Mortgage |
| Less than $800 | 22 (3.0%) | 0 (0.0%) |
| $800 to $1,499 | 0 (0.0%) | 7 (0.4%) |
| $800 to $1,499 | 704 (95.7%) | 8 (0.5%) |
| Total | 736 (100.0%) | 1,677 (100.0%) |
Health & Disability in Audubon borough
Health Insurance Coverage by Age in Audubon borough
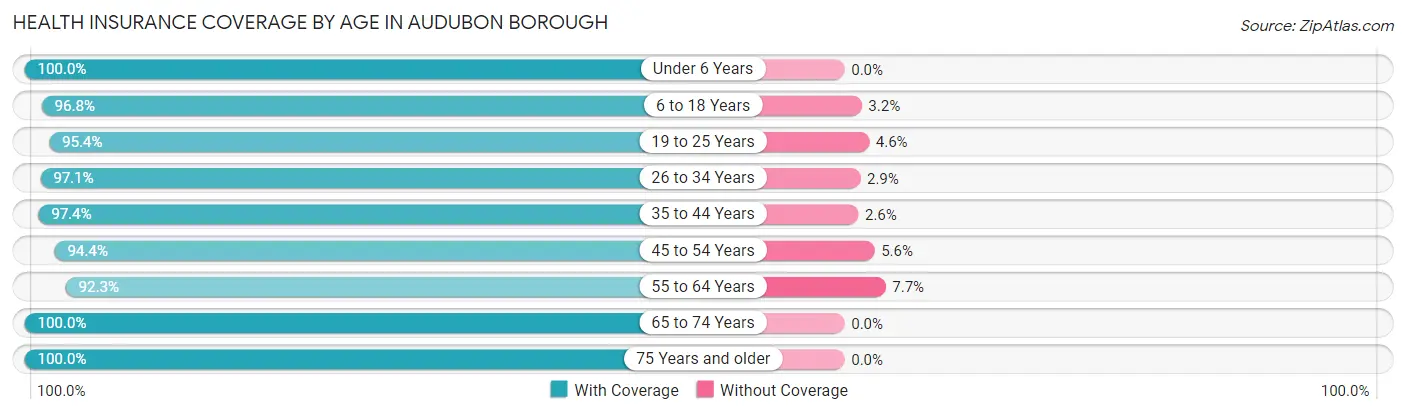
| Age Bracket | With Coverage | Without Coverage |
| Under 6 Years | 755 (100.0%) | 0 (0.0%) |
| 6 to 18 Years | 1,427 (96.8%) | 47 (3.2%) |
| 19 to 25 Years | 479 (95.4%) | 23 (4.6%) |
| 26 to 34 Years | 1,028 (97.1%) | 31 (2.9%) |
| 35 to 44 Years | 1,296 (97.4%) | 34 (2.6%) |
| 45 to 54 Years | 913 (94.4%) | 54 (5.6%) |
| 55 to 64 Years | 1,182 (92.3%) | 98 (7.7%) |
| 65 to 74 Years | 819 (100.0%) | 0 (0.0%) |
| 75 Years and older | 493 (100.0%) | 0 (0.0%) |
| Total | 8,392 (96.7%) | 287 (3.3%) |
Health Insurance Coverage by Citizenship Status in Audubon borough
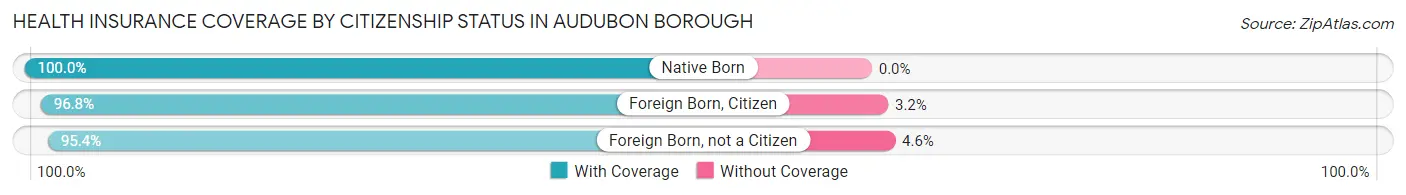
| Citizenship Status | With Coverage | Without Coverage |
| Native Born | 755 (100.0%) | 0 (0.0%) |
| Foreign Born, Citizen | 1,427 (96.8%) | 47 (3.2%) |
| Foreign Born, not a Citizen | 479 (95.4%) | 23 (4.6%) |
Health Insurance Coverage by Household Income in Audubon borough
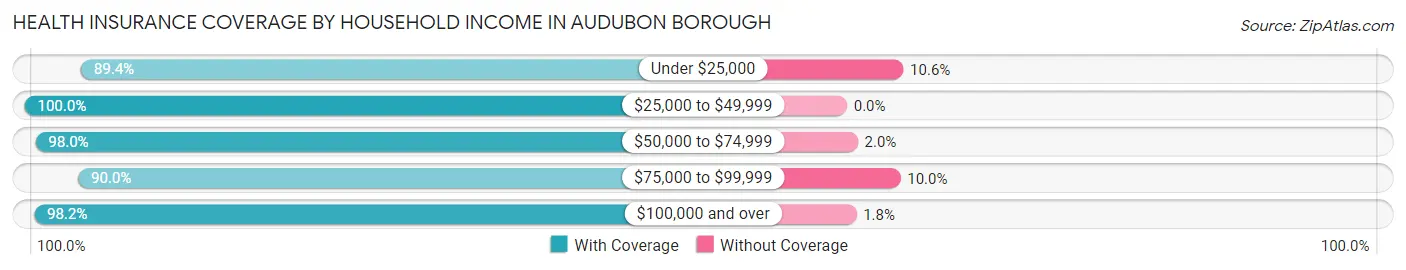
| Household Income | With Coverage | Without Coverage |
| Under $25,000 | 415 (89.4%) | 49 (10.6%) |
| $25,000 to $49,999 | 631 (100.0%) | 0 (0.0%) |
| $50,000 to $74,999 | 772 (98.0%) | 16 (2.0%) |
| $75,000 to $99,999 | 1,113 (90.0%) | 124 (10.0%) |
| $100,000 and over | 5,438 (98.2%) | 98 (1.8%) |
Public vs Private Health Insurance Coverage by Age in Audubon borough
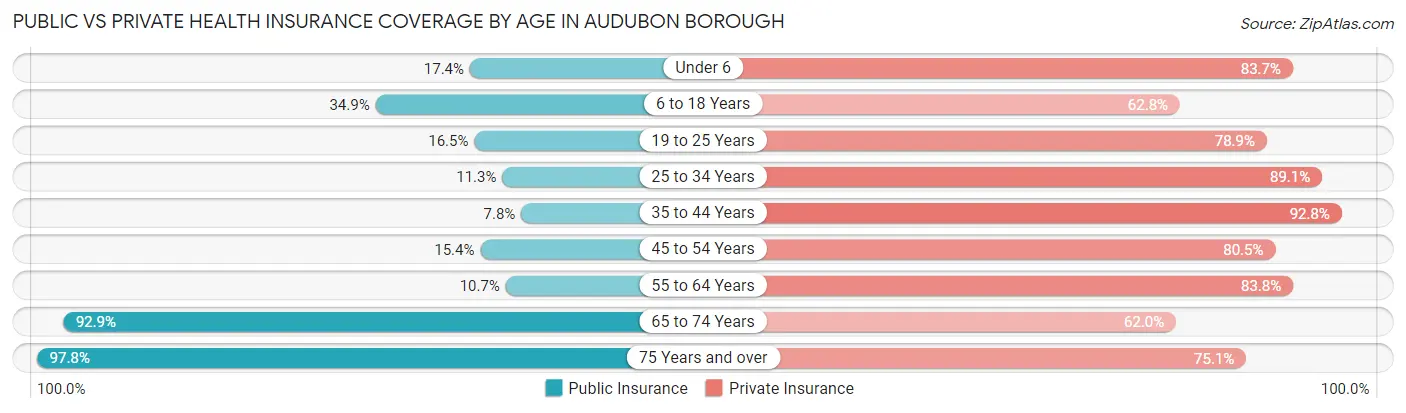
| Age Bracket | Public Insurance | Private Insurance |
| Under 6 | 131 (17.3%) | 632 (83.7%) |
| 6 to 18 Years | 514 (34.9%) | 925 (62.7%) |
| 19 to 25 Years | 83 (16.5%) | 396 (78.9%) |
| 25 to 34 Years | 120 (11.3%) | 944 (89.1%) |
| 35 to 44 Years | 104 (7.8%) | 1,234 (92.8%) |
| 45 to 54 Years | 149 (15.4%) | 778 (80.5%) |
| 55 to 64 Years | 137 (10.7%) | 1,072 (83.8%) |
| 65 to 74 Years | 761 (92.9%) | 508 (62.0%) |
| 75 Years and over | 482 (97.8%) | 370 (75.0%) |
| Total | 2,481 (28.6%) | 6,859 (79.0%) |
Disability Status by Sex by Age in Audubon borough
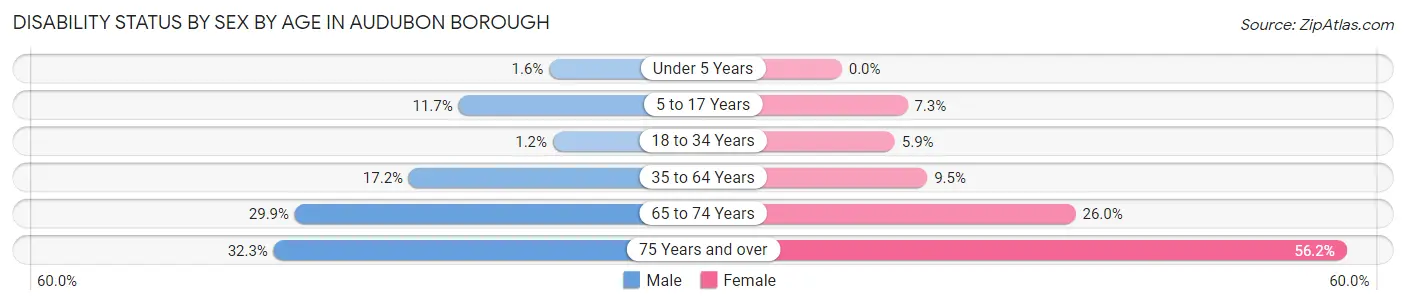
| Age Bracket | Male | Female |
| Under 5 Years | 7 (1.6%) | 0 (0.0%) |
| 5 to 17 Years | 76 (11.7%) | 55 (7.3%) |
| 18 to 34 Years | 10 (1.2%) | 52 (5.9%) |
| 35 to 64 Years | 286 (17.2%) | 182 (9.5%) |
| 65 to 74 Years | 122 (29.9%) | 107 (26.0%) |
| 75 Years and over | 50 (32.3%) | 190 (56.2%) |
Disability Class by Sex by Age in Audubon borough
Disability Class: Hearing Difficulty
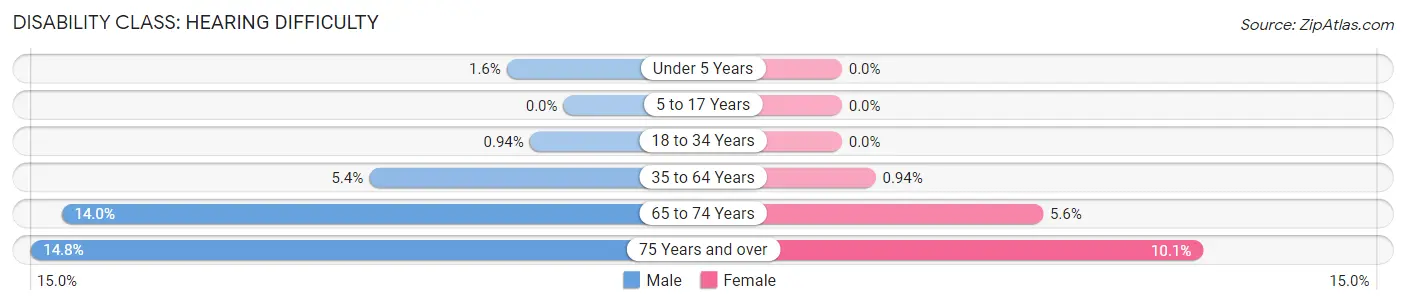
| Age Bracket | Male | Female |
| Under 5 Years | 7 (1.6%) | 0 (0.0%) |
| 5 to 17 Years | 0 (0.0%) | 0 (0.0%) |
| 18 to 34 Years | 8 (0.9%) | 0 (0.0%) |
| 35 to 64 Years | 90 (5.4%) | 18 (0.9%) |
| 65 to 74 Years | 57 (14.0%) | 23 (5.6%) |
| 75 Years and over | 23 (14.8%) | 34 (10.1%) |
Disability Class: Vision Difficulty
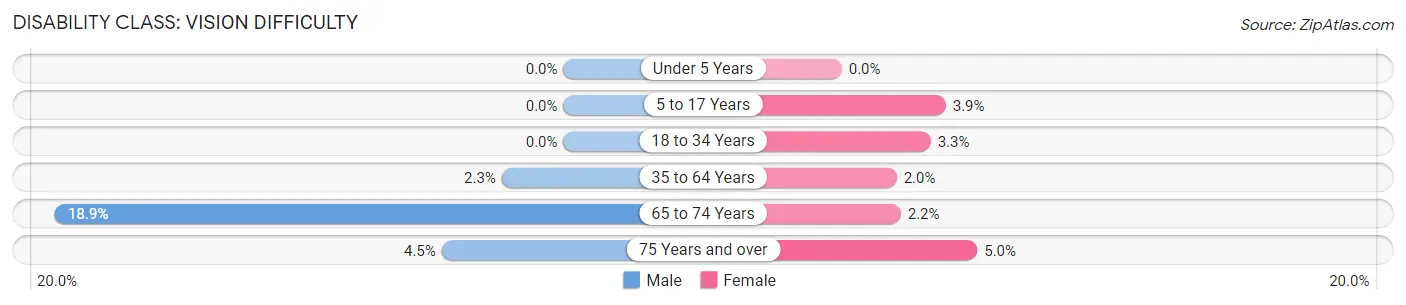
| Age Bracket | Male | Female |
| Under 5 Years | 0 (0.0%) | 0 (0.0%) |
| 5 to 17 Years | 0 (0.0%) | 29 (3.9%) |
| 18 to 34 Years | 0 (0.0%) | 29 (3.3%) |
| 35 to 64 Years | 38 (2.3%) | 39 (2.0%) |
| 65 to 74 Years | 77 (18.9%) | 9 (2.2%) |
| 75 Years and over | 7 (4.5%) | 17 (5.0%) |
Disability Class: Cognitive Difficulty
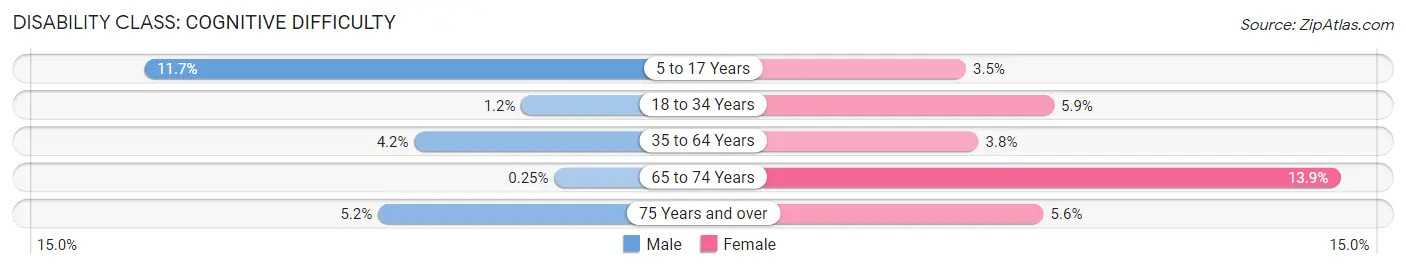
| Age Bracket | Male | Female |
| 5 to 17 Years | 76 (11.7%) | 26 (3.5%) |
| 18 to 34 Years | 10 (1.2%) | 52 (5.9%) |
| 35 to 64 Years | 69 (4.2%) | 73 (3.8%) |
| 65 to 74 Years | 1 (0.3%) | 57 (13.9%) |
| 75 Years and over | 8 (5.2%) | 19 (5.6%) |
Disability Class: Ambulatory Difficulty
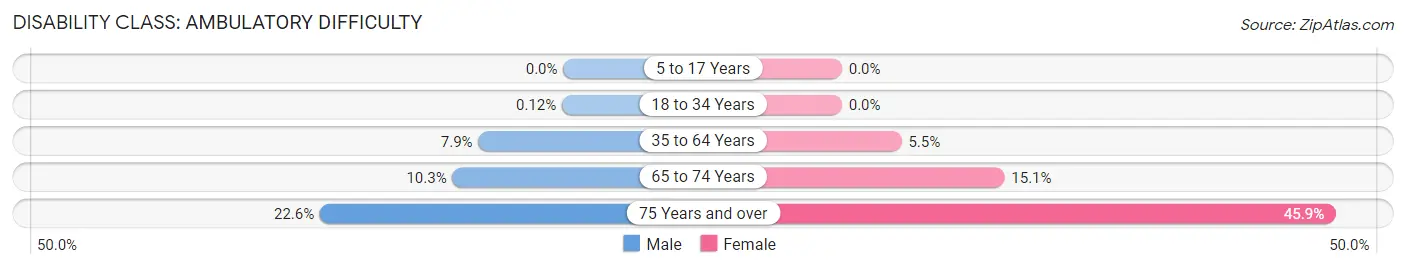
| Age Bracket | Male | Female |
| 5 to 17 Years | 0 (0.0%) | 0 (0.0%) |
| 18 to 34 Years | 1 (0.1%) | 0 (0.0%) |
| 35 to 64 Years | 131 (7.9%) | 106 (5.5%) |
| 65 to 74 Years | 42 (10.3%) | 62 (15.1%) |
| 75 Years and over | 35 (22.6%) | 155 (45.9%) |
Disability Class: Self-Care Difficulty
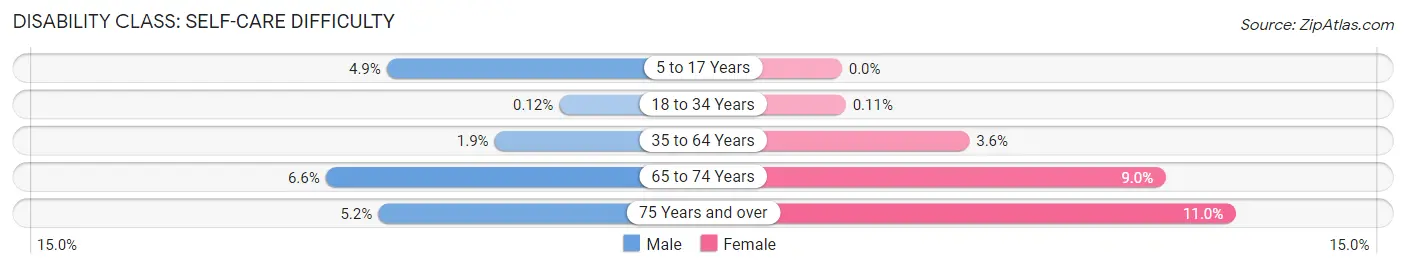
| Age Bracket | Male | Female |
| 5 to 17 Years | 32 (4.9%) | 0 (0.0%) |
| 18 to 34 Years | 1 (0.1%) | 1 (0.1%) |
| 35 to 64 Years | 32 (1.9%) | 68 (3.5%) |
| 65 to 74 Years | 27 (6.6%) | 37 (9.0%) |
| 75 Years and over | 8 (5.2%) | 37 (11.0%) |
Technology Access in Audubon borough
Computing Device Access in Audubon borough
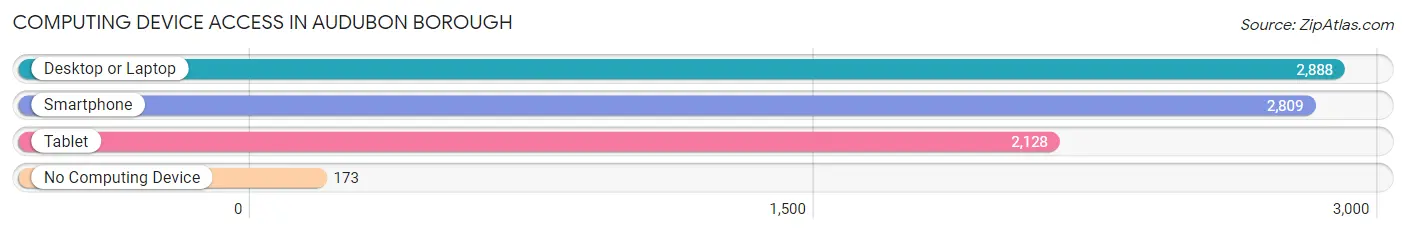
| Device Type | # Households | % Households |
| Desktop or Laptop | 2,888 | 86.8% |
| Smartphone | 2,809 | 84.4% |
| Tablet | 2,128 | 63.9% |
| No Computing Device | 173 | 5.2% |
| Total | 3,329 | 100.0% |
Internet Access in Audubon borough
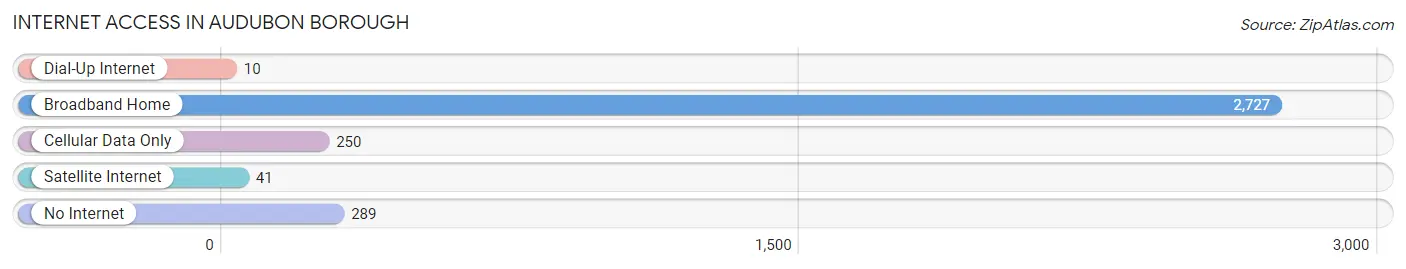
| Internet Type | # Households | % Households |
| Dial-Up Internet | 10 | 0.3% |
| Broadband Home | 2,727 | 81.9% |
| Cellular Data Only | 250 | 7.5% |
| Satellite Internet | 41 | 1.2% |
| No Internet | 289 | 8.7% |
| Total | 3,329 | 100.0% |
Audubon borough Summary
Audubon Borough is a small borough located in Camden County, New Jersey. It is situated on the east side of the Delaware River, just north of Philadelphia. The borough was incorporated in 1905 and is home to a population of 8,819 people as of the 2010 census.
Geography
Audubon Borough is located at 39°55'45" North, 75°3'45" West (39.929167, -75.0625). It is bordered by the townships of Haddon, Haddonfield, and Oaklyn. The borough is situated on the east side of the Delaware River, just north of Philadelphia. The total area of the borough is 0.9 square miles, all of which is land.
Climate
Audubon Borough has a humid subtropical climate, with hot, humid summers and cold, wet winters. The average temperature in the summer is around 80°F, while in the winter it is around 40°F. The average annual precipitation is around 44 inches.
Demographics
As of the 2010 census, there were 8,819 people, 3,541 households, and 2,323 families residing in the borough. The population density was 9,845.3 people per square mile. The racial makeup of the borough was 87.2% White, 6.3% African American, 0.3% Native American, 2.2% Asian, 0.1% Pacific Islander, 1.7% from other races, and 2.3% from two or more races. Hispanic or Latino of any race were 5.2% of the population.
The median age in the borough was 40.2 years. 22.3% of residents were under the age of 18; 7.2% were between the ages of 18 and 24; 27.2% were from 25 to 44; 28.3% were from 45 to 64; and 14.1% were 65 years of age or older. The gender makeup of the borough was 48.2% male and 51.8% female.
Economy
Audubon Borough is home to a variety of businesses, including retail stores, restaurants, and professional services. The borough is also home to a number of manufacturing companies, including a paper mill, a printing company, and a plastics manufacturer. The borough is also home to a number of small businesses, including a bakery, a florist, and a pet store.
The median household income in the borough was $60,945, and the median family income was $71,945. The per capita income for the borough was $27,945. About 4.2% of families and 5.7% of the population were below the poverty line, including 6.3% of those under age 18 and 5.2% of those age 65 or over.
History
Audubon Borough was originally part of Haddon Township, which was established in 1688. The area was known as "The Hook" due to its location at the bend of the Delaware River. In 1871, the area was incorporated as the Borough of Audubon, named after the famous naturalist John James Audubon.
The borough was home to a number of industries, including a paper mill, a printing company, and a plastics manufacturer. The borough was also home to a number of small businesses, including a bakery, a florist, and a pet store.
In the early 20th century, the borough was home to a number of amusement parks, including the Audubon Park, which opened in 1906 and closed in the 1950s. The borough was also home to a number of movie theaters, including the Audubon Theater, which opened in 1915 and closed in the 1970s.
Today, Audubon Borough is a quiet residential community, with a variety of businesses and services. The borough is home to a number of parks and recreational facilities, including the Audubon Park, which is home to a number of sports fields, playgrounds, and walking trails. The borough is also home to a number of historic sites, including the Audubon Mansion, which was built in 1876 and is now a museum.
Common Questions
What is Per Capita Income in Audubon borough?
Per Capita income in Audubon borough is $45,562.
What is the Median Family Income in Audubon borough?
Median Family Income in Audubon borough is $117,336.
What is the Median Household income in Audubon borough?
Median Household Income in Audubon borough is $103,379.
What is Income or Wage Gap in Audubon borough?
Income or Wage Gap in Audubon borough is 18.4%.
Women in Audubon borough earn 81.6 cents for every dollar earned by a man.
What is Inequality or Gini Index in Audubon borough?
Inequality or Gini Index in Audubon borough is 0.38.
What is the Total Population of Audubon borough?
Total Population of Audubon borough is 8,695.
What is the Total Male Population of Audubon borough?
Total Male Population of Audubon borough is 4,189.
What is the Total Female Population of Audubon borough?
Total Female Population of Audubon borough is 4,506.
What is the Ratio of Males per 100 Females in Audubon borough?
There are 92.96 Males per 100 Females in Audubon borough.
What is the Ratio of Females per 100 Males in Audubon borough?
There are 107.57 Females per 100 Males in Audubon borough.
What is the Median Population Age in Audubon borough?
Median Population Age in Audubon borough is 38.0 Years.
What is the Average Family Size in Audubon borough
Average Family Size in Audubon borough is 3.2 People.
What is the Average Household Size in Audubon borough
Average Household Size in Audubon borough is 2.6 People.
How Large is the Labor Force in Audubon borough?
There are 4,990 People in the Labor Forcein in Audubon borough.
What is the Percentage of People in the Labor Force in Audubon borough?
72.8% of People are in the Labor Force in Audubon borough.
What is the Unemployment Rate in Audubon borough?
Unemployment Rate in Audubon borough is 5.0%.