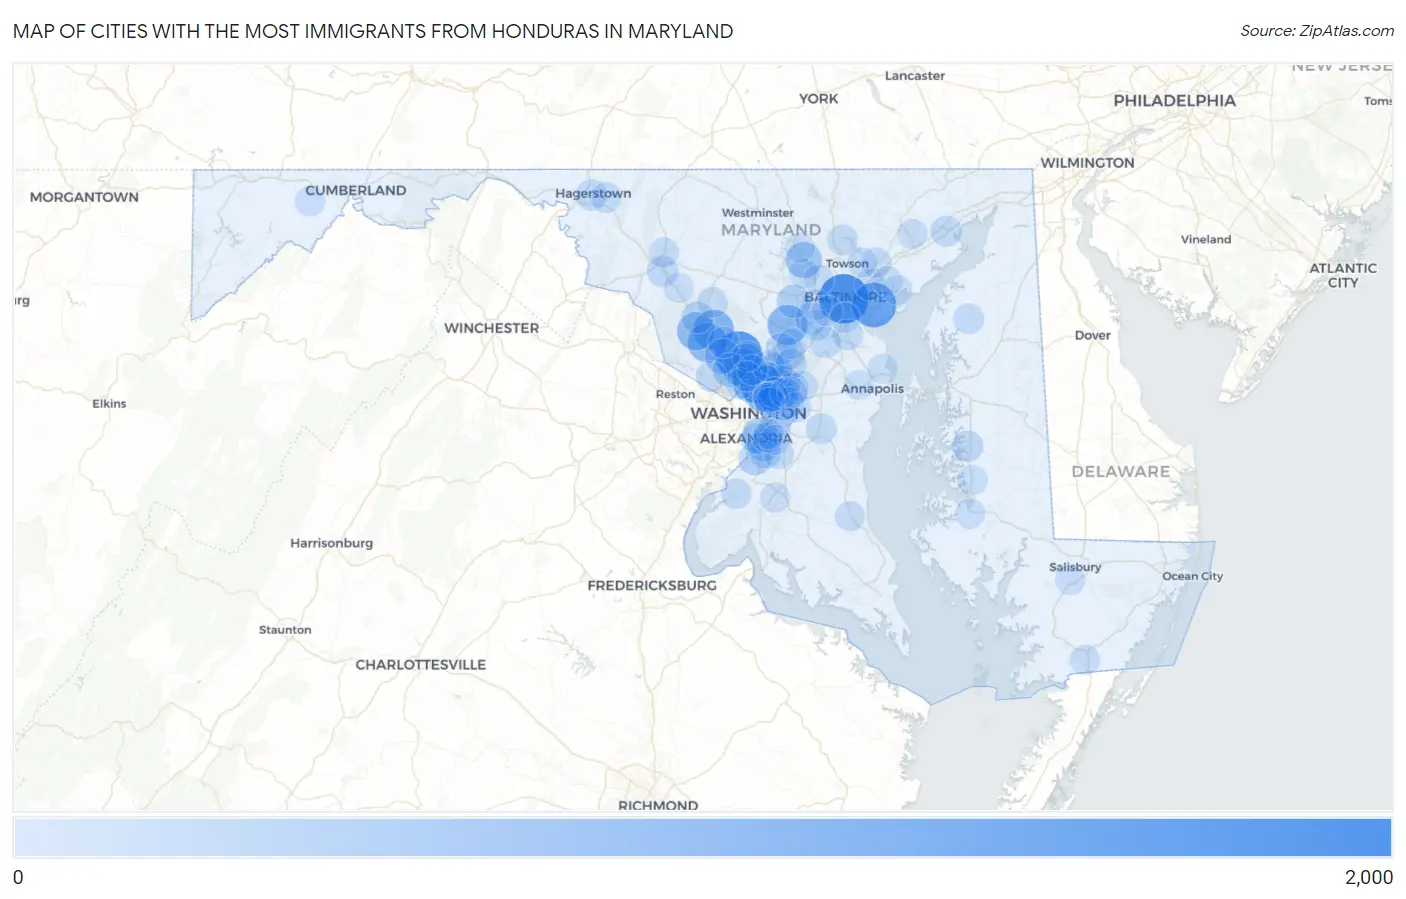
Cities with the Most Immigrants from Honduras in Maryland
RELATED REPORTS & OPTIONS
Honduras
Maryland
Compare Cities
Map of Cities with the Most Immigrants from Honduras in Maryland
0
2,000
Cities with the Most Immigrants from Honduras in Maryland
| City | Honduras | vs State | vs National | |
| 1. | Baltimore | 1,628 | 24,026(6.78%)#1 | 727,303(0.22%)#48 |
| 2. | Aspen Hill | 1,447 | 24,026(6.02%)#2 | 727,303(0.20%)#61 |
| 3. | Dundalk | 1,221 | 24,026(5.08%)#3 | 727,303(0.17%)#72 |
| 4. | Langley Park | 956 | 24,026(3.98%)#4 | 727,303(0.13%)#104 |
| 5. | Montgomery Village | 858 | 24,026(3.57%)#5 | 727,303(0.12%)#112 |
| 6. | Silver Spring | 846 | 24,026(3.52%)#6 | 727,303(0.12%)#114 |
| 7. | Columbia | 822 | 24,026(3.42%)#7 | 727,303(0.11%)#116 |
| 8. | College Park | 821 | 24,026(3.42%)#8 | 727,303(0.11%)#118 |
| 9. | Gaithersburg | 771 | 24,026(3.21%)#9 | 727,303(0.11%)#130 |
| 10. | Wheaton | 734 | 24,026(3.06%)#10 | 727,303(0.10%)#143 |
| 11. | Germantown | 691 | 24,026(2.88%)#11 | 727,303(0.10%)#148 |
| 12. | Chillum | 621 | 24,026(2.58%)#12 | 727,303(0.09%)#170 |
| 13. | Owings Mills | 512 | 24,026(2.13%)#13 | 727,303(0.07%)#207 |
| 14. | Glenmont | 475 | 24,026(1.98%)#14 | 727,303(0.07%)#222 |
| 15. | Hyattsville | 460 | 24,026(1.91%)#15 | 727,303(0.06%)#229 |
| 16. | Glassmanor | 450 | 24,026(1.87%)#16 | 727,303(0.06%)#233 |
| 17. | Greenbelt | 445 | 24,026(1.85%)#17 | 727,303(0.06%)#236 |
| 18. | Rockville | 422 | 24,026(1.76%)#18 | 727,303(0.06%)#247 |
| 19. | East Riverdale | 410 | 24,026(1.71%)#19 | 727,303(0.06%)#258 |
| 20. | North Bethesda | 351 | 24,026(1.46%)#20 | 727,303(0.05%)#293 |
| 21. | Beltsville | 337 | 24,026(1.40%)#21 | 727,303(0.05%)#307 |
| 22. | Adelphi | 323 | 24,026(1.34%)#22 | 727,303(0.04%)#325 |
| 23. | Ellicott City | 312 | 24,026(1.30%)#23 | 727,303(0.04%)#343 |
| 24. | Fort Washington | 268 | 24,026(1.12%)#24 | 727,303(0.04%)#403 |
| 25. | Oxon Hill | 236 | 24,026(0.98%)#25 | 727,303(0.03%)#439 |
| 26. | Flower Hill | 232 | 24,026(0.97%)#26 | 727,303(0.03%)#444 |
| 27. | Landover | 219 | 24,026(0.91%)#27 | 727,303(0.03%)#464 |
| 28. | Ilchester | 206 | 24,026(0.86%)#28 | 727,303(0.03%)#492 |
| 29. | Mount Rainier | 203 | 24,026(0.84%)#29 | 727,303(0.03%)#497 |
| 30. | Takoma Park | 202 | 24,026(0.84%)#30 | 727,303(0.03%)#498 |
| 31. | Friendly | 179 | 24,026(0.75%)#31 | 727,303(0.02%)#563 |
| 32. | Suitland | 177 | 24,026(0.74%)#32 | 727,303(0.02%)#567 |
| 33. | Calverton | 175 | 24,026(0.73%)#33 | 727,303(0.02%)#573 |
| 34. | Laurel | 174 | 24,026(0.72%)#34 | 727,303(0.02%)#576 |
| 35. | Seabrook | 174 | 24,026(0.72%)#35 | 727,303(0.02%)#577 |
| 36. | Clarksburg | 163 | 24,026(0.68%)#36 | 727,303(0.02%)#609 |
| 37. | Redland | 134 | 24,026(0.56%)#37 | 727,303(0.02%)#703 |
| 38. | Ballenger Creek | 131 | 24,026(0.55%)#38 | 727,303(0.02%)#712 |
| 39. | West Laurel | 126 | 24,026(0.52%)#39 | 727,303(0.02%)#745 |
| 40. | Easton | 123 | 24,026(0.51%)#40 | 727,303(0.02%)#764 |
| 41. | Severn | 121 | 24,026(0.50%)#41 | 727,303(0.02%)#771 |
| 42. | Elkridge | 116 | 24,026(0.48%)#42 | 727,303(0.02%)#796 |
| 43. | Glen Burnie | 114 | 24,026(0.47%)#43 | 727,303(0.02%)#805 |
| 44. | Hagerstown | 110 | 24,026(0.46%)#44 | 727,303(0.02%)#824 |
| 45. | Bladensburg | 110 | 24,026(0.46%)#45 | 727,303(0.02%)#827 |
| 46. | Aberdeen | 103 | 24,026(0.43%)#46 | 727,303(0.01%)#859 |
| 47. | Woodlawn Cdp Prince George S County | 94 | 24,026(0.39%)#47 | 727,303(0.01%)#924 |
| 48. | Marlboro Meadows | 90 | 24,026(0.37%)#48 | 727,303(0.01%)#955 |
| 49. | Cockeysville | 89 | 24,026(0.37%)#49 | 727,303(0.01%)#959 |
| 50. | Rosedale | 87 | 24,026(0.36%)#50 | 727,303(0.01%)#976 |
| 51. | Chevy Chase | 85 | 24,026(0.35%)#51 | 727,303(0.01%)#990 |
| 52. | Robinwood | 84 | 24,026(0.35%)#52 | 727,303(0.01%)#1,001 |
| 53. | North Laurel | 80 | 24,026(0.33%)#53 | 727,303(0.01%)#1,023 |
| 54. | Forest Heights | 78 | 24,026(0.32%)#54 | 727,303(0.01%)#1,046 |
| 55. | Chestertown | 77 | 24,026(0.32%)#55 | 727,303(0.01%)#1,057 |
| 56. | Glenn Dale | 73 | 24,026(0.30%)#56 | 727,303(0.01%)#1,086 |
| 57. | Glenarden | 72 | 24,026(0.30%)#57 | 727,303(0.01%)#1,099 |
| 58. | South Laurel | 69 | 24,026(0.29%)#58 | 727,303(0.01%)#1,125 |
| 59. | Potomac | 67 | 24,026(0.28%)#59 | 727,303(0.01%)#1,141 |
| 60. | Clinton | 66 | 24,026(0.27%)#60 | 727,303(0.01%)#1,154 |
| 61. | Damascus | 65 | 24,026(0.27%)#61 | 727,303(0.01%)#1,164 |
| 62. | Peppermill Village | 63 | 24,026(0.26%)#62 | 727,303(0.01%)#1,187 |
| 63. | Catonsville | 58 | 24,026(0.24%)#63 | 727,303(0.01%)#1,240 |
| 64. | Perry Hall | 54 | 24,026(0.22%)#64 | 727,303(0.01%)#1,310 |
| 65. | Layhill | 54 | 24,026(0.22%)#65 | 727,303(0.01%)#1,319 |
| 66. | Brentwood | 53 | 24,026(0.22%)#66 | 727,303(0.01%)#1,335 |
| 67. | Riverdale Park | 47 | 24,026(0.20%)#67 | 727,303(0.01%)#1,416 |
| 68. | Cottage City | 45 | 24,026(0.19%)#68 | 727,303(0.01%)#1,446 |
| 69. | Forest Glen | 44 | 24,026(0.18%)#69 | 727,303(0.01%)#1,459 |
| 70. | Edmonston | 44 | 24,026(0.18%)#70 | 727,303(0.01%)#1,465 |
| 71. | Frederick | 43 | 24,026(0.18%)#71 | 727,303(0.01%)#1,469 |
| 72. | Bryans Road | 41 | 24,026(0.17%)#72 | 727,303(0.01%)#1,514 |
| 73. | Urbana | 40 | 24,026(0.17%)#73 | 727,303(0.01%)#1,534 |
| 74. | Temple Hills | 40 | 24,026(0.17%)#74 | 727,303(0.01%)#1,536 |
| 75. | North Brentwood | 40 | 24,026(0.17%)#75 | 727,303(0.01%)#1,542 |
| 76. | Middle River | 39 | 24,026(0.16%)#76 | 727,303(0.01%)#1,551 |
| 77. | Randallstown | 36 | 24,026(0.15%)#77 | 727,303(0.00%)#1,618 |
| 78. | Arbutus | 36 | 24,026(0.15%)#78 | 727,303(0.00%)#1,622 |
| 79. | Kemp Mill | 36 | 24,026(0.15%)#79 | 727,303(0.00%)#1,628 |
| 80. | Lochearn | 35 | 24,026(0.15%)#80 | 727,303(0.00%)#1,641 |
| 81. | Brooklyn Park | 35 | 24,026(0.15%)#81 | 727,303(0.00%)#1,643 |
| 82. | Trappe | 34 | 24,026(0.14%)#82 | 727,303(0.00%)#1,678 |
| 83. | Waldorf | 32 | 24,026(0.13%)#83 | 727,303(0.00%)#1,697 |
| 84. | Parole | 32 | 24,026(0.13%)#84 | 727,303(0.00%)#1,710 |
| 85. | New Carrollton | 32 | 24,026(0.13%)#85 | 727,303(0.00%)#1,712 |
| 86. | Reisterstown | 29 | 24,026(0.12%)#86 | 727,303(0.00%)#1,779 |
| 87. | Fruitland | 29 | 24,026(0.12%)#87 | 727,303(0.00%)#1,792 |
| 88. | Lake Arbor | 27 | 24,026(0.11%)#88 | 727,303(0.00%)#1,843 |
| 89. | Bowleys Quarters | 27 | 24,026(0.11%)#89 | 727,303(0.00%)#1,852 |
| 90. | Klondike | 27 | 24,026(0.11%)#90 | 727,303(0.00%)#1,859 |
| 91. | Cambridge | 24 | 24,026(0.10%)#91 | 727,303(0.00%)#1,928 |
| 92. | Marlow Heights | 24 | 24,026(0.10%)#92 | 727,303(0.00%)#1,934 |
| 93. | Pocomoke City | 23 | 24,026(0.10%)#93 | 727,303(0.00%)#1,972 |
| 94. | Carney | 22 | 24,026(0.09%)#94 | 727,303(0.00%)#1,984 |
| 95. | Lanham | 22 | 24,026(0.09%)#95 | 727,303(0.00%)#1,995 |
| 96. | Prince Frederick | 21 | 24,026(0.09%)#96 | 727,303(0.00%)#2,053 |
| 97. | Bel Air South | 20 | 24,026(0.08%)#97 | 727,303(0.00%)#2,062 |
| 98. | Camp Springs | 20 | 24,026(0.08%)#98 | 727,303(0.00%)#2,069 |
| 99. | Cape St Claire | 20 | 24,026(0.08%)#99 | 727,303(0.00%)#2,079 |
| 100. | Colmar Manor | 19 | 24,026(0.08%)#100 | 727,303(0.00%)#2,129 |
Common Questions
What are the Top 10 Cities with the Most Immigrants from Honduras in Maryland?
Top 10 Cities with the Most Immigrants from Honduras in Maryland are:
#1
1,628
#2
1,447
#3
1,221
#4
956
#5
858
#6
846
#7
822
#8
821
#9
771
#10
734
What city has the Most Immigrants from Honduras in Maryland?
Baltimore has the Most Immigrants from Honduras in Maryland with 1,628.
What is the Total Immigrants from Honduras in the State of Maryland?
Total Immigrants from Honduras in Maryland is 24,026.
What is the Total Immigrants from Honduras in the United States?
Total Immigrants from Honduras in the United States is 727,303.