Cities with the Most Immigrants from Honduras in Ohio
RELATED REPORTS & OPTIONS
Honduras
Ohio
Compare Cities
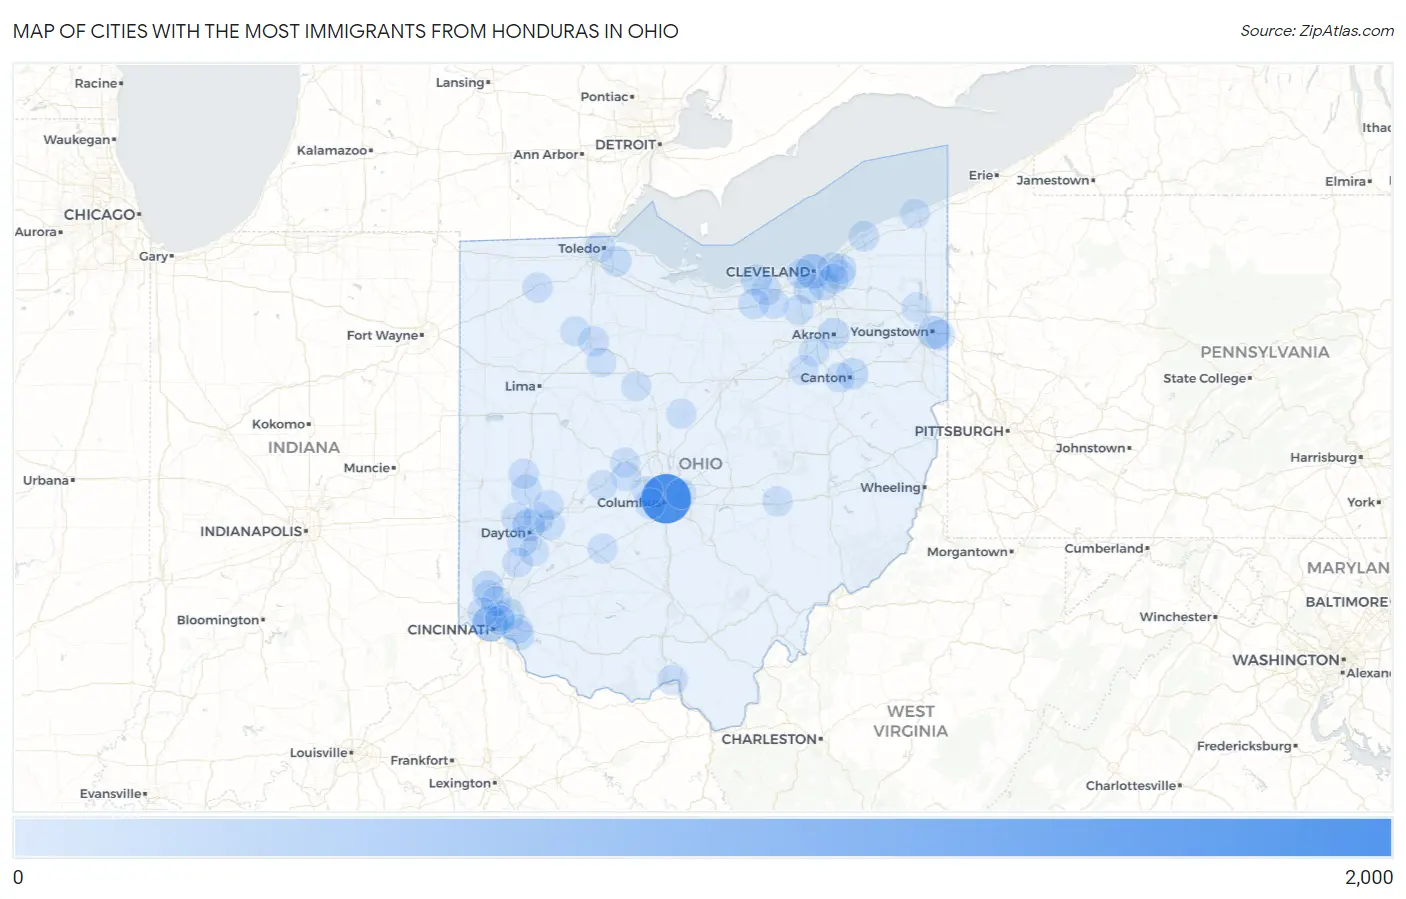
Map of Cities with the Most Immigrants from Honduras in Ohio
0
2,000
Cities with the Most Immigrants from Honduras in Ohio
| City | Honduras | vs State | vs National | |
| 1. | Columbus | 1,763 | 5,553(31.75%)#1 | 727,303(0.24%)#43 |
| 2. | Cincinnati | 499 | 5,553(8.99%)#2 | 727,303(0.07%)#212 |
| 3. | Cleveland | 416 | 5,553(7.49%)#3 | 727,303(0.06%)#250 |
| 4. | Youngstown | 232 | 5,553(4.18%)#4 | 727,303(0.03%)#442 |
| 5. | Dayton | 213 | 5,553(3.84%)#5 | 727,303(0.03%)#476 |
| 6. | Akron | 126 | 5,553(2.27%)#6 | 727,303(0.02%)#739 |
| 7. | Canton | 120 | 5,553(2.16%)#7 | 727,303(0.02%)#777 |
| 8. | Kenwood | 119 | 5,553(2.14%)#8 | 727,303(0.02%)#785 |
| 9. | Hamilton | 115 | 5,553(2.07%)#9 | 727,303(0.02%)#801 |
| 10. | Withamsville | 94 | 5,553(1.69%)#10 | 727,303(0.01%)#923 |
| 11. | Lorain | 88 | 5,553(1.58%)#11 | 727,303(0.01%)#967 |
| 12. | Parma | 76 | 5,553(1.37%)#12 | 727,303(0.01%)#1,059 |
| 13. | Troy | 70 | 5,553(1.26%)#13 | 727,303(0.01%)#1,118 |
| 14. | Campbell | 60 | 5,553(1.08%)#14 | 727,303(0.01%)#1,221 |
| 15. | Millbury | 56 | 5,553(1.01%)#15 | 727,303(0.01%)#1,288 |
| 16. | Moraine | 54 | 5,553(0.97%)#16 | 727,303(0.01%)#1,318 |
| 17. | Portsmouth | 49 | 5,553(0.88%)#17 | 727,303(0.01%)#1,380 |
| 18. | Lincoln Village | 49 | 5,553(0.88%)#18 | 727,303(0.01%)#1,382 |
| 19. | Painesville | 48 | 5,553(0.86%)#19 | 727,303(0.01%)#1,399 |
| 20. | Oberlin | 46 | 5,553(0.83%)#20 | 727,303(0.01%)#1,433 |
| 21. | Garfield Heights | 44 | 5,553(0.79%)#21 | 727,303(0.01%)#1,452 |
| 22. | Elyria | 41 | 5,553(0.74%)#22 | 727,303(0.01%)#1,506 |
| 23. | Gahanna | 31 | 5,553(0.56%)#23 | 727,303(0.00%)#1,730 |
| 24. | Findlay | 30 | 5,553(0.54%)#24 | 727,303(0.00%)#1,749 |
| 25. | Piqua | 27 | 5,553(0.49%)#25 | 727,303(0.00%)#1,838 |
| 26. | Franklin | 27 | 5,553(0.49%)#26 | 727,303(0.00%)#1,845 |
| 27. | Pepper Pike | 27 | 5,553(0.49%)#27 | 727,303(0.00%)#1,851 |
| 28. | Golf Manor | 26 | 5,553(0.47%)#28 | 727,303(0.00%)#1,875 |
| 29. | Hilliard | 24 | 5,553(0.43%)#29 | 727,303(0.00%)#1,914 |
| 30. | South Euclid | 24 | 5,553(0.43%)#30 | 727,303(0.00%)#1,922 |
| 31. | Napoleon | 22 | 5,553(0.40%)#31 | 727,303(0.00%)#1,998 |
| 32. | Fairfield | 20 | 5,553(0.36%)#32 | 727,303(0.00%)#2,064 |
| 33. | Huber Heights | 19 | 5,553(0.34%)#33 | 727,303(0.00%)#2,099 |
| 34. | Springdale | 19 | 5,553(0.34%)#34 | 727,303(0.00%)#2,112 |
| 35. | Mayfield Heights | 18 | 5,553(0.32%)#35 | 727,303(0.00%)#2,143 |
| 36. | Englewood | 18 | 5,553(0.32%)#36 | 727,303(0.00%)#2,150 |
| 37. | White Oak | 17 | 5,553(0.31%)#37 | 727,303(0.00%)#2,174 |
| 38. | Doylestown | 17 | 5,553(0.31%)#38 | 727,303(0.00%)#2,188 |
| 39. | Brunswick | 16 | 5,553(0.29%)#39 | 727,303(0.00%)#2,209 |
| 40. | Perry Heights | 13 | 5,553(0.23%)#40 | 727,303(0.00%)#2,378 |
| 41. | Marysville | 11 | 5,553(0.20%)#41 | 727,303(0.00%)#2,463 |
| 42. | Zanesville | 10 | 5,553(0.18%)#42 | 727,303(0.00%)#2,523 |
| 43. | Highland Hills | 10 | 5,553(0.18%)#43 | 727,303(0.00%)#2,578 |
| 44. | Fairborn | 9 | 5,553(0.16%)#44 | 727,303(0.00%)#2,599 |
| 45. | Orrville | 9 | 5,553(0.16%)#45 | 727,303(0.00%)#2,619 |
| 46. | Toledo | 8 | 5,553(0.14%)#46 | 727,303(0.00%)#2,652 |
| 47. | Morgandale | 8 | 5,553(0.14%)#47 | 727,303(0.00%)#2,702 |
| 48. | Jeffersonville | 8 | 5,553(0.14%)#48 | 727,303(0.00%)#2,704 |
| 49. | Lakewood | 6 | 5,553(0.11%)#49 | 727,303(0.00%)#2,767 |
| 50. | Centerville | 6 | 5,553(0.11%)#50 | 727,303(0.00%)#2,776 |
| 51. | Norwood | 6 | 5,553(0.11%)#51 | 727,303(0.00%)#2,784 |
| 52. | Ashtabula | 6 | 5,553(0.11%)#52 | 727,303(0.00%)#2,788 |
| 53. | Unionville Center | 6 | 5,553(0.11%)#53 | 727,303(0.00%)#2,841 |
| 54. | Mount Carmel | 5 | 5,553(0.09%)#54 | 727,303(0.00%)#2,868 |
| 55. | Mechanicsburg | 5 | 5,553(0.09%)#55 | 727,303(0.00%)#2,881 |
| 56. | Mccomb | 5 | 5,553(0.09%)#56 | 727,303(0.00%)#2,882 |
| 57. | New Carlisle | 4 | 5,553(0.07%)#57 | 727,303(0.00%)#2,924 |
| 58. | Grafton | 3 | 5,553(0.05%)#58 | 727,303(0.00%)#2,993 |
| 59. | Edison | 3 | 5,553(0.05%)#59 | 727,303(0.00%)#3,042 |
| 60. | Mount Blanchard | 1 | 5,553(0.02%)#60 | 727,303(0.00%)#3,169 |
| 61. | Harpster | 1 | 5,553(0.02%)#61 | 727,303(0.00%)#3,178 |
Common Questions
What are the Top 10 Cities with the Most Immigrants from Honduras in Ohio?
Top 10 Cities with the Most Immigrants from Honduras in Ohio are:
#1
1,763
#2
499
#3
416
#4
232
#5
213
#6
126
#7
120
#8
119
#9
115
#10
94
What city has the Most Immigrants from Honduras in Ohio?
Columbus has the Most Immigrants from Honduras in Ohio with 1,763.
What is the Total Immigrants from Honduras in the State of Ohio?
Total Immigrants from Honduras in Ohio is 5,553.
What is the Total Immigrants from Honduras in the United States?
Total Immigrants from Honduras in the United States is 727,303.