Cities with the Most Immigrants from Honduras in Pennsylvania
RELATED REPORTS & OPTIONS
Honduras
Pennsylvania
Compare Cities
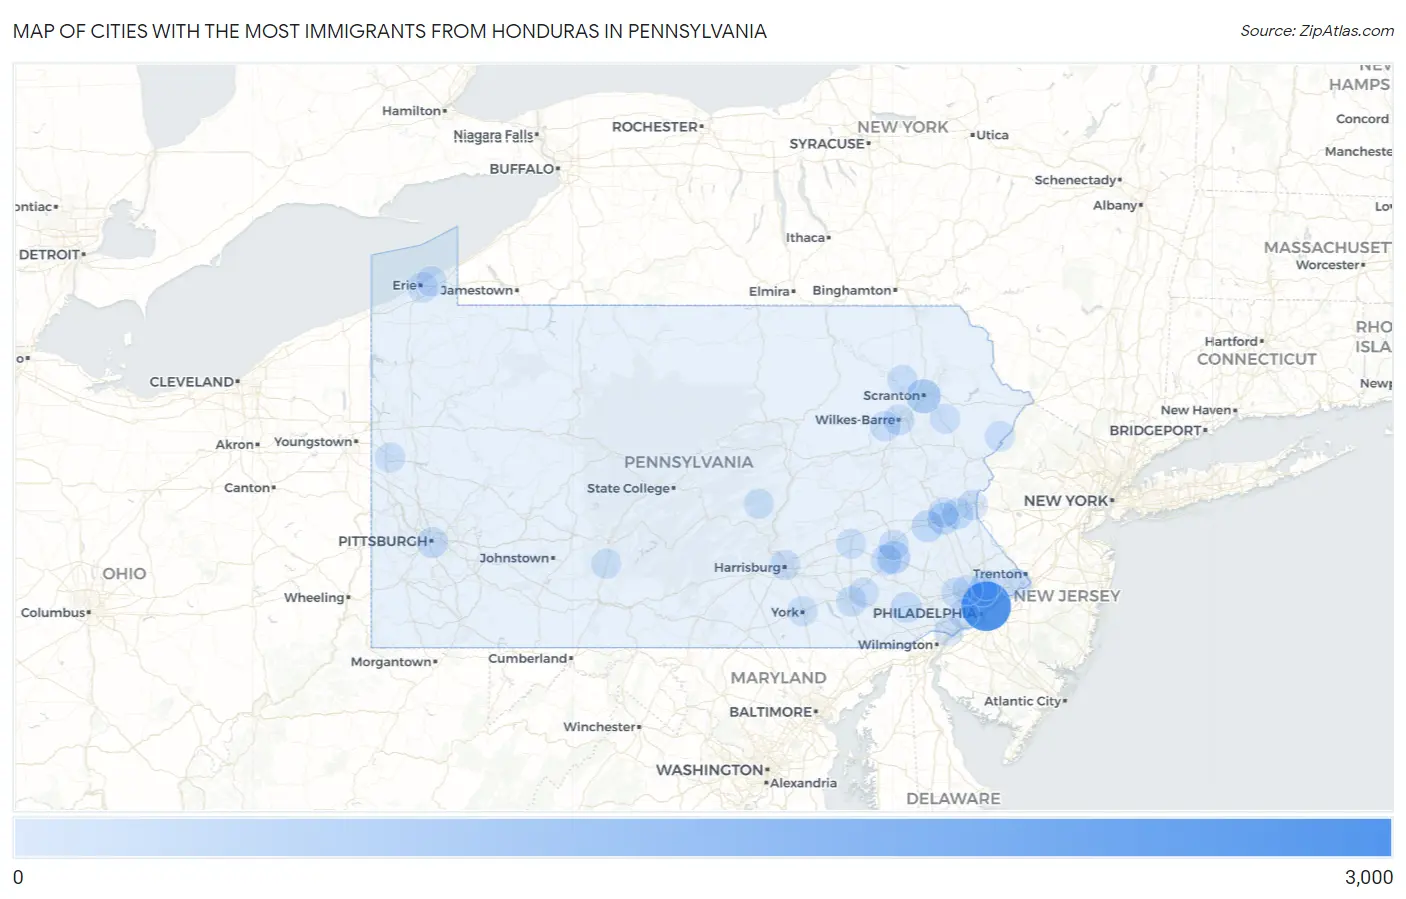
Map of Cities with the Most Immigrants from Honduras in Pennsylvania
0
3,000
Cities with the Most Immigrants from Honduras in Pennsylvania
| City | Honduras | vs State | vs National | |
| 1. | Philadelphia | 2,596 | 8,463(30.67%)#1 | 727,303(0.36%)#21 |
| 2. | Scranton | 500 | 8,463(5.91%)#2 | 727,303(0.07%)#211 |
| 3. | Norristown Borough | 453 | 8,463(5.35%)#3 | 727,303(0.06%)#231 |
| 4. | Reading | 359 | 8,463(4.24%)#4 | 727,303(0.05%)#288 |
| 5. | Allentown | 237 | 8,463(2.80%)#5 | 727,303(0.03%)#437 |
| 6. | Breinigsville | 228 | 8,463(2.69%)#6 | 727,303(0.03%)#450 |
| 7. | Coatesville | 147 | 8,463(1.74%)#7 | 727,303(0.02%)#658 |
| 8. | Bethlehem | 139 | 8,463(1.64%)#8 | 727,303(0.02%)#680 |
| 9. | Pittsburgh | 123 | 8,463(1.45%)#9 | 727,303(0.02%)#761 |
| 10. | Fountain Hill Borough | 114 | 8,463(1.35%)#10 | 727,303(0.02%)#806 |
| 11. | Lincoln Park | 103 | 8,463(1.22%)#11 | 727,303(0.01%)#863 |
| 12. | Wilkes Barre | 100 | 8,463(1.18%)#12 | 727,303(0.01%)#880 |
| 13. | Frazer | 95 | 8,463(1.12%)#13 | 727,303(0.01%)#917 |
| 14. | Lansdale Borough | 93 | 8,463(1.10%)#14 | 727,303(0.01%)#930 |
| 15. | Chambersburg Borough | 80 | 8,463(0.95%)#15 | 727,303(0.01%)#1,024 |
| 16. | East Stroudsburg Borough | 71 | 8,463(0.84%)#16 | 727,303(0.01%)#1,111 |
| 17. | Oxford Borough | 69 | 8,463(0.82%)#17 | 727,303(0.01%)#1,130 |
| 18. | Shillington Borough | 62 | 8,463(0.73%)#18 | 727,303(0.01%)#1,203 |
| 19. | Shenandoah Borough | 57 | 8,463(0.67%)#19 | 727,303(0.01%)#1,271 |
| 20. | Fullerton | 44 | 8,463(0.52%)#20 | 727,303(0.01%)#1,455 |
| 21. | Erie | 42 | 8,463(0.50%)#21 | 727,303(0.01%)#1,486 |
| 22. | Harrisburg | 41 | 8,463(0.48%)#22 | 727,303(0.01%)#1,507 |
| 23. | Lancaster | 39 | 8,463(0.46%)#23 | 727,303(0.01%)#1,548 |
| 24. | Temple | 39 | 8,463(0.46%)#24 | 727,303(0.01%)#1,559 |
| 25. | Levittown | 38 | 8,463(0.45%)#25 | 727,303(0.01%)#1,568 |
| 26. | King Of Prussia | 38 | 8,463(0.45%)#26 | 727,303(0.01%)#1,573 |
| 27. | Easton | 37 | 8,463(0.44%)#27 | 727,303(0.01%)#1,593 |
| 28. | Lansford Borough | 35 | 8,463(0.41%)#28 | 727,303(0.00%)#1,649 |
| 29. | Nanticoke | 34 | 8,463(0.40%)#29 | 727,303(0.00%)#1,667 |
| 30. | Camp Hill Borough | 34 | 8,463(0.40%)#30 | 727,303(0.00%)#1,668 |
| 31. | Souderton Borough | 34 | 8,463(0.40%)#31 | 727,303(0.00%)#1,670 |
| 32. | Lake Winola | 33 | 8,463(0.39%)#32 | 727,303(0.00%)#1,696 |
| 33. | Roslyn | 30 | 8,463(0.35%)#33 | 727,303(0.00%)#1,761 |
| 34. | Swissvale Borough | 29 | 8,463(0.34%)#34 | 727,303(0.00%)#1,790 |
| 35. | Elizabethtown Borough | 28 | 8,463(0.33%)#35 | 727,303(0.00%)#1,816 |
| 36. | Pine Ridge | 25 | 8,463(0.30%)#36 | 727,303(0.00%)#1,900 |
| 37. | Northwest Harborcreek | 23 | 8,463(0.27%)#37 | 727,303(0.00%)#1,964 |
| 38. | Mifflintown Borough | 20 | 8,463(0.24%)#38 | 727,303(0.00%)#2,089 |
| 39. | Drexel Hill | 19 | 8,463(0.22%)#39 | 727,303(0.00%)#2,102 |
| 40. | New Holland Borough | 19 | 8,463(0.22%)#40 | 727,303(0.00%)#2,119 |
| 41. | Yeadon Borough | 18 | 8,463(0.21%)#41 | 727,303(0.00%)#2,152 |
| 42. | New Castle | 17 | 8,463(0.20%)#42 | 727,303(0.00%)#2,173 |
| 43. | Tamaqua Borough | 17 | 8,463(0.20%)#43 | 727,303(0.00%)#2,183 |
| 44. | Mount Aetna | 16 | 8,463(0.19%)#44 | 727,303(0.00%)#2,248 |
| 45. | Coplay Borough | 15 | 8,463(0.18%)#45 | 727,303(0.00%)#2,291 |
| 46. | Glenside | 14 | 8,463(0.17%)#46 | 727,303(0.00%)#2,323 |
| 47. | Honey Brook Borough | 14 | 8,463(0.17%)#47 | 727,303(0.00%)#2,341 |
| 48. | Renovo Borough | 14 | 8,463(0.17%)#48 | 727,303(0.00%)#2,349 |
| 49. | Cove Forge | 13 | 8,463(0.15%)#49 | 727,303(0.00%)#2,396 |
| 50. | Leola | 12 | 8,463(0.14%)#50 | 727,303(0.00%)#2,421 |
| 51. | Vandling Borough | 11 | 8,463(0.13%)#51 | 727,303(0.00%)#2,500 |
| 52. | Bellevue Borough | 10 | 8,463(0.12%)#52 | 727,303(0.00%)#2,542 |
| 53. | Clarks Summit Borough | 10 | 8,463(0.12%)#53 | 727,303(0.00%)#2,549 |
| 54. | Troy Borough | 10 | 8,463(0.12%)#54 | 727,303(0.00%)#2,572 |
| 55. | Hughesville Borough | 8 | 8,463(0.09%)#55 | 727,303(0.00%)#2,699 |
| 56. | Willow Grove | 7 | 8,463(0.08%)#56 | 727,303(0.00%)#2,726 |
| 57. | Freemansburg Borough | 7 | 8,463(0.08%)#57 | 727,303(0.00%)#2,741 |
| 58. | Shiremanstown Borough | 7 | 8,463(0.08%)#58 | 727,303(0.00%)#2,747 |
| 59. | Linesville Borough | 7 | 8,463(0.08%)#59 | 727,303(0.00%)#2,753 |
| 60. | Boothwyn | 6 | 8,463(0.07%)#60 | 727,303(0.00%)#2,804 |
| 61. | Jenkintown Borough | 6 | 8,463(0.07%)#61 | 727,303(0.00%)#2,806 |
| 62. | Plymouth Borough | 5 | 8,463(0.06%)#62 | 727,303(0.00%)#2,866 |
| 63. | York | 3 | 8,463(0.04%)#63 | 727,303(0.00%)#2,973 |
| 64. | Plymouth Meeting | 3 | 8,463(0.04%)#64 | 727,303(0.00%)#2,989 |
| 65. | East Bangor Borough | 3 | 8,463(0.04%)#65 | 727,303(0.00%)#3,028 |
| 66. | Big Bass Lake | 2 | 8,463(0.02%)#66 | 727,303(0.00%)#3,080 |
| 67. | Claysburg | 2 | 8,463(0.02%)#67 | 727,303(0.00%)#3,082 |
| 68. | Richfield | 2 | 8,463(0.02%)#68 | 727,303(0.00%)#3,103 |
Common Questions
What are the Top 10 Cities with the Most Immigrants from Honduras in Pennsylvania?
Top 10 Cities with the Most Immigrants from Honduras in Pennsylvania are:
#1
2,596
#2
500
#3
359
#4
237
#5
228
#6
147
#7
139
#8
123
#9
103
#10
100
What city has the Most Immigrants from Honduras in Pennsylvania?
Philadelphia has the Most Immigrants from Honduras in Pennsylvania with 2,596.
What is the Total Immigrants from Honduras in the State of Pennsylvania?
Total Immigrants from Honduras in Pennsylvania is 8,463.
What is the Total Immigrants from Honduras in the United States?
Total Immigrants from Honduras in the United States is 727,303.