Cities with the Highest Percentage of Tongan Population in Texas

RELATED REPORTS & OPTIONS

Tongan
Population
Families and Households
Female Fertility
Female Fertility (Unmarried)
Race (Community Size)
Race (Percentage)
Ancestry (Community Size)
AfghanAfricanAlaska NativeAlaskan AthabascanAlbanianAleutAlsatianAmericanApacheArabArapahoArgentineanArmenianAssyrian / Chaldean / SyriacAustralianAustrianBahamianBangladeshiBarbadianBasqueBelgianBelizeanBermudanBhutaneseBlackfeetBolivianBrazilianBritishBritish West IndianBulgarianBurmeseCajunCambodianCanadianCape VerdeanCarpatho RusynCelticCentral AmericanCentral American IndianCherokeeCheyenneChickasawChileanChineseChippewaChoctawColombianColvilleComancheCosta RicanCreeCreekCroatianCrowCubanCypriotCzechCzechoslovakianDanishDelawareDominicanDutchDutch West IndianEastern EuropeanEcuadorianEgyptianEnglishEstonianEthiopianEuropeanFijianFilipinoFinnishFrenchFrench American IndianFrench CanadianGermanGerman RussianGhanaianGreekGuamanian / ChamorroGuatemalanGuyaneseHaitianHmongHonduranHopiHoumaHungarianIcelanderIndian (Asian)IndonesianInupiatIranianIraqiIrishIroquoisIsraeliItalianJamaicanJapaneseJordanianKenyanKiowaKoreanLaotianLatvianLebaneseLiberianLithuanianLumbeeLuxembourgerMacedonianMalaysianMalteseMarshalleseMenomineeMexicanMexican American IndianMongolianMoroccanNative HawaiianNavajoNepaleseNew ZealanderNicaraguanNigerianNorthern EuropeanNorwegianOkinawanOsageOttawaPaiutePakistaniPalestinianPanamanianParaguayanPennsylvania GermanPeruvianPimaPolishPortuguesePotawatomiPuebloPuerto RicanPuget Sound SalishRomanianRussianSalvadoranSamoanScandinavianScotch-IrishScottishSeminoleSenegaleseSerbianShoshoneSierra LeoneanSiouxSlavicSlovakSloveneSomaliSouth AfricanSouth AmericanSouth American IndianSoviet UnionSpaniardSpanishSpanish AmericanSpanish American IndianSri LankanSubsaharan AfricanSudaneseSwedishSwissSyrianTaiwaneseThaiTlingit-HaidaTohono O'OdhamTonganTrinidadian and TobagonianTsimshianTurkishU.S. Virgin IslanderUgandanUkrainianUruguayanUteVenezuelanVietnameseWelshWest IndianYakamaYaquiYugoslavianYumanYup'ikZimbabwean
Ancestry (Percentage)
AfghanAfricanAlaska NativeAlaskan AthabascanAlbanianAleutAlsatianAmericanApacheArabArapahoArgentineanArmenianAssyrian / Chaldean / SyriacAustralianAustrianBahamianBangladeshiBarbadianBasqueBelgianBelizeanBermudanBhutaneseBlackfeetBolivianBrazilianBritishBritish West IndianBulgarianBurmeseCajunCambodianCanadianCape VerdeanCarpatho RusynCelticCentral AmericanCentral American IndianCherokeeCheyenneChickasawChileanChineseChippewaChoctawColombianColvilleComancheCosta RicanCreeCreekCroatianCrowCubanCypriotCzechCzechoslovakianDanishDelawareDominicanDutchDutch West IndianEastern EuropeanEcuadorianEgyptianEnglishEstonianEthiopianEuropeanFijianFilipinoFinnishFrenchFrench American IndianFrench CanadianGermanGerman RussianGhanaianGreekGuamanian / ChamorroGuatemalanGuyaneseHaitianHmongHonduranHopiHoumaHungarianIcelanderIndian (Asian)IndonesianInupiatIranianIraqiIrishIroquoisIsraeliItalianJamaicanJapaneseJordanianKenyanKiowaKoreanLaotianLatvianLebaneseLiberianLithuanianLumbeeLuxembourgerMacedonianMalaysianMalteseMarshalleseMenomineeMexicanMexican American IndianMongolianMoroccanNative HawaiianNavajoNepaleseNew ZealanderNicaraguanNigerianNorthern EuropeanNorwegianOkinawanOsageOttawaPaiutePakistaniPalestinianPanamanianParaguayanPennsylvania GermanPeruvianPimaPolishPortuguesePotawatomiPuebloPuerto RicanPuget Sound SalishRomanianRussianSalvadoranSamoanScandinavianScotch-IrishScottishSeminoleSenegaleseSerbianShoshoneSierra LeoneanSiouxSlavicSlovakSloveneSomaliSouth AfricanSouth AmericanSouth American IndianSoviet UnionSpaniardSpanishSpanish AmericanSpanish American IndianSri LankanSubsaharan AfricanSudaneseSwedishSwissSyrianTaiwaneseThaiTlingit-HaidaTohono O'OdhamTonganTrinidadian and TobagonianTsimshianTurkishU.S. Virgin IslanderUgandanUkrainianUruguayanUteVenezuelanVietnameseWelshWest IndianYakamaYaquiYugoslavianYumanYup'ikZimbabwean
Immigrant Origin (Total)
AfghanistanAfricaAlbaniaArgentinaArmeniaAsiaAustraliaAustriaAzoresBahamasBangladeshBarbadosBelarusBelgiumBelizeBoliviaBosnia and HerzegovinaBrazilBulgariaBurma / MyanmarCabo VerdeCambodiaCameroonCanadaCaribbeanCentral AmericaChileChinaColombiaCongoCosta RicaCroatiaCubaCzechoslovakiaDenmarkDominicaDominican RepublicEastern AfricaEastern AsiaEastern EuropeEcuadorEgyptEl SalvadorEnglandEritreaEthiopiaEuropeFijiFranceGermanyGhanaGreeceGrenadaGuatemalaGuyanaHaitiHondurasHong KongHungaryIndiaIndonesiaIranIraqIrelandIsraelItalyJamaicaJapanJordanKazakhstanKenyaKoreaKuwaitLaosLatin AmericaLatviaLebanonLiberiaLithuaniaMalaysiaMexicoMicronesiaMiddle AfricaMoldovaMoroccoNepalNetherlandsNicaraguaNigeriaNorth MacedoniaNorthern AfricaNorthern EuropeNorwayOceaniaPakistanPanamaPeruPhilippinesPolandPortugalRomaniaRussiaSaudi ArabiaScotlandSenegalSerbiaSierra LeoneSingaporeSomaliaSouth AfricaSouth AmericaSouth Central AsiaSouth Eastern AsiaSouthern EuropeSpainSri LankaSt. Vincent and the GrenadinesSudanSwedenSwitzerlandSyriaTaiwanThailandTrinidad and TobagoTurkeyUgandaUkraineUruguayUzbekistanVenezuelaVietnamWest IndiesWestern AfricaWestern AsiaWestern EuropeYemenZaireZimbabwe
Immigrant Origin (Percentage)
AfghanistanAfricaAlbaniaArgentinaArmeniaAsiaAustraliaAustriaAzoresBahamasBangladeshBarbadosBelarusBelgiumBelizeBoliviaBosnia and HerzegovinaBrazilBulgariaBurma / MyanmarCabo VerdeCambodiaCameroonCanadaCaribbeanCentral AmericaChileChinaColombiaCongoCosta RicaCroatiaCubaCzechoslovakiaDenmarkDominicaDominican RepublicEastern AfricaEastern AsiaEastern EuropeEcuadorEgyptEl SalvadorEnglandEritreaEthiopiaEuropeFijiFranceGermanyGhanaGreeceGrenadaGuatemalaGuyanaHaitiHondurasHong KongHungaryIndiaIndonesiaIranIraqIrelandIsraelItalyJamaicaJapanJordanKazakhstanKenyaKoreaKuwaitLaosLatin AmericaLatviaLebanonLiberiaLithuaniaMalaysiaMexicoMicronesiaMiddle AfricaMoldovaMoroccoNepalNetherlandsNicaraguaNigeriaNorth MacedoniaNorthern AfricaNorthern EuropeNorwayOceaniaPakistanPanamaPeruPhilippinesPolandPortugalRomaniaRussiaSaudi ArabiaScotlandSenegalSerbiaSierra LeoneSingaporeSomaliaSouth AfricaSouth AmericaSouth Central AsiaSouth Eastern AsiaSouthern EuropeSpainSri LankaSt. Vincent and the GrenadinesSudanSwedenSwitzerlandSyriaTaiwanThailandTrinidad and TobagoTurkeyUgandaUkraineUruguayUzbekistanVenezuelaVietnamWest IndiesWestern AfricaWestern AsiaWestern EuropeYemenZaireZimbabwe
Income
Income (Families)
Income (Households)
Poverty
Poverty (Families)
Unemployment
Employment Occupations
Employment Industries
Employer Class
Commute Time
Commute Means
School Enrollment
Education by Degree Field
Occupancy
Finances
Physical Characteristics
Texas
Compare Cities
Comparison Subject

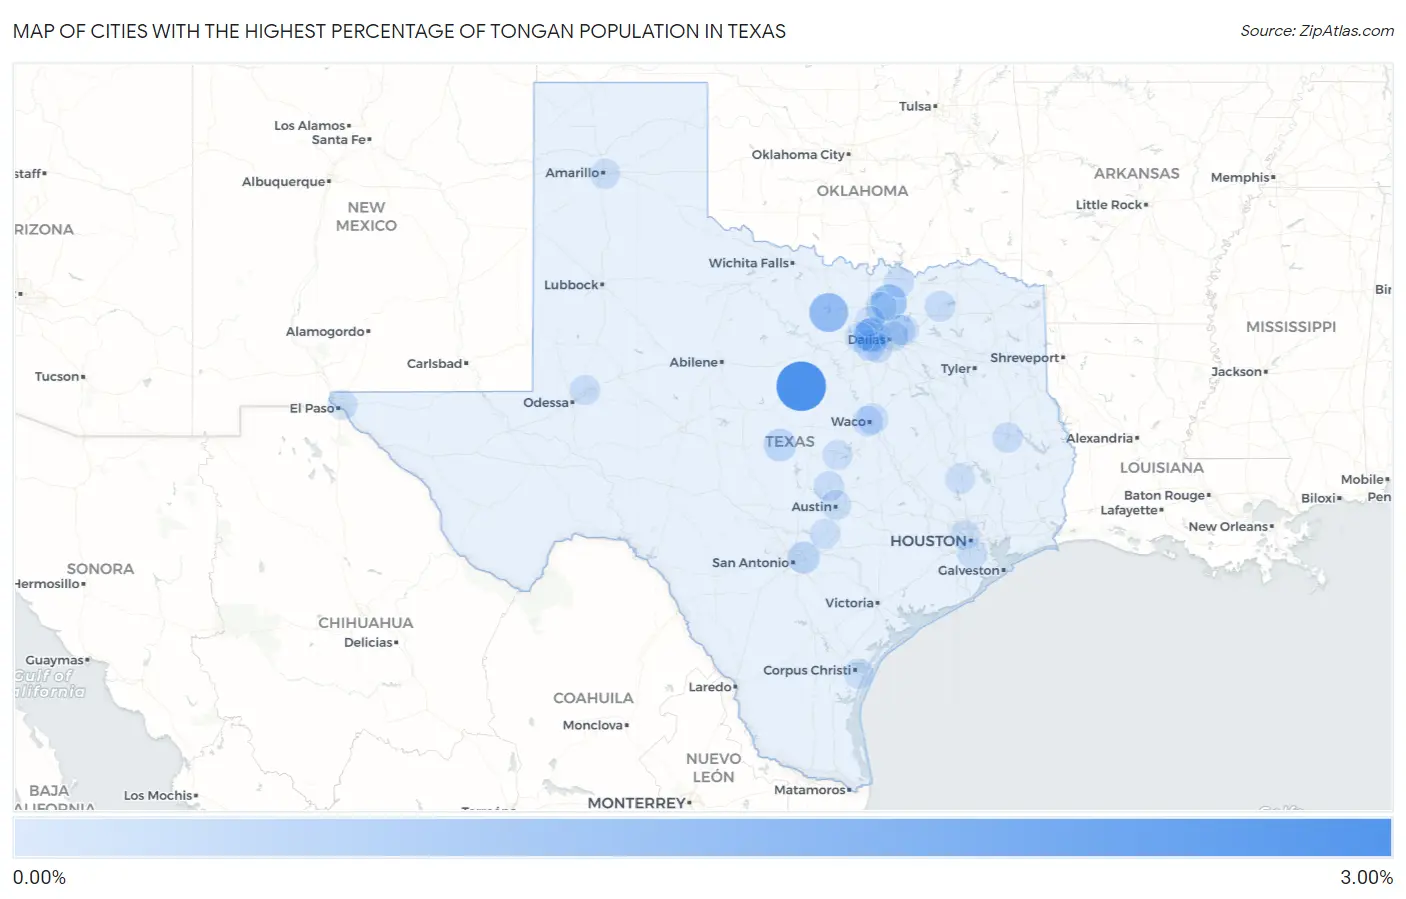
Map of Cities with the Highest Percentage of Tongan Population in Texas

0.00%
3.00%
Cities with the Highest Percentage of Tongan Population in Texas Map

Cities with the Highest Percentage of Tongan Population in Texas

City Tongan vs State vs National
1.Dublin2.62%0.0091%(+2.61)#10.021%(+2.60)#23
2.Runaway Bay1.15%0.0091%(+1.14)#20.021%(+1.13)#66
3.Celina0.78%0.0091%(+0.772)#30.021%(+0.760)#96
4.Euless0.60%0.0091%(+0.589)#40.021%(+0.577)#128
5.Bedford0.35%0.0091%(+0.341)#50.021%(+0.329)#185
6.San Saba0.32%0.0091%(+0.311)#60.021%(+0.299)#197
7.Converse0.26%0.0091%(+0.251)#70.021%(+0.239)#228
8.Town Of Pecos0.18%0.0091%(+0.167)#80.021%(+0.155)#275
9.Arlington0.17%0.0091%(+0.157)#90.021%(+0.145)#285
10.Providence Village0.14%0.0091%(+0.134)#100.021%(+0.122)#305
11.Bellmead0.095%0.0091%(+0.086)#110.021%(+0.074)#352
12.Commerce0.088%0.0091%(+0.079)#120.021%(+0.067)#362
13.Grand Prairie0.060%0.0091%(+0.051)#130.021%(+0.039)#411
14.Waco0.049%0.0091%(+0.040)#140.021%(+0.028)#441
15.Rowlett0.044%0.0091%(+0.035)#150.021%(+0.023)#452
16.Leander0.037%0.0091%(+0.028)#160.021%(+0.016)#464
17.Lufkin0.035%0.0091%(+0.026)#170.021%(+0.014)#469
18.Midland0.024%0.0091%(+0.015)#180.021%(+0.003)#495
19.Sherman0.023%0.0091%(+0.014)#190.021%(+0.002)#501
20.Huntsville0.022%0.0091%(+0.013)#200.021%(+0.001)#506
21.Flower Mound0.021%0.0091%(+0.012)#210.021%(-0.000)#508
22.Fort Worth0.019%0.0091%(+0.010)#220.021%(-0.002)#518
23.Garland0.018%0.0091%(+0.009)#230.021%(-0.003)#521
24.San Marcos0.016%0.0091%(+0.007)#240.021%(-0.005)#535
25.Amarillo0.012%0.0091%(+0.003)#250.021%(-0.009)#555
26.Pearland0.011%0.0091%(+0.002)#260.021%(-0.010)#562
27.Killeen0.0065%0.0091%(-0.003)#270.021%(-0.014)#586
28.Dallas0.0055%0.0091%(-0.004)#280.021%(-0.015)#593
29.Austin0.0035%0.0091%(-0.006)#290.021%(-0.017)#607
30.Corpus Christi0.0031%0.0091%(-0.006)#300.021%(-0.018)#613
31.El Paso0.0031%0.0091%(-0.006)#310.021%(-0.018)#614
32.Houston0.00009%0.0091%(-0.009)#320.021%(-0.021)#632

Common Questions

What are the Top 10 Cities with the Highest Percentage of Tongan Population in Texas?
Top 10 Cities with the Highest Percentage of Tongan Population in Texas are:
#1
2.62%
#2
1.15%
#3
0.78%
#4
0.60%
#5
0.35%
#6
0.32%
#7
0.26%
#8
0.17%
#9
0.14%
#10
0.095%
What city has the Highest Percentage of Tongan Population in Texas?
Dublin has the Highest Percentage of Tongan Population in Texas with 2.62%.
What is the Percentage of Tongan Population in the State of Texas?
Percentage of Tongan Population in Texas is 0.0091%.
What is the Percentage of Tongan Population in the United States?
Percentage of Tongan Population in the United States is 0.021%.