Cities with the Highest Percentage of Immigrants from Indonesia in Maryland
RELATED REPORTS & OPTIONS
Indonesia
Maryland
Compare Cities
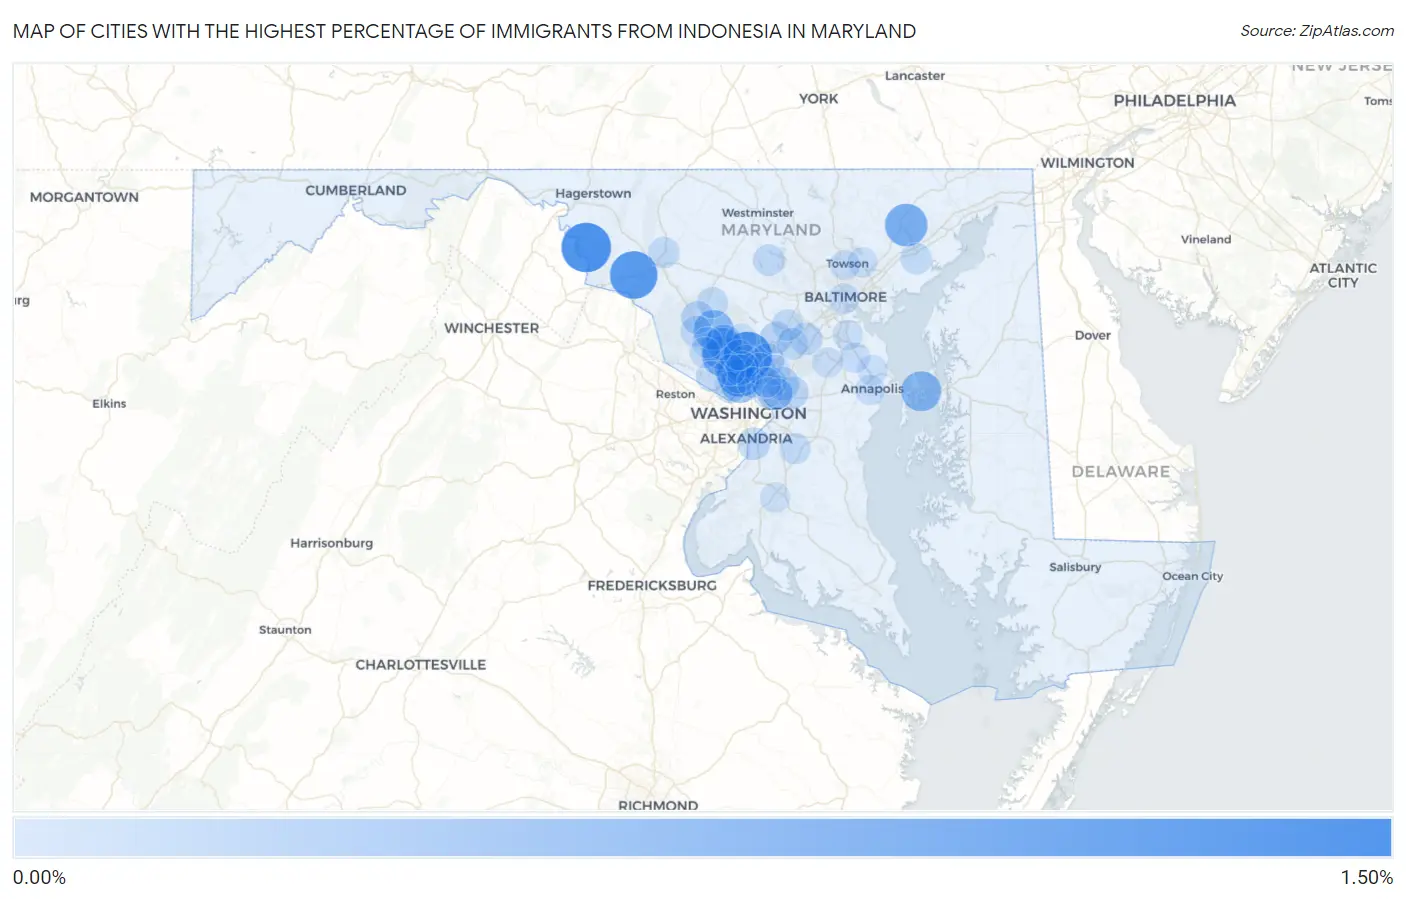
Map of Cities with the Highest Percentage of Immigrants from Indonesia in Maryland
0.00%
1.50%
Cities with the Highest Percentage of Immigrants from Indonesia in Maryland
| City | Indonesia | vs State | vs National | |
| 1. | Sharpsburg | 1.39% | 0.043%(+1.34)#-1 | 0.030%(+1.35)#0 |
| 2. | Layhill | 1.34% | 0.043%(+1.30)#2 | 0.030%(+1.31)#49 |
| 3. | Jefferson | 1.24% | 0.043%(+1.20)#3 | 0.030%(+1.21)#50 |
| 4. | Kensington | 1.12% | 0.043%(+1.07)#4 | 0.030%(+1.09)#51 |
| 5. | Bel Air | 0.87% | 0.043%(+0.832)#5 | 0.030%(+0.845)#52 |
| 6. | Derwood | 0.81% | 0.043%(+0.768)#6 | 0.030%(+0.781)#53 |
| 7. | Rockville | 0.75% | 0.043%(+0.708)#47 | 0.030%(+0.721)#1,217 |
| 8. | Chester | 0.70% | 0.043%(+0.653)#48 | 0.030%(+0.666)#1,218 |
| 9. | Montgomery Village | 0.69% | 0.043%(+0.648)#49 | 0.030%(+0.661)#1,219 |
| 10. | Chevy Chase | 0.57% | 0.043%(+0.529)#50 | 0.030%(+0.542)#1,220 |
| 11. | Redland | 0.42% | 0.043%(+0.377)#51 | 0.030%(+0.390)#1,221 |
| 12. | Riverdale Park | 0.36% | 0.043%(+0.314)#52 | 0.030%(+0.327)#1,222 |
| 13. | Chevy Chase View | 0.27% | 0.043%(+0.224)#53 | 0.030%(+0.237)#1,223 |
| 14. | Greenbelt | 0.22% | 0.043%(+0.180)#54 | 0.030%(+0.193)#1,224 |
| 15. | Fairland | 0.20% | 0.043%(+0.161)#55 | 0.030%(+0.174)#1,225 |
| 16. | Glenmont | 0.19% | 0.043%(+0.144)#56 | 0.030%(+0.156)#1,226 |
| 17. | Clarksburg | 0.18% | 0.043%(+0.141)#57 | 0.030%(+0.153)#1,227 |
| 18. | Jessup | 0.17% | 0.043%(+0.124)#58 | 0.030%(+0.137)#1,228 |
| 19. | Wheaton | 0.16% | 0.043%(+0.122)#59 | 0.030%(+0.135)#1,229 |
| 20. | National Harbor | 0.16% | 0.043%(+0.121)#60 | 0.030%(+0.134)#1,230 |
| 21. | Flower Hill | 0.16% | 0.043%(+0.115)#61 | 0.030%(+0.127)#1,231 |
| 22. | Lanham | 0.15% | 0.043%(+0.103)#62 | 0.030%(+0.116)#1,232 |
| 23. | Fulton | 0.13% | 0.043%(+0.086)#63 | 0.030%(+0.099)#1,233 |
| 24. | White Oak | 0.12% | 0.043%(+0.074)#64 | 0.030%(+0.086)#1,234 |
| 25. | Eldersburg | 0.11% | 0.043%(+0.066)#65 | 0.030%(+0.079)#1,235 |
| 26. | North Laurel | 0.10% | 0.043%(+0.060)#66 | 0.030%(+0.072)#1,236 |
| 27. | Frederick | 0.097% | 0.043%(+0.054)#67 | 0.030%(+0.067)#1,237 |
| 28. | Columbia | 0.096% | 0.043%(+0.053)#68 | 0.030%(+0.066)#1,238 |
| 29. | Edgewood | 0.092% | 0.043%(+0.049)#69 | 0.030%(+0.061)#1,239 |
| 30. | Germantown | 0.091% | 0.043%(+0.048)#70 | 0.030%(+0.061)#1,240 |
| 31. | Bethesda | 0.090% | 0.043%(+0.048)#71 | 0.030%(+0.060)#1,241 |
| 32. | North Kensington | 0.071% | 0.043%(+0.028)#72 | 0.030%(+0.041)#1,242 |
| 33. | North Bethesda | 0.070% | 0.043%(+0.028)#73 | 0.030%(+0.040)#1,243 |
| 34. | Damascus | 0.065% | 0.043%(+0.023)#74 | 0.030%(+0.035)#1,244 |
| 35. | Rosaryville | 0.058% | 0.043%(+0.016)#75 | 0.030%(+0.028)#1,245 |
| 36. | Gaithersburg | 0.055% | 0.043%(+0.012)#76 | 0.030%(+0.025)#1,246 |
| 37. | Silver Spring | 0.053% | 0.043%(+0.010)#77 | 0.030%(+0.022)#1,247 |
| 38. | College Park | 0.052% | 0.043%(+0.010)#78 | 0.030%(+0.022)#1,248 |
| 39. | Baltimore | 0.052% | 0.043%(+0.009)#79 | 0.030%(+0.022)#1,249 |
| 40. | North Potomac | 0.049% | 0.043%(+0.006)#80 | 0.030%(+0.019)#1,250 |
| 41. | Beltsville | 0.036% | 0.043%(-0.007)#81 | 0.030%(+0.005)#1,251 |
| 42. | Aspen Hill | 0.035% | 0.043%(-0.008)#82 | 0.030%(+0.005)#1,252 |
| 43. | Potomac | 0.034% | 0.043%(-0.008)#83 | 0.030%(+0.004)#1,253 |
| 44. | Hyattsville | 0.034% | 0.043%(-0.009)#84 | 0.030%(+0.003)#1,254 |
| 45. | East Riverdale | 0.033% | 0.043%(-0.010)#85 | 0.030%(+0.003)#1,255 |
| 46. | Arnold | 0.032% | 0.043%(-0.010)#86 | 0.030%(+0.002)#1,256 |
| 47. | Adelphi | 0.024% | 0.043%(-0.019)#87 | 0.030%(-0.006)#1,257 |
| 48. | Glen Burnie | 0.022% | 0.043%(-0.020)#88 | 0.030%(-0.008)#1,258 |
| 49. | Severna Park | 0.022% | 0.043%(-0.020)#89 | 0.030%(-0.008)#1,259 |
| 50. | Odenton | 0.020% | 0.043%(-0.023)#90 | 0.030%(-0.010)#1,260 |
| 51. | Annapolis | 0.020% | 0.043%(-0.023)#91 | 0.030%(-0.010)#1,261 |
| 52. | Carney | 0.017% | 0.043%(-0.026)#92 | 0.030%(-0.013)#1,262 |
| 53. | Olney | 0.017% | 0.043%(-0.026)#93 | 0.030%(-0.013)#1,263 |
| 54. | Towson | 0.016% | 0.043%(-0.027)#94 | 0.030%(-0.014)#1,264 |
| 55. | Waldorf | 0.0086% | 0.043%(-0.034)#95 | 0.030%(-0.021)#1,265 |
Common Questions
What are the Top 10 Cities with the Highest Percentage of Immigrants from Indonesia in Maryland?
Top 10 Cities with the Highest Percentage of Immigrants from Indonesia in Maryland are:
#1
1.39%
#2
1.34%
#3
1.24%
#4
1.12%
#5
0.87%
#6
0.81%
#7
0.75%
#8
0.70%
#9
0.69%
#10
0.57%
What city has the Highest Percentage of Immigrants from Indonesia in Maryland?
Sharpsburg has the Highest Percentage of Immigrants from Indonesia in Maryland with 1.39%.
What is the Percentage of Immigrants from Indonesia in the State of Maryland?
Percentage of Immigrants from Indonesia in Maryland is 0.043%.
What is the Percentage of Immigrants from Indonesia in the United States?
Percentage of Immigrants from Indonesia in the United States is 0.030%.