Cities with the Highest Percentage of Immigrants from Indonesia in Ohio
RELATED REPORTS & OPTIONS
Indonesia
Ohio
Compare Cities
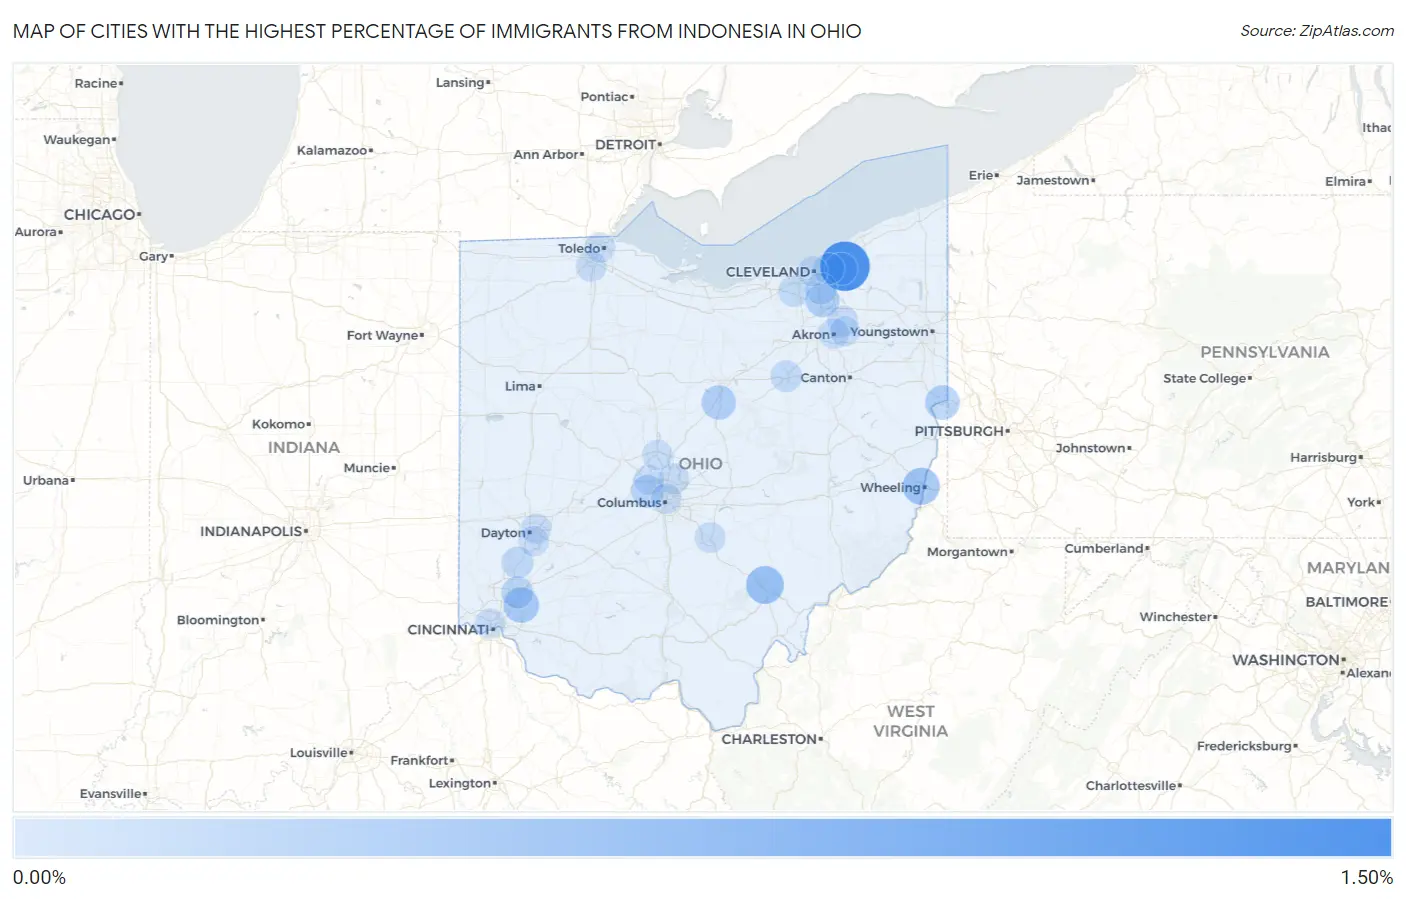
Map of Cities with the Highest Percentage of Immigrants from Indonesia in Ohio
0.00%
1.50%
Cities with the Highest Percentage of Immigrants from Indonesia in Ohio
| City | Indonesia | vs State | vs National | |
| 1. | Gates Mills | 1.20% | 0.0086%(+1.20)#-1 | 0.030%(+1.17)#0 |
| 2. | Chauncey | 0.46% | 0.0086%(+0.449)#0 | 0.030%(+0.428)#1 |
| 3. | Bridgeport | 0.41% | 0.0086%(+0.405)#1 | 0.030%(+0.384)#2 |
| 4. | Loveland | 0.32% | 0.0086%(+0.316)#2 | 0.030%(+0.295)#3 |
| 5. | East Liverpool | 0.26% | 0.0086%(+0.252)#3 | 0.030%(+0.231)#4 |
| 6. | Bellville | 0.25% | 0.0086%(+0.242)#4 | 0.030%(+0.221)#5 |
| 7. | Brecksville | 0.23% | 0.0086%(+0.226)#5 | 0.030%(+0.205)#6 |
| 8. | Hilliard | 0.16% | 0.0086%(+0.147)#31 | 0.030%(+0.125)#886 |
| 9. | Mayfield Heights | 0.12% | 0.0086%(+0.116)#32 | 0.030%(+0.094)#887 |
| 10. | Mason | 0.11% | 0.0086%(+0.104)#33 | 0.030%(+0.082)#888 |
| 11. | Franklin | 0.10% | 0.0086%(+0.094)#34 | 0.030%(+0.073)#889 |
| 12. | Wooster | 0.089% | 0.0086%(+0.080)#35 | 0.030%(+0.059)#890 |
| 13. | Independence | 0.080% | 0.0086%(+0.071)#36 | 0.030%(+0.050)#891 |
| 14. | Berea | 0.070% | 0.0086%(+0.061)#42 | 0.030%(+0.040)#1,291 |
| 15. | Cleveland Heights | 0.060% | 0.0086%(+0.051)#43 | 0.030%(+0.030)#1,292 |
| 16. | Stow | 0.049% | 0.0086%(+0.041)#44 | 0.030%(+0.019)#1,293 |
| 17. | Westerville | 0.046% | 0.0086%(+0.038)#45 | 0.030%(+0.016)#1,294 |
| 18. | Lancaster | 0.042% | 0.0086%(+0.033)#46 | 0.030%(+0.012)#1,295 |
| 19. | Perrysburg | 0.036% | 0.0086%(+0.028)#47 | 0.030%(+0.006)#1,296 |
| 20. | Dublin | 0.029% | 0.0086%(+0.020)#48 | 0.030%(-0.001)#1,297 |
| 21. | Akron | 0.028% | 0.0086%(+0.020)#49 | 0.030%(-0.002)#1,412 |
| 22. | Riverside | 0.025% | 0.0086%(+0.016)#50 | 0.030%(-0.006)#1,413 |
| 23. | Delaware | 0.024% | 0.0086%(+0.015)#51 | 0.030%(-0.006)#1,414 |
| 24. | Cincinnati | 0.021% | 0.0086%(+0.012)#52 | 0.030%(-0.009)#1,415 |
| 25. | Kettering | 0.017% | 0.0086%(+0.009)#53 | 0.030%(-0.013)#1,416 |
| 26. | Columbus | 0.016% | 0.0086%(+0.007)#54 | 0.030%(-0.014)#1,417 |
| 27. | Cleveland | 0.011% | 0.0086%(+0.002)#55 | 0.030%(-0.019)#1,418 |
| 28. | Toledo | 0.0096% | 0.0086%(+0.001)#56 | 0.030%(-0.020)#1,419 |
| 29. | Tallmadge | 0.0054% | 0.0086%(-0.003)#57 | 0.030%(-0.025)#1,420 |
Common Questions
What are the Top 10 Cities with the Highest Percentage of Immigrants from Indonesia in Ohio?
Top 10 Cities with the Highest Percentage of Immigrants from Indonesia in Ohio are:
#1
1.20%
#2
0.46%
#3
0.41%
#4
0.32%
#5
0.26%
#6
0.25%
#7
0.23%
#8
0.16%
#9
0.12%
#10
0.11%
What city has the Highest Percentage of Immigrants from Indonesia in Ohio?
Gates Mills has the Highest Percentage of Immigrants from Indonesia in Ohio with 1.20%.
What is the Percentage of Immigrants from Indonesia in the State of Ohio?
Percentage of Immigrants from Indonesia in Ohio is 0.0086%.
What is the Percentage of Immigrants from Indonesia in the United States?
Percentage of Immigrants from Indonesia in the United States is 0.030%.