Cities with the Highest Percentage of Immigrants from El Salvador in Michigan
RELATED REPORTS & OPTIONS
El Salvador
Michigan
Compare Cities
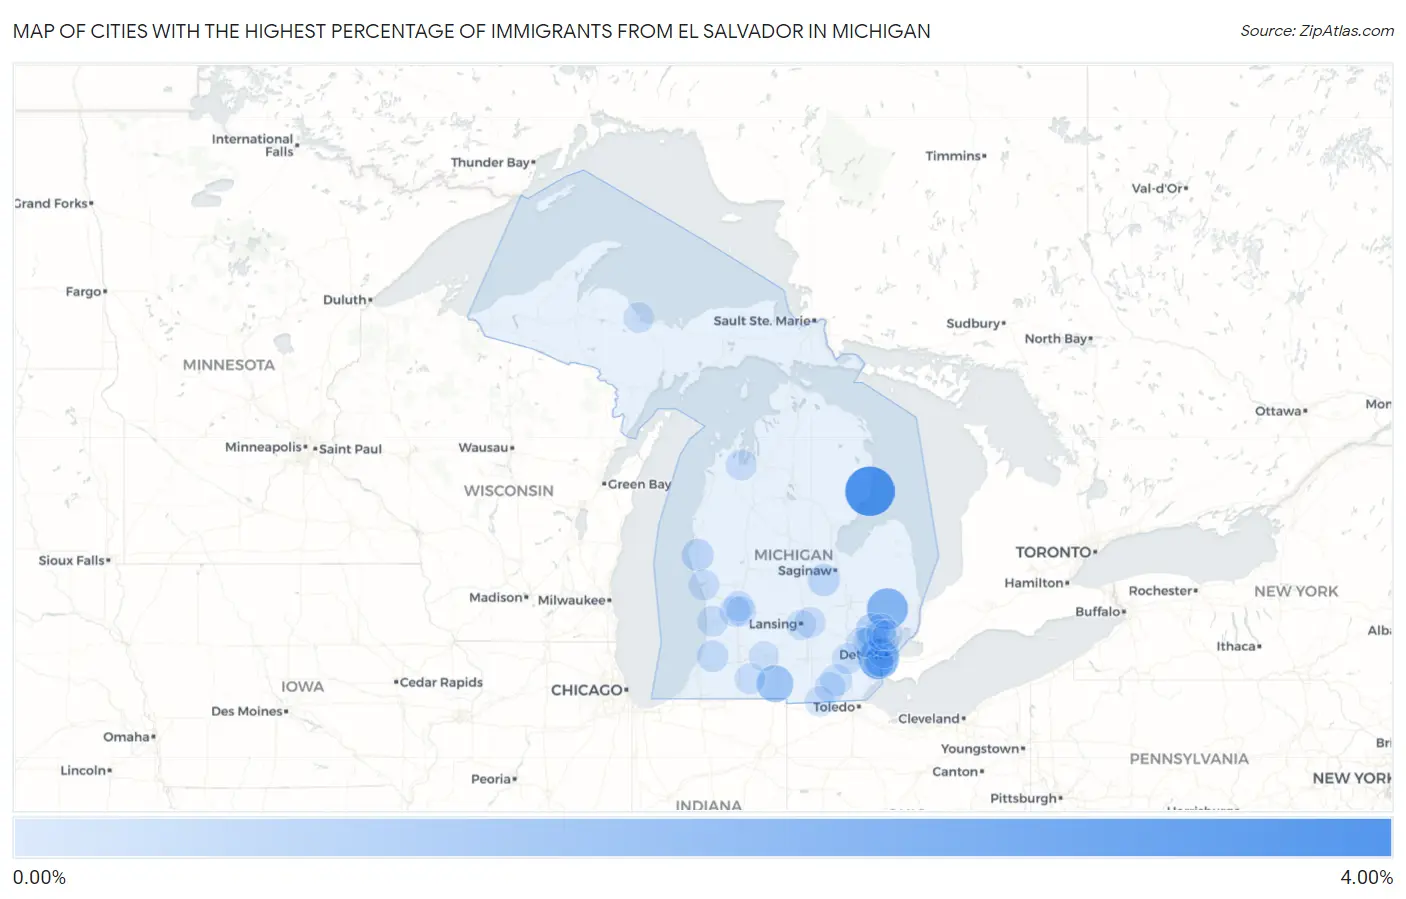
Map of Cities with the Highest Percentage of Immigrants from El Salvador in Michigan
0.00%
4.00%
Cities with the Highest Percentage of Immigrants from El Salvador in Michigan
| City | El Salvador | vs State | vs National | |
| 1. | Oscoda | 3.38% | 0.030%(+3.35)#-1 | 0.43%(+2.95)#0 |
| 2. | Almont | 1.88% | 0.030%(+1.85)#0 | 0.43%(+1.45)#1 |
| 3. | Melvindale | 1.76% | 0.030%(+1.73)#1 | 0.43%(+1.33)#2 |
| 4. | Coldwater | 1.10% | 0.030%(+1.07)#2 | 0.43%(+0.677)#3 |
| 5. | Pontiac | 0.57% | 0.030%(+0.540)#3 | 0.43%(+0.144)#4 |
| 6. | St Charles | 0.35% | 0.030%(+0.317)#4 | 0.43%(-0.079)#5 |
| 7. | Shelby | 0.32% | 0.030%(+0.288)#5 | 0.43%(-0.108)#6 |
| 8. | Southgate | 0.26% | 0.030%(+0.231)#6 | 0.43%(-0.165)#7 |
| 9. | Bangor | 0.24% | 0.030%(+0.212)#7 | 0.43%(-0.184)#8 |
| 10. | Ecorse | 0.22% | 0.030%(+0.186)#8 | 0.43%(-0.210)#9 |
| 11. | Tecumseh | 0.20% | 0.030%(+0.166)#9 | 0.43%(-0.229)#10 |
| 12. | Franklin | 0.15% | 0.030%(+0.121)#10 | 0.43%(-0.275)#11 |
| 13. | Wyoming | 0.14% | 0.030%(+0.111)#11 | 0.43%(-0.285)#1,333 |
| 14. | Haslett | 0.14% | 0.030%(+0.107)#12 | 0.43%(-0.289)#1,334 |
| 15. | Muskegon | 0.13% | 0.030%(+0.101)#13 | 0.43%(-0.295)#1,335 |
| 16. | Traverse City | 0.13% | 0.030%(+0.100)#14 | 0.43%(-0.296)#1,336 |
| 17. | Detroit | 0.13% | 0.030%(+0.099)#19 | 0.43%(-0.297)#1,717 |
| 18. | Mendon | 0.12% | 0.030%(+0.094)#20 | 0.43%(-0.302)#1,718 |
| 19. | Holland | 0.10% | 0.030%(+0.073)#21 | 0.43%(-0.323)#1,719 |
| 20. | Ann Arbor | 0.095% | 0.030%(+0.065)#22 | 0.43%(-0.330)#1,720 |
| 21. | Adrian | 0.087% | 0.030%(+0.058)#23 | 0.43%(-0.338)#1,721 |
| 22. | Lincoln Park | 0.073% | 0.030%(+0.043)#24 | 0.43%(-0.353)#1,722 |
| 23. | Novi | 0.068% | 0.030%(+0.039)#25 | 0.43%(-0.357)#1,723 |
| 24. | Grand Rapids | 0.063% | 0.030%(+0.033)#26 | 0.43%(-0.363)#1,724 |
| 25. | Morenci | 0.050% | 0.030%(+0.020)#27 | 0.43%(-0.375)#1,725 |
| 26. | Marquette | 0.048% | 0.030%(+0.019)#28 | 0.43%(-0.377)#1,726 |
| 27. | Madison Heights | 0.046% | 0.030%(+0.016)#29 | 0.43%(-0.380)#1,727 |
| 28. | Battle Creek | 0.019% | 0.030%(-0.011)#30 | 0.43%(-0.406)#1,728 |
| 29. | Kentwood | 0.019% | 0.030%(-0.011)#31 | 0.43%(-0.407)#1,729 |
| 30. | Rochester Hills | 0.014% | 0.030%(-0.015)#32 | 0.43%(-0.411)#1,730 |
| 31. | Lansing | 0.012% | 0.030%(-0.018)#33 | 0.43%(-0.414)#1,731 |
| 32. | Farmington Hills | 0.0096% | 0.030%(-0.020)#34 | 0.43%(-0.416)#1,732 |
| 33. | Troy | 0.0092% | 0.030%(-0.020)#35 | 0.43%(-0.416)#1,733 |
| 34. | Sterling Heights | 0.0082% | 0.030%(-0.021)#36 | 0.43%(-0.417)#1,840 |
Common Questions
What are the Top 10 Cities with the Highest Percentage of Immigrants from El Salvador in Michigan?
Top 10 Cities with the Highest Percentage of Immigrants from El Salvador in Michigan are:
#1
3.38%
#2
1.88%
#3
1.76%
#4
1.10%
#5
0.57%
#6
0.35%
#7
0.32%
#8
0.26%
#9
0.24%
#10
0.22%
What city has the Highest Percentage of Immigrants from El Salvador in Michigan?
Oscoda has the Highest Percentage of Immigrants from El Salvador in Michigan with 3.38%.
What is the Percentage of Immigrants from El Salvador in the State of Michigan?
Percentage of Immigrants from El Salvador in Michigan is 0.030%.
What is the Percentage of Immigrants from El Salvador in the United States?
Percentage of Immigrants from El Salvador in the United States is 0.43%.