Cities with the Highest Percentage of Immigrants from El Salvador in Ohio
RELATED REPORTS & OPTIONS
El Salvador
Ohio
Compare Cities
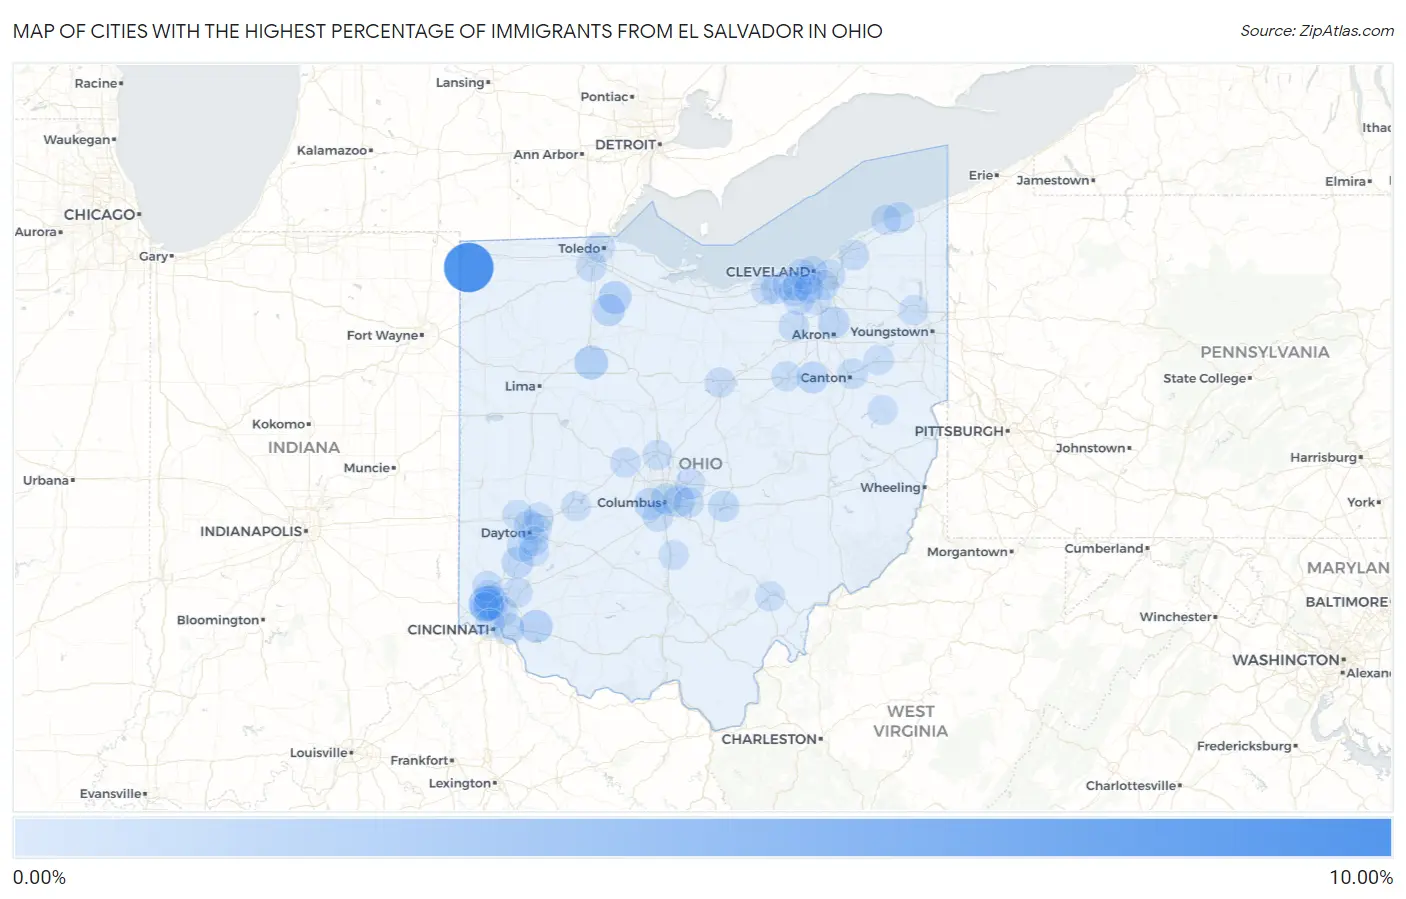
Map of Cities with the Highest Percentage of Immigrants from El Salvador in Ohio
0.00%
10.00%
Cities with the Highest Percentage of Immigrants from El Salvador in Ohio
| City | El Salvador | vs State | vs National | |
| 1. | Blakeslee | 8.33% | 0.067%(+8.27)#-1 | 0.43%(+7.91)#0 |
| 2. | Mount Healthy Heights | 2.04% | 0.067%(+1.97)#0 | 0.43%(+1.62)#1 |
| 3. | Forest Park | 1.64% | 0.067%(+1.58)#1 | 0.43%(+1.22)#2 |
| 4. | Arlington | 1.49% | 0.067%(+1.42)#2 | 0.43%(+1.06)#3 |
| 5. | Owensville | 1.14% | 0.067%(+1.07)#3 | 0.43%(+0.717)#4 |
| 6. | Bradner | 1.11% | 0.067%(+1.05)#4 | 0.43%(+0.689)#5 |
| 7. | West Millgrove | 0.91% | 0.067%(+0.842)#5 | 0.43%(+0.484)#6 |
| 8. | Lincoln Village | 0.74% | 0.067%(+0.676)#6 | 0.43%(+0.318)#7 |
| 9. | Whitehall | 0.73% | 0.067%(+0.666)#14 | 0.43%(+0.308)#1,227 |
| 10. | Dalton | 0.70% | 0.067%(+0.637)#15 | 0.43%(+0.279)#1,228 |
| 11. | Turpin Hills | 0.65% | 0.067%(+0.584)#16 | 0.43%(+0.226)#1,229 |
| 12. | Franklin | 0.64% | 0.067%(+0.575)#17 | 0.43%(+0.217)#1,230 |
| 13. | Cuyahoga Falls | 0.64% | 0.067%(+0.571)#18 | 0.43%(+0.213)#1,231 |
| 14. | Buckeye Lake | 0.52% | 0.067%(+0.449)#19 | 0.43%(+0.091)#1,232 |
| 15. | New Burlington | 0.51% | 0.067%(+0.440)#20 | 0.43%(+0.082)#1,233 |
| 16. | West Carrollton | 0.48% | 0.067%(+0.415)#21 | 0.43%(+0.057)#1,234 |
| 17. | Columbus | 0.38% | 0.067%(+0.310)#22 | 0.43%(-0.048)#1,235 |
| 18. | Geneva On The Lake | 0.37% | 0.067%(+0.301)#23 | 0.43%(-0.057)#1,236 |
| 19. | Perrysburg | 0.30% | 0.067%(+0.230)#24 | 0.43%(-0.128)#1,237 |
| 20. | Riverside | 0.29% | 0.067%(+0.227)#25 | 0.43%(-0.131)#1,238 |
| 21. | North Ridgeville | 0.29% | 0.067%(+0.223)#26 | 0.43%(-0.135)#1,239 |
| 22. | Canton | 0.28% | 0.067%(+0.217)#27 | 0.43%(-0.141)#1,240 |
| 23. | Grove City | 0.26% | 0.067%(+0.188)#28 | 0.43%(-0.169)#1,241 |
| 24. | Hamilton | 0.25% | 0.067%(+0.183)#29 | 0.43%(-0.175)#1,242 |
| 25. | Shaker Heights | 0.22% | 0.067%(+0.152)#30 | 0.43%(-0.206)#1,243 |
| 26. | Kirtland | 0.22% | 0.067%(+0.149)#31 | 0.43%(-0.208)#1,244 |
| 27. | Medina | 0.21% | 0.067%(+0.143)#32 | 0.43%(-0.215)#1,245 |
| 28. | Broadview Heights | 0.19% | 0.067%(+0.119)#33 | 0.43%(-0.239)#1,246 |
| 29. | Clayton | 0.18% | 0.067%(+0.113)#34 | 0.43%(-0.245)#1,247 |
| 30. | Centerville | 0.16% | 0.067%(+0.096)#35 | 0.43%(-0.262)#1,248 |
| 31. | New Albany | 0.16% | 0.067%(+0.094)#36 | 0.43%(-0.264)#1,249 |
| 32. | Strongsville | 0.16% | 0.067%(+0.088)#37 | 0.43%(-0.269)#1,250 |
| 33. | North Madison | 0.14% | 0.067%(+0.077)#38 | 0.43%(-0.281)#1,251 |
| 34. | Elyria | 0.14% | 0.067%(+0.075)#39 | 0.43%(-0.283)#1,252 |
| 35. | North Olmsted | 0.14% | 0.067%(+0.069)#40 | 0.43%(-0.289)#1,363 |
| 36. | Mason | 0.13% | 0.067%(+0.059)#41 | 0.43%(-0.299)#1,364 |
| 37. | Reynoldsburg | 0.12% | 0.067%(+0.057)#42 | 0.43%(-0.301)#1,365 |
| 38. | Dayton | 0.12% | 0.067%(+0.053)#43 | 0.43%(-0.304)#1,366 |
| 39. | Marysville | 0.12% | 0.067%(+0.049)#44 | 0.43%(-0.309)#1,367 |
| 40. | Brooklyn | 0.12% | 0.067%(+0.048)#45 | 0.43%(-0.310)#1,368 |
| 41. | Reading | 0.11% | 0.067%(+0.046)#46 | 0.43%(-0.311)#1,369 |
| 42. | Mansfield | 0.11% | 0.067%(+0.046)#47 | 0.43%(-0.312)#1,370 |
| 43. | Cleveland | 0.11% | 0.067%(+0.045)#48 | 0.43%(-0.313)#1,883 |
| 44. | Berea | 0.086% | 0.067%(+0.019)#49 | 0.43%(-0.339)#1,884 |
| 45. | Wooster | 0.078% | 0.067%(+0.010)#50 | 0.43%(-0.348)#1,885 |
| 46. | Northbrook | 0.071% | 0.067%(+0.004)#51 | 0.43%(-0.354)#1,886 |
| 47. | Alliance | 0.069% | 0.067%(+0.002)#52 | 0.43%(-0.356)#1,887 |
| 48. | Fairfield | 0.056% | 0.067%(-0.011)#53 | 0.43%(-0.369)#1,888 |
| 49. | Warren | 0.048% | 0.067%(-0.019)#54 | 0.43%(-0.377)#1,889 |
| 50. | Garfield Heights | 0.047% | 0.067%(-0.020)#55 | 0.43%(-0.378)#1,890 |
| 51. | Athens | 0.044% | 0.067%(-0.023)#56 | 0.43%(-0.381)#1,891 |
| 52. | Lakewood | 0.043% | 0.067%(-0.024)#57 | 0.43%(-0.382)#1,892 |
| 53. | Huber Heights | 0.039% | 0.067%(-0.028)#58 | 0.43%(-0.386)#1,893 |
| 54. | Delaware | 0.038% | 0.067%(-0.029)#59 | 0.43%(-0.387)#1,894 |
| 55. | Brook Park | 0.038% | 0.067%(-0.030)#60 | 0.43%(-0.388)#1,895 |
| 56. | Toledo | 0.031% | 0.067%(-0.036)#61 | 0.43%(-0.394)#1,896 |
| 57. | Carrollton | 0.031% | 0.067%(-0.037)#62 | 0.43%(-0.395)#1,897 |
| 58. | Circleville | 0.021% | 0.067%(-0.046)#63 | 0.43%(-0.404)#1,898 |
| 59. | Springfield | 0.020% | 0.067%(-0.047)#64 | 0.43%(-0.405)#1,899 |
| 60. | Parma | 0.0099% | 0.067%(-0.058)#65 | 0.43%(-0.415)#1,900 |
| 61. | Kettering | 0.0087% | 0.067%(-0.059)#66 | 0.43%(-0.417)#1,901 |
| 62. | Cincinnati | 0.0032% | 0.067%(-0.064)#67 | 0.43%(-0.422)#1,902 |
Common Questions
What are the Top 10 Cities with the Highest Percentage of Immigrants from El Salvador in Ohio?
Top 10 Cities with the Highest Percentage of Immigrants from El Salvador in Ohio are:
#1
8.33%
#2
2.04%
#3
1.64%
#4
1.49%
#5
1.14%
#6
1.11%
#7
0.91%
#8
0.74%
#9
0.73%
#10
0.70%
What city has the Highest Percentage of Immigrants from El Salvador in Ohio?
Blakeslee has the Highest Percentage of Immigrants from El Salvador in Ohio with 8.33%.
What is the Percentage of Immigrants from El Salvador in the State of Ohio?
Percentage of Immigrants from El Salvador in Ohio is 0.067%.
What is the Percentage of Immigrants from El Salvador in the United States?
Percentage of Immigrants from El Salvador in the United States is 0.43%.