Cities with the Highest Percentage of Households with Income Above $100,000 in Colorado
RELATED REPORTS & OPTIONS
Household Income | $100k+
Colorado
Compare Cities
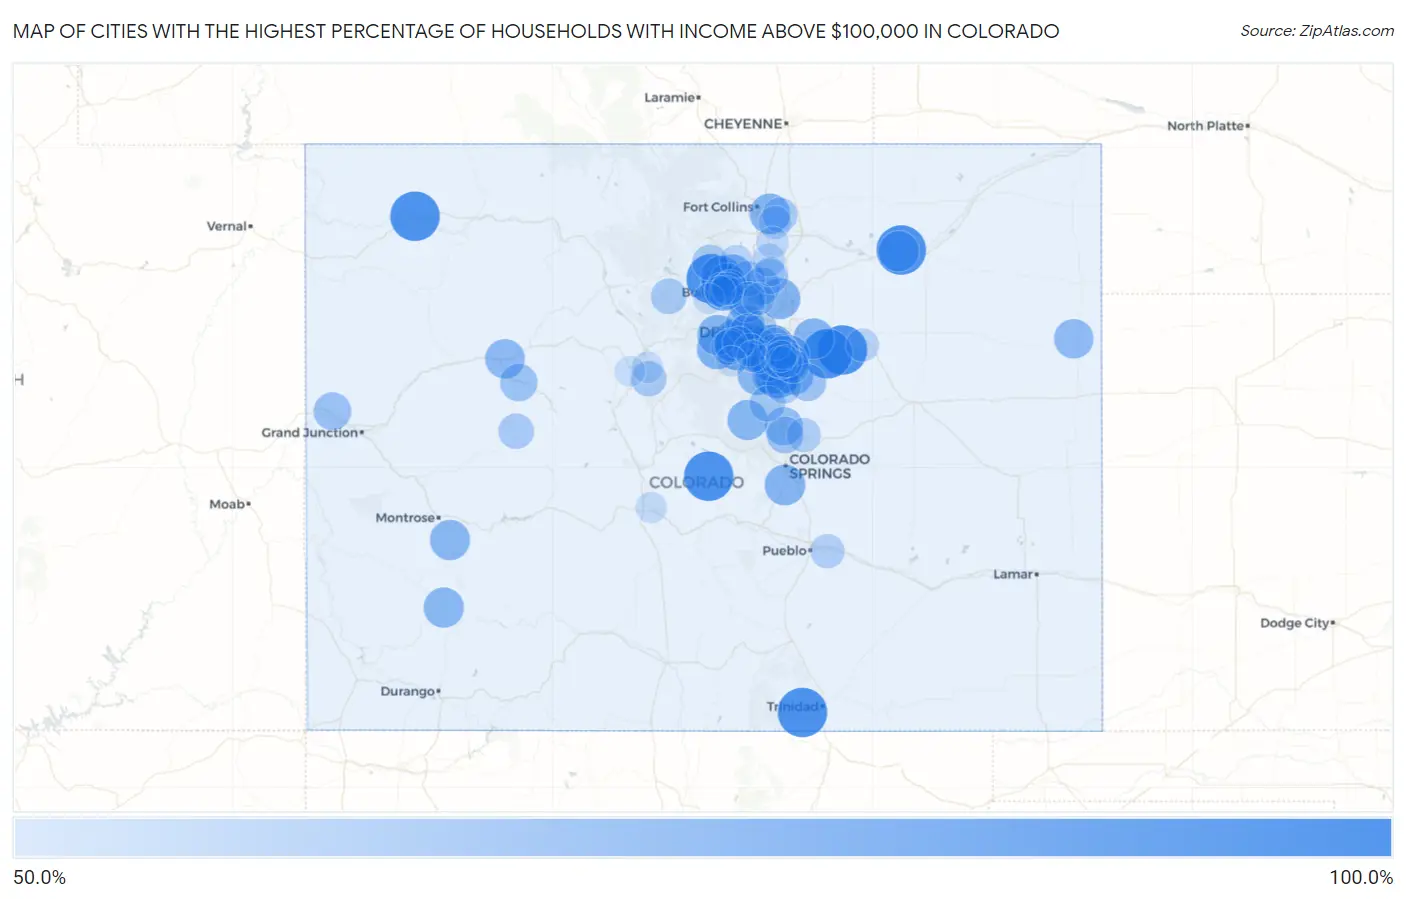
Map of Cities with the Highest Percentage of Households with Income Above $100,000 in Colorado
0.0%
100.0%
Cities with the Highest Percentage of Households with Income Above $100,000 in Colorado
| City | Households with Income > $100k | vs State | vs National | |
| 1. | Comanche Creek | 100.0% | 43.9%(+56.1)#1 | 37.3%(+62.7)#8 |
| 2. | Blue Sky | 100.0% | 43.9%(+56.1)#2 | 37.3%(+62.7)#64 |
| 3. | Brick Center | 100.0% | 43.9%(+56.1)#3 | 37.3%(+62.7)#73 |
| 4. | Guffey | 100.0% | 43.9%(+56.1)#4 | 37.3%(+62.7)#140 |
| 5. | Hidden Lake | 100.0% | 43.9%(+56.1)#5 | 37.3%(+62.7)#141 |
| 6. | Maybell | 100.0% | 43.9%(+56.1)#6 | 37.3%(+62.7)#156 |
| 7. | Valdez | 100.0% | 43.9%(+56.1)#7 | 37.3%(+62.7)#180 |
| 8. | Stepping Stone | 94.9% | 43.9%(+51.0)#8 | 37.3%(+57.6)#206 |
| 9. | Crisman | 92.3% | 43.9%(+48.4)#9 | 37.3%(+55.0)#221 |
| 10. | Cherry Hills Village | 89.6% | 43.9%(+45.7)#10 | 37.3%(+52.3)#262 |
| 11. | Echo Hills | 86.3% | 43.9%(+42.4)#11 | 37.3%(+49.0)#319 |
| 12. | Castle Pines Village | 86.2% | 43.9%(+42.3)#12 | 37.3%(+48.9)#321 |
| 13. | Indian Hills | 84.2% | 43.9%(+40.3)#13 | 37.3%(+46.9)#366 |
| 14. | Pine Valley | 83.7% | 43.9%(+39.8)#14 | 37.3%(+46.4)#380 |
| 15. | Sterling Ranch | 83.6% | 43.9%(+39.7)#15 | 37.3%(+46.3)#383 |
| 16. | Columbine Valley | 82.8% | 43.9%(+38.9)#16 | 37.3%(+45.5)#427 |
| 17. | Bow Mar | 81.7% | 43.9%(+37.8)#17 | 37.3%(+44.4)#471 |
| 18. | Genesee | 80.5% | 43.9%(+36.6)#18 | 37.3%(+43.2)#525 |
| 19. | Meridian | 80.5% | 43.9%(+36.6)#19 | 37.3%(+43.2)#526 |
| 20. | Altona | 80.3% | 43.9%(+36.4)#20 | 37.3%(+43.0)#532 |
| 21. | Jamestown | 80.3% | 43.9%(+36.4)#21 | 37.3%(+43.0)#533 |
| 22. | Upper Bear Creek | 79.6% | 43.9%(+35.7)#22 | 37.3%(+42.3)#572 |
| 23. | Todd Creek | 79.0% | 43.9%(+35.1)#23 | 37.3%(+41.7)#612 |
| 24. | Watkins | 78.9% | 43.9%(+35.0)#24 | 37.3%(+41.6)#619 |
| 25. | Rock Creek Park | 78.7% | 43.9%(+34.8)#25 | 37.3%(+41.4)#636 |
| 26. | Morgan Heights | 78.5% | 43.9%(+34.6)#26 | 37.3%(+41.2)#646 |
| 27. | East Pleasant View | 78.4% | 43.9%(+34.5)#27 | 37.3%(+41.1)#653 |
| 28. | Timnath | 78.2% | 43.9%(+34.3)#28 | 37.3%(+40.9)#662 |
| 29. | Floyd Hill | 77.9% | 43.9%(+34.0)#29 | 37.3%(+40.6)#693 |
| 30. | Colona | 77.5% | 43.9%(+33.6)#30 | 37.3%(+40.2)#731 |
| 31. | Westcreek | 77.3% | 43.9%(+33.4)#31 | 37.3%(+40.0)#742 |
| 32. | Ophir | 77.3% | 43.9%(+33.4)#32 | 37.3%(+40.0)#743 |
| 33. | Roxborough Park | 76.9% | 43.9%(+33.0)#33 | 37.3%(+39.6)#771 |
| 34. | No Name | 75.9% | 43.9%(+32.0)#34 | 37.3%(+38.6)#825 |
| 35. | Foxfield | 75.7% | 43.9%(+31.8)#35 | 37.3%(+38.4)#837 |
| 36. | The Pinery | 75.6% | 43.9%(+31.7)#36 | 37.3%(+38.3)#841 |
| 37. | Idalia | 75.6% | 43.9%(+31.7)#37 | 37.3%(+38.3)#848 |
| 38. | Fairmount | 75.2% | 43.9%(+31.3)#38 | 37.3%(+37.9)#874 |
| 39. | Castle Pines | 74.9% | 43.9%(+31.0)#39 | 37.3%(+37.6)#913 |
| 40. | Upper Witter Gulch | 73.6% | 43.9%(+29.7)#40 | 37.3%(+36.3)#1,019 |
| 41. | Stonegate | 73.4% | 43.9%(+29.5)#41 | 37.3%(+36.1)#1,035 |
| 42. | Woodmoor | 73.0% | 43.9%(+29.1)#42 | 37.3%(+35.7)#1,067 |
| 43. | Loma | 71.5% | 43.9%(+27.6)#43 | 37.3%(+34.2)#1,204 |
| 44. | Paragon Estates | 71.1% | 43.9%(+27.2)#44 | 37.3%(+33.8)#1,243 |
| 45. | Mulford | 71.1% | 43.9%(+27.2)#45 | 37.3%(+33.8)#1,244 |
| 46. | Erie | 71.0% | 43.9%(+27.1)#46 | 37.3%(+33.7)#1,247 |
| 47. | Highlands Ranch | 70.6% | 43.9%(+26.7)#47 | 37.3%(+33.3)#1,276 |
| 48. | Ponderosa Park | 70.3% | 43.9%(+26.4)#48 | 37.3%(+33.0)#1,309 |
| 49. | Superior | 70.2% | 43.9%(+26.3)#49 | 37.3%(+32.9)#1,310 |
| 50. | Gleneagle | 69.1% | 43.9%(+25.2)#50 | 37.3%(+31.8)#1,425 |
| 51. | Sedalia | 68.8% | 43.9%(+24.9)#51 | 37.3%(+31.5)#1,470 |
| 52. | Lazy Acres | 68.1% | 43.9%(+24.2)#52 | 37.3%(+30.8)#1,562 |
| 53. | Perry Park | 67.2% | 43.9%(+23.3)#53 | 37.3%(+29.9)#1,660 |
| 54. | Allenspark | 66.8% | 43.9%(+22.9)#54 | 37.3%(+29.5)#1,695 |
| 55. | Frederick | 66.7% | 43.9%(+22.8)#55 | 37.3%(+29.4)#1,698 |
| 56. | Niwot | 66.6% | 43.9%(+22.7)#56 | 37.3%(+29.3)#1,737 |
| 57. | Tabernash | 66.5% | 43.9%(+22.6)#57 | 37.3%(+29.2)#1,758 |
| 58. | Mountain Meadows | 66.3% | 43.9%(+22.4)#58 | 37.3%(+29.0)#1,785 |
| 59. | Blue River | 65.9% | 43.9%(+22.0)#59 | 37.3%(+28.6)#1,829 |
| 60. | Marble | 65.9% | 43.9%(+22.0)#60 | 37.3%(+28.6)#1,830 |
| 61. | Severance | 65.4% | 43.9%(+21.5)#61 | 37.3%(+28.1)#1,887 |
| 62. | Brook Forest | 65.3% | 43.9%(+21.4)#62 | 37.3%(+28.0)#1,900 |
| 63. | Greenwood Village | 65.1% | 43.9%(+21.2)#63 | 37.3%(+27.8)#1,918 |
| 64. | Applewood | 64.7% | 43.9%(+20.8)#64 | 37.3%(+27.4)#1,972 |
| 65. | Cherry Creek | 64.6% | 43.9%(+20.7)#65 | 37.3%(+27.3)#1,980 |
| 66. | Evergreen | 64.6% | 43.9%(+20.7)#66 | 37.3%(+27.3)#1,981 |
| 67. | Pine Brook Hill | 64.5% | 43.9%(+20.6)#67 | 37.3%(+27.2)#2,003 |
| 68. | Castle Rock | 64.4% | 43.9%(+20.5)#68 | 37.3%(+27.1)#2,006 |
| 69. | Black Forest | 63.4% | 43.9%(+19.5)#69 | 37.3%(+26.1)#2,141 |
| 70. | Vineland | 63.4% | 43.9%(+19.5)#70 | 37.3%(+26.1)#2,149 |
| 71. | Tall Timber | 63.3% | 43.9%(+19.4)#71 | 37.3%(+26.0)#2,164 |
| 72. | Columbine | 63.2% | 43.9%(+19.3)#72 | 37.3%(+25.9)#2,168 |
| 73. | Acres Green | 63.0% | 43.9%(+19.1)#73 | 37.3%(+25.7)#2,217 |
| 74. | Kittredge | 62.7% | 43.9%(+18.8)#74 | 37.3%(+25.4)#2,271 |
| 75. | Parker | 62.0% | 43.9%(+18.1)#75 | 37.3%(+24.7)#2,376 |
| 76. | Louisville | 61.9% | 43.9%(+18.0)#76 | 37.3%(+24.6)#2,397 |
| 77. | Centennial | 61.3% | 43.9%(+17.4)#77 | 37.3%(+24.0)#2,501 |
| 78. | Mountain View | 61.2% | 43.9%(+17.3)#78 | 37.3%(+23.9)#2,536 |
| 79. | Peoria | 60.7% | 43.9%(+16.8)#79 | 37.3%(+23.4)#2,621 |
| 80. | Windsor | 60.5% | 43.9%(+16.6)#80 | 37.3%(+23.2)#2,641 |
| 81. | Dakota Ridge | 60.3% | 43.9%(+16.4)#81 | 37.3%(+23.0)#2,675 |
| 82. | Mead | 60.2% | 43.9%(+16.3)#82 | 37.3%(+22.9)#2,695 |
| 83. | Lyons | 60.2% | 43.9%(+16.3)#83 | 37.3%(+22.9)#2,698 |
| 84. | Seven Hills | 60.0% | 43.9%(+16.1)#84 | 37.3%(+22.7)#2,734 |
| 85. | Sierra Ridge | 59.7% | 43.9%(+15.8)#85 | 37.3%(+22.4)#2,792 |
| 86. | Holly Hills | 59.5% | 43.9%(+15.6)#86 | 37.3%(+22.2)#2,834 |
| 87. | Lone Tree | 59.3% | 43.9%(+15.4)#87 | 37.3%(+22.0)#2,860 |
| 88. | Grand View Estates | 58.9% | 43.9%(+15.0)#88 | 37.3%(+21.6)#2,934 |
| 89. | Broomfield | 58.7% | 43.9%(+14.8)#89 | 37.3%(+21.4)#2,958 |
| 90. | Idledale | 58.3% | 43.9%(+14.4)#90 | 37.3%(+21.0)#3,032 |
| 91. | Johnstown | 58.0% | 43.9%(+14.1)#91 | 37.3%(+20.7)#3,068 |
| 92. | Breckenridge | 57.1% | 43.9%(+13.2)#92 | 37.3%(+19.8)#3,218 |
| 93. | Smeltertown | 57.1% | 43.9%(+13.2)#93 | 37.3%(+19.8)#3,223 |
| 94. | Ken Caryl | 56.9% | 43.9%(+13.0)#94 | 37.3%(+19.6)#3,249 |
| 95. | Inverness | 56.4% | 43.9%(+12.5)#95 | 37.3%(+19.1)#3,350 |
| 96. | Copper Mountain | 55.3% | 43.9%(+11.4)#96 | 37.3%(+18.0)#3,558 |
| 97. | Nederland | 55.2% | 43.9%(+11.3)#97 | 37.3%(+17.9)#3,570 |
| 98. | Sugarloaf | 55.1% | 43.9%(+11.2)#98 | 37.3%(+17.8)#3,595 |
| 99. | Aspen Park | 54.8% | 43.9%(+10.9)#99 | 37.3%(+17.5)#3,654 |
| 100. | Firestone | 53.8% | 43.9%(+9.90)#100 | 37.3%(+16.5)#3,841 |
Common Questions
What are the Top 10 Cities with the Highest Percentage of Households with Income Above $100,000 in Colorado?
Top 10 Cities with the Highest Percentage of Households with Income Above $100,000 in Colorado are:
#1
100.0%
#2
100.0%
#3
100.0%
#4
100.0%
#5
100.0%
#6
100.0%
#7
100.0%
#8
92.3%
#9
89.6%
#10
86.2%
What city has the Highest Percentage of Households with Income Above $100,000 in Colorado?
Comanche Creek has the Highest Percentage of Households with Income Above $100,000 in Colorado with 100.0%.
What is the Percentage of Households with Income Above $100,000 in the State of Colorado?
Percentage of Households with Income Above $100,000 in Colorado is 43.9%.
What is the Percentage of Households with Income Above $100,000 in the United States?
Percentage of Households with Income Above $100,000 in the United States is 37.3%.