Cities with the Highest Percentage of Households with Income Above $100,000 in Tennessee
RELATED REPORTS & OPTIONS
Household Income | $100k+
Tennessee
Compare Cities
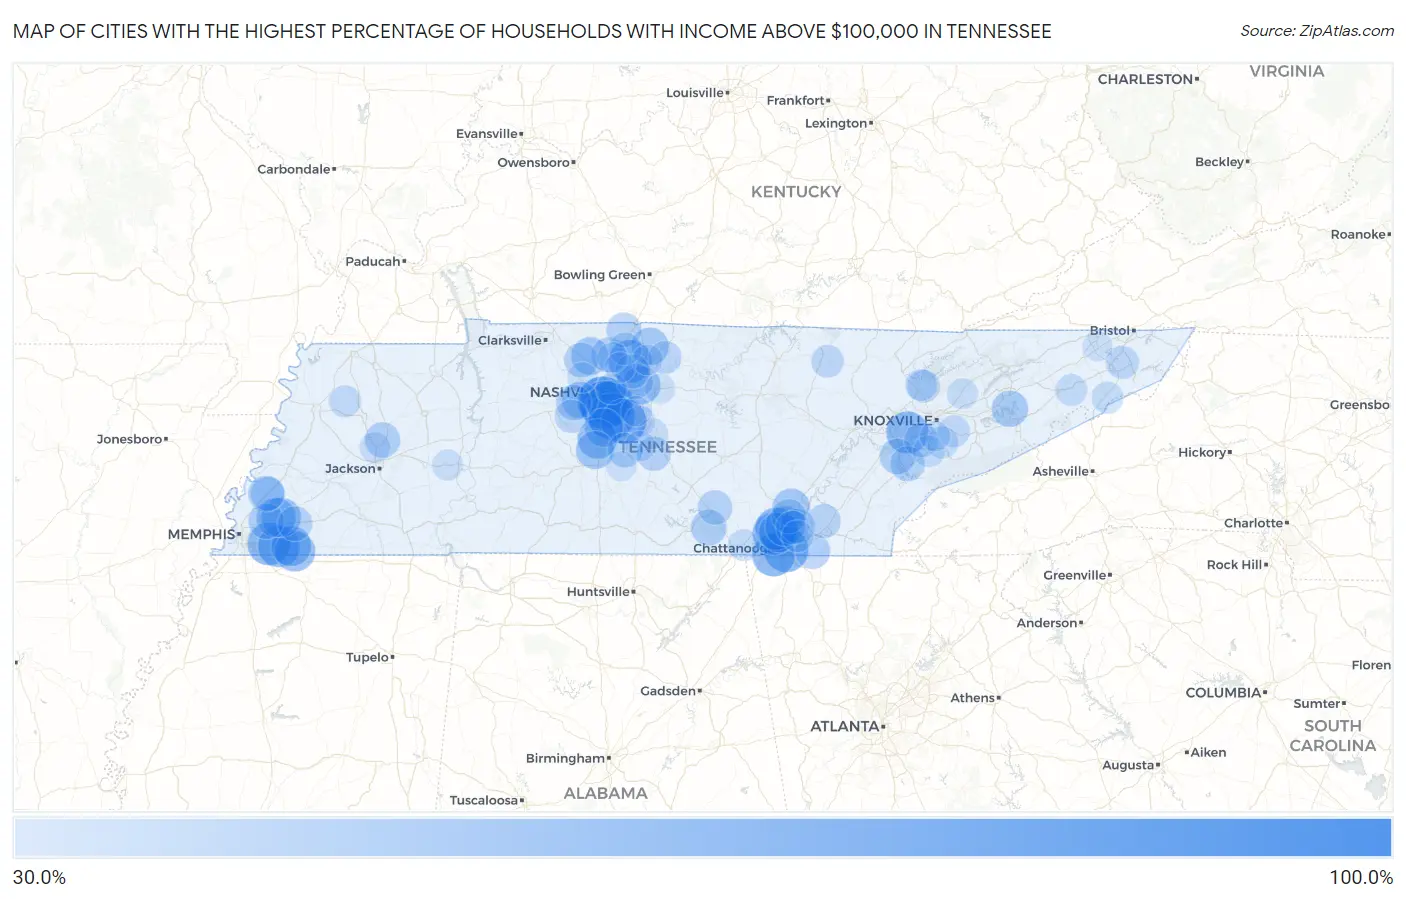
Map of Cities with the Highest Percentage of Households with Income Above $100,000 in Tennessee
0.0%
100.0%
Cities with the Highest Percentage of Households with Income Above $100,000 in Tennessee
| City | Households with Income > $100k | vs State | vs National | |
| 1. | Norene | 100.0% | 29.7%(+70.3)#1 | 37.3%(+62.7)#12 |
| 2. | Taft | 87.5% | 29.7%(+57.8)#2 | 37.3%(+50.2)#298 |
| 3. | Belle Meade | 84.6% | 29.7%(+54.9)#3 | 37.3%(+47.3)#354 |
| 4. | Forest Hills | 79.8% | 29.7%(+50.1)#4 | 37.3%(+42.5)#561 |
| 5. | Brentwood | 77.0% | 29.7%(+47.3)#5 | 37.3%(+39.7)#764 |
| 6. | Oak Hill | 75.6% | 29.7%(+45.9)#6 | 37.3%(+38.3)#844 |
| 7. | Nolensville | 72.5% | 29.7%(+42.8)#7 | 37.3%(+35.2)#1,110 |
| 8. | Ridgeside | 69.7% | 29.7%(+40.0)#8 | 37.3%(+32.4)#1,362 |
| 9. | Lookout Mountain | 66.3% | 29.7%(+36.6)#9 | 37.3%(+29.0)#1,781 |
| 10. | Germantown | 65.9% | 29.7%(+36.2)#10 | 37.3%(+28.6)#1,822 |
| 11. | Shackle Island | 65.9% | 29.7%(+36.2)#11 | 37.3%(+28.6)#1,826 |
| 12. | Signal Mountain | 64.7% | 29.7%(+35.0)#12 | 37.3%(+27.4)#1,971 |
| 13. | Farragut | 64.5% | 29.7%(+34.8)#13 | 37.3%(+27.2)#1,991 |
| 14. | Fairmount | 64.1% | 29.7%(+34.4)#14 | 37.3%(+26.8)#2,057 |
| 15. | Collierville | 63.1% | 29.7%(+33.4)#15 | 37.3%(+25.8)#2,182 |
| 16. | Rossville | 59.7% | 29.7%(+30.0)#16 | 37.3%(+22.4)#2,795 |
| 17. | Piperton | 58.8% | 29.7%(+29.1)#17 | 37.3%(+21.5)#2,945 |
| 18. | Rarity Bay | 58.8% | 29.7%(+29.1)#18 | 37.3%(+21.5)#2,947 |
| 19. | Pocahontas | 58.8% | 29.7%(+29.1)#19 | 37.3%(+21.5)#2,949 |
| 20. | Walden | 57.6% | 29.7%(+27.9)#20 | 37.3%(+20.3)#3,135 |
| 21. | Falling Water | 57.5% | 29.7%(+27.8)#21 | 37.3%(+20.2)#3,153 |
| 22. | Thompson S Station | 57.2% | 29.7%(+27.5)#22 | 37.3%(+19.9)#3,204 |
| 23. | Arlington | 57.0% | 29.7%(+27.3)#23 | 37.3%(+19.7)#3,239 |
| 24. | Lakeland | 56.6% | 29.7%(+26.9)#24 | 37.3%(+19.3)#3,304 |
| 25. | Luray | 54.4% | 29.7%(+24.7)#25 | 37.3%(+17.1)#3,740 |
| 26. | Franklin | 53.9% | 29.7%(+24.2)#26 | 37.3%(+16.6)#3,823 |
| 27. | Mount Juliet | 53.6% | 29.7%(+23.9)#27 | 37.3%(+16.3)#3,889 |
| 28. | Spring Hill | 53.3% | 29.7%(+23.6)#28 | 37.3%(+16.0)#3,952 |
| 29. | Coopertown | 52.0% | 29.7%(+22.3)#29 | 37.3%(+14.7)#4,252 |
| 30. | Flat Top Mountain | 52.0% | 29.7%(+22.3)#30 | 37.3%(+14.7)#4,258 |
| 31. | Graball | 51.2% | 29.7%(+21.5)#31 | 37.3%(+13.9)#4,445 |
| 32. | Delano | 48.9% | 29.7%(+19.2)#32 | 37.3%(+11.6)#5,034 |
| 33. | Pegram | 48.4% | 29.7%(+18.7)#33 | 37.3%(+11.1)#5,153 |
| 34. | Baneberry | 48.3% | 29.7%(+18.6)#34 | 37.3%(+11.0)#5,185 |
| 35. | Munford | 47.6% | 29.7%(+17.9)#35 | 37.3%(+10.3)#5,361 |
| 36. | Karns | 47.3% | 29.7%(+17.6)#36 | 37.3%(+10.00)#5,453 |
| 37. | Kahite | 47.1% | 29.7%(+17.4)#37 | 37.3%(+9.80)#5,521 |
| 38. | Green Hill | 46.8% | 29.7%(+17.1)#38 | 37.3%(+9.50)#5,597 |
| 39. | Sewanee | 46.6% | 29.7%(+16.9)#39 | 37.3%(+9.30)#5,657 |
| 40. | Bartlett | 46.5% | 29.7%(+16.8)#40 | 37.3%(+9.20)#5,676 |
| 41. | Tellico Village | 46.3% | 29.7%(+16.6)#41 | 37.3%(+9.00)#5,741 |
| 42. | Kingston Springs | 45.8% | 29.7%(+16.1)#42 | 37.3%(+8.50)#5,884 |
| 43. | Medina | 45.6% | 29.7%(+15.9)#43 | 37.3%(+8.30)#5,941 |
| 44. | Apison | 45.1% | 29.7%(+15.4)#44 | 37.3%(+7.80)#6,078 |
| 45. | Greenbrier | 45.0% | 29.7%(+15.3)#45 | 37.3%(+7.70)#6,116 |
| 46. | Ocoee | 44.8% | 29.7%(+15.1)#46 | 37.3%(+7.50)#6,190 |
| 47. | Greenback | 44.2% | 29.7%(+14.5)#47 | 37.3%(+6.90)#6,357 |
| 48. | Lakesite | 44.1% | 29.7%(+14.4)#48 | 37.3%(+6.80)#6,381 |
| 49. | Orlinda | 44.0% | 29.7%(+14.3)#49 | 37.3%(+6.70)#6,416 |
| 50. | Oakland | 43.8% | 29.7%(+14.1)#50 | 37.3%(+6.50)#6,466 |
| 51. | Eagleville | 43.7% | 29.7%(+14.0)#51 | 37.3%(+6.40)#6,510 |
| 52. | Hendersonville | 43.4% | 29.7%(+13.7)#52 | 37.3%(+6.10)#6,587 |
| 53. | Pleasant View | 43.4% | 29.7%(+13.7)#53 | 37.3%(+6.10)#6,597 |
| 54. | Mowbray Mountain | 43.1% | 29.7%(+13.4)#54 | 37.3%(+5.80)#6,698 |
| 55. | Pelham | 43.0% | 29.7%(+13.3)#55 | 37.3%(+5.70)#6,729 |
| 56. | Christiana | 42.5% | 29.7%(+12.8)#56 | 37.3%(+5.20)#6,875 |
| 57. | Gladeville | 42.4% | 29.7%(+12.7)#57 | 37.3%(+5.10)#6,916 |
| 58. | Louisville | 42.3% | 29.7%(+12.6)#58 | 37.3%(+5.00)#6,954 |
| 59. | Walnut Grove Cdp Sumner County | 41.9% | 29.7%(+12.2)#59 | 37.3%(+4.60)#7,081 |
| 60. | Atoka | 41.8% | 29.7%(+12.1)#60 | 37.3%(+4.50)#7,094 |
| 61. | Hopewell | 41.7% | 29.7%(+12.0)#61 | 37.3%(+4.40)#7,125 |
| 62. | Middle Valley | 40.4% | 29.7%(+10.7)#62 | 37.3%(+3.10)#7,568 |
| 63. | Fairview | 39.7% | 29.7%(+10.0)#63 | 37.3%(+2.40)#7,828 |
| 64. | Watauga | 39.3% | 29.7%(+9.60)#64 | 37.3%(+2.00)#7,957 |
| 65. | Lenox | 39.3% | 29.7%(+9.60)#65 | 37.3%(+2.00)#7,961 |
| 66. | Castalian Springs | 38.9% | 29.7%(+9.20)#66 | 37.3%(+1.60)#8,121 |
| 67. | Andersonville | 38.4% | 29.7%(+8.70)#67 | 37.3%(+1.10)#8,349 |
| 68. | White House | 38.1% | 29.7%(+8.40)#68 | 37.3%(+0.800)#8,421 |
| 69. | Allardt | 38.0% | 29.7%(+8.30)#69 | 37.3%(+0.700)#8,473 |
| 70. | Yorkville | 36.7% | 29.7%(+7.00)#70 | 37.3%(-0.600)#8,994 |
| 71. | Seymour | 36.6% | 29.7%(+6.90)#71 | 37.3%(-0.700)#9,003 |
| 72. | Harrison | 36.4% | 29.7%(+6.70)#72 | 37.3%(-0.900)#9,080 |
| 73. | Tusculum | 36.3% | 29.7%(+6.60)#73 | 37.3%(-1.00)#9,132 |
| 74. | Oak Grove Cdp Washington County | 36.2% | 29.7%(+6.50)#74 | 37.3%(-1.10)#9,167 |
| 75. | Wildwood | 36.1% | 29.7%(+6.40)#75 | 37.3%(-1.20)#9,221 |
| 76. | Maryville | 36.0% | 29.7%(+6.30)#76 | 37.3%(-1.30)#9,252 |
| 77. | Jasper | 35.9% | 29.7%(+6.20)#77 | 37.3%(-1.40)#9,314 |
| 78. | Banner Hill | 35.9% | 29.7%(+6.20)#78 | 37.3%(-1.40)#9,321 |
| 79. | Norris | 35.7% | 29.7%(+6.00)#79 | 37.3%(-1.60)#9,390 |
| 80. | Whiteside | 35.6% | 29.7%(+5.90)#80 | 37.3%(-1.70)#9,447 |
| 81. | Chewalla | 35.4% | 29.7%(+5.70)#81 | 37.3%(-1.90)#9,545 |
| 82. | Nashville | 34.3% | 29.7%(+4.60)#82 | 37.3%(-3.00)#10,013 |
| 83. | Three Way | 34.2% | 29.7%(+4.50)#83 | 37.3%(-3.10)#10,080 |
| 84. | Murfreesboro | 34.0% | 29.7%(+4.30)#84 | 37.3%(-3.30)#10,155 |
| 85. | Hickman | 33.7% | 29.7%(+4.00)#85 | 37.3%(-3.60)#10,319 |
| 86. | Darden | 33.6% | 29.7%(+3.90)#86 | 37.3%(-3.70)#10,357 |
| 87. | Blaine | 33.2% | 29.7%(+3.50)#87 | 37.3%(-4.10)#10,574 |
| 88. | Ridgetop | 32.9% | 29.7%(+3.20)#88 | 37.3%(-4.40)#10,708 |
| 89. | Smyrna | 32.8% | 29.7%(+3.10)#89 | 37.3%(-4.50)#10,734 |
| 90. | Rockvale | 32.8% | 29.7%(+3.10)#90 | 37.3%(-4.50)#10,755 |
| 91. | Powell | 32.6% | 29.7%(+2.90)#91 | 37.3%(-4.70)#10,831 |
| 92. | Gallatin | 32.5% | 29.7%(+2.80)#92 | 37.3%(-4.80)#10,872 |
| 93. | Ashland City | 32.4% | 29.7%(+2.70)#93 | 37.3%(-4.90)#10,938 |
| 94. | Goodlettsville | 32.3% | 29.7%(+2.60)#94 | 37.3%(-5.00)#10,981 |
| 95. | La Vergne | 32.2% | 29.7%(+2.50)#95 | 37.3%(-5.10)#11,021 |
| 96. | Rockford | 32.1% | 29.7%(+2.40)#96 | 37.3%(-5.20)#11,106 |
| 97. | Chapel Hill | 31.9% | 29.7%(+2.20)#97 | 37.3%(-5.40)#11,194 |
| 98. | Lebanon | 31.8% | 29.7%(+2.10)#98 | 37.3%(-5.50)#11,213 |
| 99. | Sullivan Gardens | 31.6% | 29.7%(+1.90)#99 | 37.3%(-5.70)#11,333 |
| 100. | Colonial Heights | 31.4% | 29.7%(+1.70)#100 | 37.3%(-5.90)#11,424 |
Common Questions
What are the Top 10 Cities with the Highest Percentage of Households with Income Above $100,000 in Tennessee?
Top 10 Cities with the Highest Percentage of Households with Income Above $100,000 in Tennessee are:
#1
84.6%
#2
79.8%
#3
77.0%
#4
75.6%
#5
72.5%
#6
69.7%
#7
66.3%
#8
65.9%
#9
65.9%
#10
64.7%
What city has the Highest Percentage of Households with Income Above $100,000 in Tennessee?
Belle Meade has the Highest Percentage of Households with Income Above $100,000 in Tennessee with 84.6%.
What is the Percentage of Households with Income Above $100,000 in the State of Tennessee?
Percentage of Households with Income Above $100,000 in Tennessee is 29.7%.
What is the Percentage of Households with Income Above $100,000 in the United States?
Percentage of Households with Income Above $100,000 in the United States is 37.3%.