Cities with the Highest Percentage of Households with Income Above $100,000 in Oregon
RELATED REPORTS & OPTIONS
Household Income | $100k+
Oregon
Compare Cities
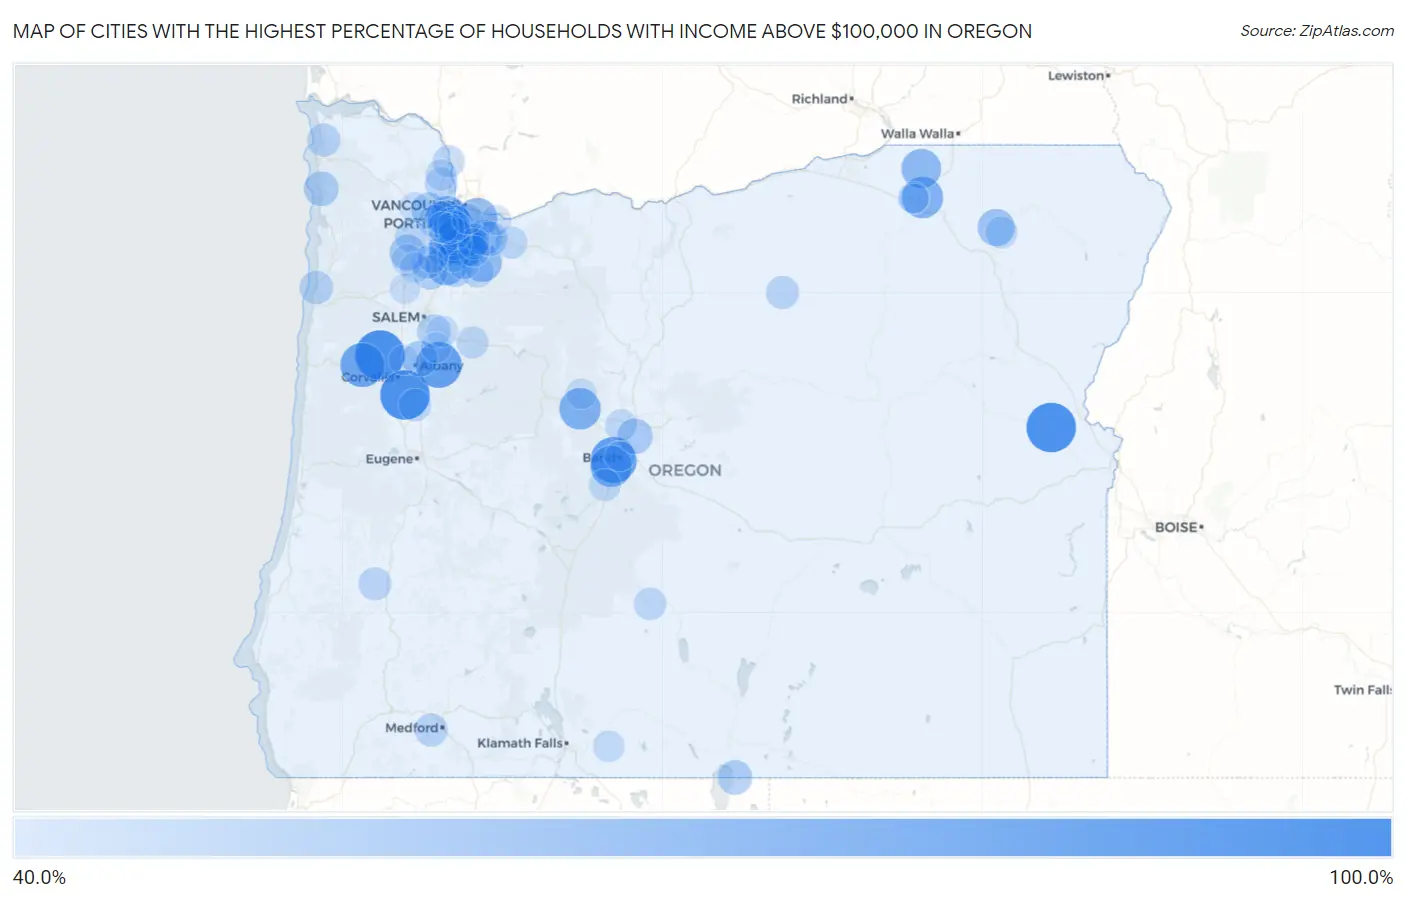
Map of Cities with the Highest Percentage of Households with Income Above $100,000 in Oregon
0.0%
100.0%
Cities with the Highest Percentage of Households with Income Above $100,000 in Oregon
| City | Households with Income > $100k | vs State | vs National | |
| 1. | Kings Valley | 100.0% | 37.6%(+62.4)#1 | 37.3%(+62.7)#36 |
| 2. | Peoria | 100.0% | 37.6%(+62.4)#2 | 37.3%(+62.7)#135 |
| 3. | Brogan | 100.0% | 37.6%(+62.4)#3 | 37.3%(+62.7)#167 |
| 4. | Mckay | 91.7% | 37.6%(+54.1)#4 | 37.3%(+54.4)#226 |
| 5. | Tetherow | 89.2% | 37.6%(+51.6)#5 | 37.3%(+51.9)#271 |
| 6. | Crabtree | 88.3% | 37.6%(+50.7)#6 | 37.3%(+51.0)#283 |
| 7. | Summit | 83.3% | 37.6%(+45.7)#7 | 37.3%(+46.0)#400 |
| 8. | Dunthorpe | 82.4% | 37.6%(+44.8)#8 | 37.3%(+45.1)#447 |
| 9. | Stafford | 77.9% | 37.6%(+40.3)#9 | 37.3%(+40.6)#690 |
| 10. | Dilley | 77.9% | 37.6%(+40.3)#10 | 37.3%(+40.6)#695 |
| 11. | Seventh Mountain | 75.2% | 37.6%(+37.6)#11 | 37.3%(+37.9)#879 |
| 12. | Black Butte Ranch | 75.0% | 37.6%(+37.4)#12 | 37.3%(+37.7)#900 |
| 13. | Kirkpatrick | 74.9% | 37.6%(+37.3)#13 | 37.3%(+37.6)#917 |
| 14. | Butteville | 72.5% | 37.6%(+34.9)#14 | 37.3%(+35.2)#1,115 |
| 15. | Running Y Ranch | 72.0% | 37.6%(+34.4)#15 | 37.3%(+34.7)#1,161 |
| 16. | Bethany | 71.8% | 37.6%(+34.2)#16 | 37.3%(+34.5)#1,173 |
| 17. | Rivergrove | 70.2% | 37.6%(+32.6)#17 | 37.3%(+32.9)#1,317 |
| 18. | Helix | 69.5% | 37.6%(+31.9)#18 | 37.3%(+32.2)#1,387 |
| 19. | Maywood Park | 68.4% | 37.6%(+30.8)#19 | 37.3%(+31.1)#1,523 |
| 20. | Bull Mountain | 66.7% | 37.6%(+29.1)#20 | 37.3%(+29.4)#1,701 |
| 21. | Beavercreek | 66.3% | 37.6%(+28.7)#21 | 37.3%(+29.0)#1,780 |
| 22. | Cedar Mill | 63.5% | 37.6%(+25.9)#22 | 37.3%(+26.2)#2,132 |
| 23. | Lake Oswego | 62.1% | 37.6%(+24.5)#23 | 37.3%(+24.8)#2,360 |
| 24. | Summerville | 61.7% | 37.6%(+24.1)#24 | 37.3%(+24.4)#2,449 |
| 25. | West Linn | 60.9% | 37.6%(+23.3)#25 | 37.3%(+23.6)#2,583 |
| 26. | Oak Hills | 60.3% | 37.6%(+22.7)#26 | 37.3%(+23.0)#2,678 |
| 27. | West Haven Sylvan | 60.0% | 37.6%(+22.4)#27 | 37.3%(+22.7)#2,728 |
| 28. | Happy Valley | 58.9% | 37.6%(+21.3)#28 | 37.3%(+21.6)#2,922 |
| 29. | Millersburg | 57.7% | 37.6%(+20.1)#29 | 37.3%(+20.4)#3,120 |
| 30. | Meacham | 57.7% | 37.6%(+20.1)#30 | 37.3%(+20.4)#3,123 |
| 31. | Saunders Lake | 57.6% | 37.6%(+20.0)#31 | 37.3%(+20.3)#3,136 |
| 32. | Yamhill | 57.5% | 37.6%(+19.9)#32 | 37.3%(+20.2)#3,158 |
| 33. | Pronghorn | 57.1% | 37.6%(+19.5)#33 | 37.3%(+19.8)#3,221 |
| 34. | Sherwood | 56.6% | 37.6%(+19.0)#34 | 37.3%(+19.3)#3,302 |
| 35. | Orient | 56.6% | 37.6%(+19.0)#35 | 37.3%(+19.3)#3,316 |
| 36. | North Plains | 55.1% | 37.6%(+17.5)#36 | 37.3%(+17.8)#3,591 |
| 37. | Neahkahnie | 54.9% | 37.6%(+17.3)#37 | 37.3%(+17.6)#3,639 |
| 38. | New Pine Creek | 54.3% | 37.6%(+16.7)#38 | 37.3%(+17.0)#3,759 |
| 39. | Damascus | 53.9% | 37.6%(+16.3)#39 | 37.3%(+16.6)#3,827 |
| 40. | Raleigh Hills | 53.8% | 37.6%(+16.2)#40 | 37.3%(+16.5)#3,846 |
| 41. | St Paul | 53.3% | 37.6%(+15.7)#41 | 37.3%(+16.0)#3,968 |
| 42. | Tualatin | 52.9% | 37.6%(+15.3)#42 | 37.3%(+15.6)#4,026 |
| 43. | Cedar Hills | 52.8% | 37.6%(+15.2)#43 | 37.3%(+15.5)#4,054 |
| 44. | Green Meadows | 52.2% | 37.6%(+14.6)#44 | 37.3%(+14.9)#4,212 |
| 45. | Boring | 52.1% | 37.6%(+14.5)#45 | 37.3%(+14.8)#4,235 |
| 46. | Aurora | 51.9% | 37.6%(+14.3)#46 | 37.3%(+14.6)#4,277 |
| 47. | Turner | 51.6% | 37.6%(+14.0)#47 | 37.3%(+14.3)#4,340 |
| 48. | Neskowin | 51.1% | 37.6%(+13.5)#48 | 37.3%(+13.8)#4,465 |
| 49. | Tigard | 50.7% | 37.6%(+13.1)#49 | 37.3%(+13.4)#4,534 |
| 50. | Jasper | 50.6% | 37.6%(+13.0)#50 | 37.3%(+13.3)#4,575 |
| 51. | Oatfield | 50.3% | 37.6%(+12.7)#51 | 37.3%(+13.0)#4,615 |
| 52. | Gearhart | 50.3% | 37.6%(+12.7)#52 | 37.3%(+13.0)#4,621 |
| 53. | Jacksonville | 50.2% | 37.6%(+12.6)#53 | 37.3%(+12.9)#4,641 |
| 54. | Lonerock | 50.0% | 37.6%(+12.4)#54 | 37.3%(+12.7)#4,756 |
| 55. | Hillsboro | 49.3% | 37.6%(+11.7)#55 | 37.3%(+12.0)#4,919 |
| 56. | Melrose | 49.3% | 37.6%(+11.7)#56 | 37.3%(+12.0)#4,938 |
| 57. | Durham | 49.2% | 37.6%(+11.6)#57 | 37.3%(+11.9)#4,953 |
| 58. | Marlene | 49.1% | 37.6%(+11.5)#58 | 37.3%(+11.8)#4,978 |
| 59. | Gaston | 48.9% | 37.6%(+11.3)#59 | 37.3%(+11.6)#5,035 |
| 60. | Beaver Marsh | 48.8% | 37.6%(+11.2)#60 | 37.3%(+11.5)#5,066 |
| 61. | Scappoose | 48.7% | 37.6%(+11.1)#61 | 37.3%(+11.4)#5,076 |
| 62. | Mulino | 48.6% | 37.6%(+11.0)#62 | 37.3%(+11.3)#5,106 |
| 63. | Dundee | 48.4% | 37.6%(+10.8)#63 | 37.3%(+11.1)#5,151 |
| 64. | Garden Home Whitford | 48.3% | 37.6%(+10.7)#64 | 37.3%(+11.0)#5,175 |
| 65. | Halsey | 48.3% | 37.6%(+10.7)#65 | 37.3%(+11.0)#5,182 |
| 66. | Rockcreek | 48.2% | 37.6%(+10.6)#66 | 37.3%(+10.9)#5,195 |
| 67. | Silver Lake | 48.2% | 37.6%(+10.6)#67 | 37.3%(+10.9)#5,208 |
| 68. | Metzger | 47.7% | 37.6%(+10.1)#68 | 37.3%(+10.4)#5,329 |
| 69. | Sandy | 47.5% | 37.6%(+9.90)#69 | 37.3%(+10.2)#5,384 |
| 70. | West Slope | 47.0% | 37.6%(+9.40)#70 | 37.3%(+9.70)#5,536 |
| 71. | Lyons | 47.0% | 37.6%(+9.40)#71 | 37.3%(+9.70)#5,548 |
| 72. | Columbia City | 46.9% | 37.6%(+9.30)#72 | 37.3%(+9.60)#5,575 |
| 73. | Imbler | 46.9% | 37.6%(+9.30)#73 | 37.3%(+9.60)#5,585 |
| 74. | Pleasant Valley | 46.4% | 37.6%(+8.80)#74 | 37.3%(+9.10)#5,721 |
| 75. | Sunriver | 46.1% | 37.6%(+8.50)#75 | 37.3%(+8.80)#5,813 |
| 76. | Eagle Crest | 45.7% | 37.6%(+8.10)#76 | 37.3%(+8.40)#5,911 |
| 77. | Carlton | 45.5% | 37.6%(+7.90)#77 | 37.3%(+8.20)#5,977 |
| 78. | Bonanza | 45.4% | 37.6%(+7.80)#78 | 37.3%(+8.10)#6,017 |
| 79. | Warren | 45.1% | 37.6%(+7.50)#79 | 37.3%(+7.80)#6,086 |
| 80. | Wilsonville | 44.9% | 37.6%(+7.30)#80 | 37.3%(+7.60)#6,139 |
| 81. | Canby | 44.4% | 37.6%(+6.80)#81 | 37.3%(+7.10)#6,285 |
| 82. | Gladstone | 44.4% | 37.6%(+6.80)#82 | 37.3%(+7.10)#6,286 |
| 83. | Aumsville | 44.4% | 37.6%(+6.80)#83 | 37.3%(+7.10)#6,295 |
| 84. | Oregon City | 44.2% | 37.6%(+6.60)#84 | 37.3%(+6.90)#6,343 |
| 85. | Riverside | 44.2% | 37.6%(+6.60)#85 | 37.3%(+6.90)#6,363 |
| 86. | Beaverton | 44.1% | 37.6%(+6.50)#86 | 37.3%(+6.80)#6,365 |
| 87. | Aloha | 44.1% | 37.6%(+6.50)#87 | 37.3%(+6.80)#6,367 |
| 88. | Portland | 43.5% | 37.6%(+5.90)#88 | 37.3%(+6.20)#6,555 |
| 89. | Banks | 43.5% | 37.6%(+5.90)#89 | 37.3%(+6.20)#6,569 |
| 90. | Lafayette | 43.0% | 37.6%(+5.40)#90 | 37.3%(+5.70)#6,721 |
| 91. | Newberg | 42.8% | 37.6%(+5.20)#91 | 37.3%(+5.50)#6,779 |
| 92. | Amity | 42.5% | 37.6%(+4.90)#92 | 37.3%(+5.20)#6,886 |
| 93. | Camp Sherman | 42.5% | 37.6%(+4.90)#93 | 37.3%(+5.20)#6,895 |
| 94. | Marion | 42.3% | 37.6%(+4.70)#94 | 37.3%(+5.00)#6,969 |
| 95. | Gilchrist | 42.1% | 37.6%(+4.50)#95 | 37.3%(+4.80)#7,032 |
| 96. | Troutdale | 41.5% | 37.6%(+3.90)#96 | 37.3%(+4.20)#7,183 |
| 97. | Cherry Grove | 41.5% | 37.6%(+3.90)#97 | 37.3%(+4.20)#7,212 |
| 98. | Adair Village | 41.3% | 37.6%(+3.70)#98 | 37.3%(+4.00)#7,273 |
| 99. | Bend | 41.1% | 37.6%(+3.50)#99 | 37.3%(+3.80)#7,329 |
| 100. | Gopher Flats | 41.0% | 37.6%(+3.40)#100 | 37.3%(+3.70)#7,377 |
Common Questions
What are the Top 10 Cities with the Highest Percentage of Households with Income Above $100,000 in Oregon?
Top 10 Cities with the Highest Percentage of Households with Income Above $100,000 in Oregon are:
#1
100.0%
#2
100.0%
#3
100.0%
#4
89.2%
#5
88.3%
#6
83.3%
#7
77.9%
#8
75.2%
#9
75.0%
#10
74.9%
What city has the Highest Percentage of Households with Income Above $100,000 in Oregon?
Kings Valley has the Highest Percentage of Households with Income Above $100,000 in Oregon with 100.0%.
What is the Percentage of Households with Income Above $100,000 in the State of Oregon?
Percentage of Households with Income Above $100,000 in Oregon is 37.6%.
What is the Percentage of Households with Income Above $100,000 in the United States?
Percentage of Households with Income Above $100,000 in the United States is 37.3%.