Cities with the Highest Percentage of Households with Income Above $100,000 in New York
RELATED REPORTS & OPTIONS
Household Income | $100k+
New York
Compare Cities
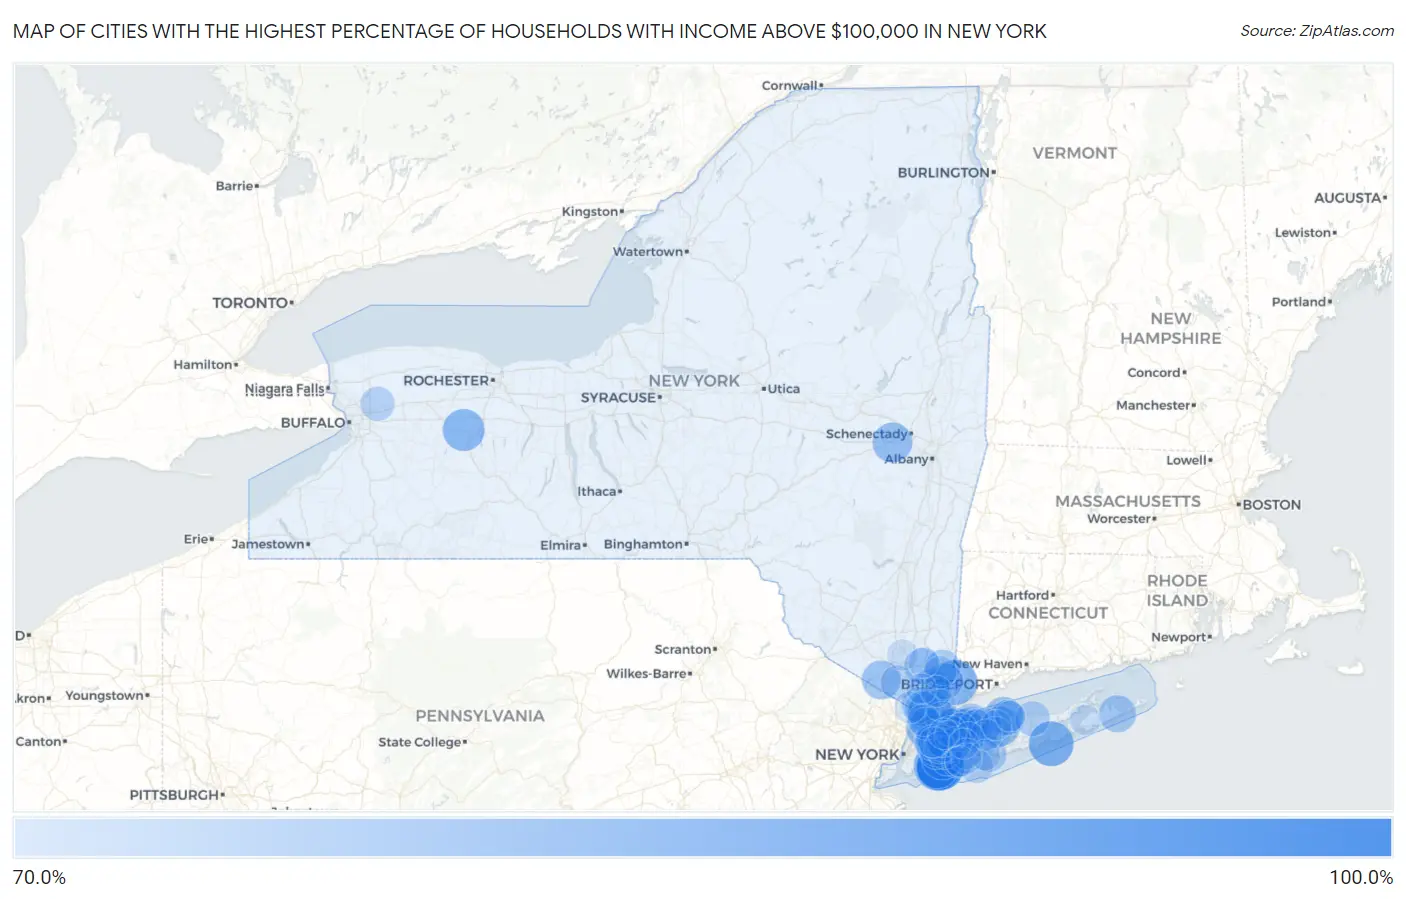
Map of Cities with the Highest Percentage of Households with Income Above $100,000 in New York
0.0%
100.0%
Cities with the Highest Percentage of Households with Income Above $100,000 in New York
| City | Households with Income > $100k | vs State | vs National | |
| 1. | Bard College | 100.0% | 41.7%(+58.3)#1 | 37.3%(+62.7)#5 |
| 2. | Hewlett Bay Park | 95.2% | 41.7%(+53.5)#2 | 37.3%(+57.9)#205 |
| 3. | Hewlett Harbor | 93.6% | 41.7%(+51.9)#3 | 37.3%(+56.3)#213 |
| 4. | Haines Falls | 91.4% | 41.7%(+49.7)#4 | 37.3%(+54.1)#232 |
| 5. | Laurel Hollow | 91.0% | 41.7%(+49.3)#5 | 37.3%(+53.7)#237 |
| 6. | Hewlett Neck | 90.6% | 41.7%(+48.9)#6 | 37.3%(+53.3)#244 |
| 7. | Scotts Corners | 89.9% | 41.7%(+48.2)#7 | 37.3%(+52.6)#257 |
| 8. | West Hampton Dunes | 89.7% | 41.7%(+48.0)#8 | 37.3%(+52.4)#260 |
| 9. | Plandome Heights | 89.6% | 41.7%(+47.9)#9 | 37.3%(+52.3)#263 |
| 10. | Scarsdale | 88.8% | 41.7%(+47.1)#10 | 37.3%(+51.5)#276 |
| 11. | Brookville | 88.0% | 41.7%(+46.3)#11 | 37.3%(+50.7)#287 |
| 12. | East Hills | 87.7% | 41.7%(+46.0)#12 | 37.3%(+50.4)#293 |
| 13. | Munsey Park | 87.1% | 41.7%(+45.4)#13 | 37.3%(+49.8)#301 |
| 14. | Retsof | 86.5% | 41.7%(+44.8)#14 | 37.3%(+49.2)#314 |
| 15. | North Hills | 86.4% | 41.7%(+44.7)#15 | 37.3%(+49.1)#316 |
| 16. | Woodsburgh | 86.4% | 41.7%(+44.7)#16 | 37.3%(+49.1)#317 |
| 17. | Malverne Park Oaks | 86.3% | 41.7%(+44.6)#17 | 37.3%(+49.0)#318 |
| 18. | Upper Brookville | 85.9% | 41.7%(+44.2)#18 | 37.3%(+48.6)#324 |
| 19. | Lake Success | 84.9% | 41.7%(+43.2)#19 | 37.3%(+47.6)#346 |
| 20. | Pelham Manor | 84.7% | 41.7%(+43.0)#20 | 37.3%(+47.4)#349 |
| 21. | Sands Point | 84.5% | 41.7%(+42.8)#21 | 37.3%(+47.2)#358 |
| 22. | Head Of The Harbor | 84.5% | 41.7%(+42.8)#22 | 37.3%(+47.2)#359 |
| 23. | Duane Lake | 84.3% | 41.7%(+42.6)#23 | 37.3%(+47.0)#361 |
| 24. | Old Westbury | 84.1% | 41.7%(+42.4)#24 | 37.3%(+46.8)#368 |
| 25. | Shorehaven | 83.5% | 41.7%(+41.8)#25 | 37.3%(+46.2)#390 |
| 26. | Mill Neck | 83.2% | 41.7%(+41.5)#26 | 37.3%(+45.9)#407 |
| 27. | Old Field | 83.0% | 41.7%(+41.3)#27 | 37.3%(+45.7)#417 |
| 28. | Tuxedo Park | 82.8% | 41.7%(+41.1)#28 | 37.3%(+45.5)#429 |
| 29. | Cold Spring Harbor | 82.7% | 41.7%(+41.0)#29 | 37.3%(+45.4)#434 |
| 30. | Upper Red Hook | 82.6% | 41.7%(+40.9)#30 | 37.3%(+45.3)#440 |
| 31. | Oyster Bay Cove | 81.6% | 41.7%(+39.9)#31 | 37.3%(+44.3)#473 |
| 32. | Saddle Rock Estates | 81.4% | 41.7%(+39.7)#32 | 37.3%(+44.1)#484 |
| 33. | Chappaqua | 81.3% | 41.7%(+39.6)#33 | 37.3%(+44.0)#487 |
| 34. | Amagansett | 81.3% | 41.7%(+39.6)#34 | 37.3%(+44.0)#489 |
| 35. | Setauket | 80.7% | 41.7%(+39.0)#35 | 37.3%(+43.4)#514 |
| 36. | Huntington Bay | 80.4% | 41.7%(+38.7)#36 | 37.3%(+43.1)#528 |
| 37. | Irvington | 80.2% | 41.7%(+38.5)#37 | 37.3%(+42.9)#536 |
| 38. | Brewster Heights | 80.2% | 41.7%(+38.5)#38 | 37.3%(+42.9)#538 |
| 39. | Bedford | 80.1% | 41.7%(+38.4)#39 | 37.3%(+42.8)#541 |
| 40. | Roslyn Heights | 80.0% | 41.7%(+38.3)#40 | 37.3%(+42.7)#550 |
| 41. | Plandome Manor | 80.0% | 41.7%(+38.3)#41 | 37.3%(+42.7)#553 |
| 42. | Crompond | 79.9% | 41.7%(+38.2)#42 | 37.3%(+42.6)#558 |
| 43. | Harbor Hills | 79.9% | 41.7%(+38.2)#43 | 37.3%(+42.6)#560 |
| 44. | Brightwaters | 79.7% | 41.7%(+38.0)#44 | 37.3%(+42.4)#566 |
| 45. | East Norwich | 79.5% | 41.7%(+37.8)#45 | 37.3%(+42.2)#579 |
| 46. | Lattingtown | 79.5% | 41.7%(+37.8)#46 | 37.3%(+42.2)#582 |
| 47. | Golden S Bridge | 79.4% | 41.7%(+37.7)#47 | 37.3%(+42.1)#588 |
| 48. | Plandome | 79.4% | 41.7%(+37.7)#48 | 37.3%(+42.1)#589 |
| 49. | Eatons Neck | 79.3% | 41.7%(+37.6)#49 | 37.3%(+42.0)#595 |
| 50. | Poquott | 79.0% | 41.7%(+37.3)#50 | 37.3%(+41.7)#613 |
| 51. | Ardsley | 78.8% | 41.7%(+37.1)#51 | 37.3%(+41.5)#626 |
| 52. | Kings Point | 78.7% | 41.7%(+37.0)#52 | 37.3%(+41.4)#634 |
| 53. | East Shoreham | 78.5% | 41.7%(+36.8)#53 | 37.3%(+41.2)#643 |
| 54. | Vassar College | 78.3% | 41.7%(+36.6)#54 | 37.3%(+41.0)#655 |
| 55. | Roslyn Harbor | 78.2% | 41.7%(+36.5)#55 | 37.3%(+40.9)#666 |
| 56. | Flower Hill | 78.1% | 41.7%(+36.4)#56 | 37.3%(+40.8)#673 |
| 57. | Dix Hills | 77.8% | 41.7%(+36.1)#57 | 37.3%(+40.5)#696 |
| 58. | Pomona | 77.8% | 41.7%(+36.1)#58 | 37.3%(+40.5)#699 |
| 59. | Clarence Center | 77.8% | 41.7%(+36.1)#59 | 37.3%(+40.5)#700 |
| 60. | Rye | 77.7% | 41.7%(+36.0)#60 | 37.3%(+40.4)#707 |
| 61. | Centerport | 77.5% | 41.7%(+35.8)#61 | 37.3%(+40.2)#722 |
| 62. | East Williston | 77.5% | 41.7%(+35.8)#62 | 37.3%(+40.2)#724 |
| 63. | Gilgo | 77.5% | 41.7%(+35.8)#63 | 37.3%(+40.2)#729 |
| 64. | Fort Salonga | 77.2% | 41.7%(+35.5)#64 | 37.3%(+39.9)#745 |
| 65. | South Hempstead | 77.1% | 41.7%(+35.4)#65 | 37.3%(+39.8)#757 |
| 66. | Searingtown | 76.9% | 41.7%(+35.2)#66 | 37.3%(+39.6)#772 |
| 67. | Garden City | 76.5% | 41.7%(+34.8)#67 | 37.3%(+39.2)#789 |
| 68. | Katonah | 76.3% | 41.7%(+34.6)#68 | 37.3%(+39.0)#800 |
| 69. | Bellerose | 76.1% | 41.7%(+34.4)#69 | 37.3%(+38.8)#810 |
| 70. | Saddle Rock | 75.8% | 41.7%(+34.1)#70 | 37.3%(+38.5)#834 |
| 71. | Seaford | 75.5% | 41.7%(+33.8)#71 | 37.3%(+38.2)#850 |
| 72. | Pelham | 75.4% | 41.7%(+33.7)#72 | 37.3%(+38.1)#861 |
| 73. | Bronxville | 75.3% | 41.7%(+33.6)#73 | 37.3%(+38.0)#869 |
| 74. | Cove Neck | 75.3% | 41.7%(+33.6)#74 | 37.3%(+38.0)#873 |
| 75. | Rye Brook | 75.2% | 41.7%(+33.5)#75 | 37.3%(+37.9)#875 |
| 76. | Tappan | 75.1% | 41.7%(+33.4)#76 | 37.3%(+37.8)#882 |
| 77. | Roslyn Estates | 75.1% | 41.7%(+33.4)#77 | 37.3%(+37.8)#884 |
| 78. | Jericho | 75.0% | 41.7%(+33.3)#78 | 37.3%(+37.7)#888 |
| 79. | Manhasset Hills | 75.0% | 41.7%(+33.3)#79 | 37.3%(+37.7)#891 |
| 80. | Village Of The Branch | 74.9% | 41.7%(+33.2)#80 | 37.3%(+37.6)#915 |
| 81. | Armonk | 74.7% | 41.7%(+33.0)#81 | 37.3%(+37.4)#922 |
| 82. | Commack | 74.6% | 41.7%(+32.9)#82 | 37.3%(+37.3)#925 |
| 83. | Crest View Heights | 74.5% | 41.7%(+32.8)#83 | 37.3%(+37.2)#941 |
| 84. | Old Brookville | 74.5% | 41.7%(+32.8)#84 | 37.3%(+37.2)#942 |
| 85. | West Point | 74.4% | 41.7%(+32.7)#85 | 37.3%(+37.1)#945 |
| 86. | West Hills | 74.2% | 41.7%(+32.5)#86 | 37.3%(+36.9)#962 |
| 87. | West Islip | 74.1% | 41.7%(+32.4)#87 | 37.3%(+36.8)#966 |
| 88. | Matinecock | 74.1% | 41.7%(+32.4)#88 | 37.3%(+36.8)#971 |
| 89. | Great Neck Estates | 74.0% | 41.7%(+32.3)#89 | 37.3%(+36.7)#978 |
| 90. | South Farmingdale | 73.9% | 41.7%(+32.2)#90 | 37.3%(+36.6)#983 |
| 91. | North Sea | 73.9% | 41.7%(+32.2)#91 | 37.3%(+36.6)#986 |
| 92. | Sea Cliff | 73.9% | 41.7%(+32.2)#92 | 37.3%(+36.6)#987 |
| 93. | Shrub Oak | 73.9% | 41.7%(+32.2)#93 | 37.3%(+36.6)#988 |
| 94. | Massapequa Park | 73.6% | 41.7%(+31.9)#94 | 37.3%(+36.3)#1,015 |
| 95. | Bellmore | 73.6% | 41.7%(+31.9)#95 | 37.3%(+36.3)#1,016 |
| 96. | Briarcliff Manor | 73.6% | 41.7%(+31.9)#96 | 37.3%(+36.3)#1,017 |
| 97. | Plainview | 73.5% | 41.7%(+31.8)#97 | 37.3%(+36.2)#1,021 |
| 98. | Nissequogue | 73.5% | 41.7%(+31.8)#98 | 37.3%(+36.2)#1,028 |
| 99. | Belle Terre | 73.5% | 41.7%(+31.8)#99 | 37.3%(+36.2)#1,029 |
| 100. | Wantagh | 73.4% | 41.7%(+31.7)#100 | 37.3%(+36.1)#1,033 |
Common Questions
What are the Top 10 Cities with the Highest Percentage of Households with Income Above $100,000 in New York?
Top 10 Cities with the Highest Percentage of Households with Income Above $100,000 in New York are:
#1
95.2%
#2
93.6%
#3
91.0%
#4
90.6%
#5
89.9%
#6
89.7%
#7
89.6%
#8
88.8%
#9
88.0%
#10
87.7%
What city has the Highest Percentage of Households with Income Above $100,000 in New York?
Hewlett Bay Park has the Highest Percentage of Households with Income Above $100,000 in New York with 95.2%.
What is the Percentage of Households with Income Above $100,000 in the State of New York?
Percentage of Households with Income Above $100,000 in New York is 41.7%.
What is the Percentage of Households with Income Above $100,000 in the United States?
Percentage of Households with Income Above $100,000 in the United States is 37.3%.