Cities with the Highest Percentage of Households with Income Above $100,000 in North Dakota
RELATED REPORTS & OPTIONS
Household Income | $100k+
North Dakota
Compare Cities
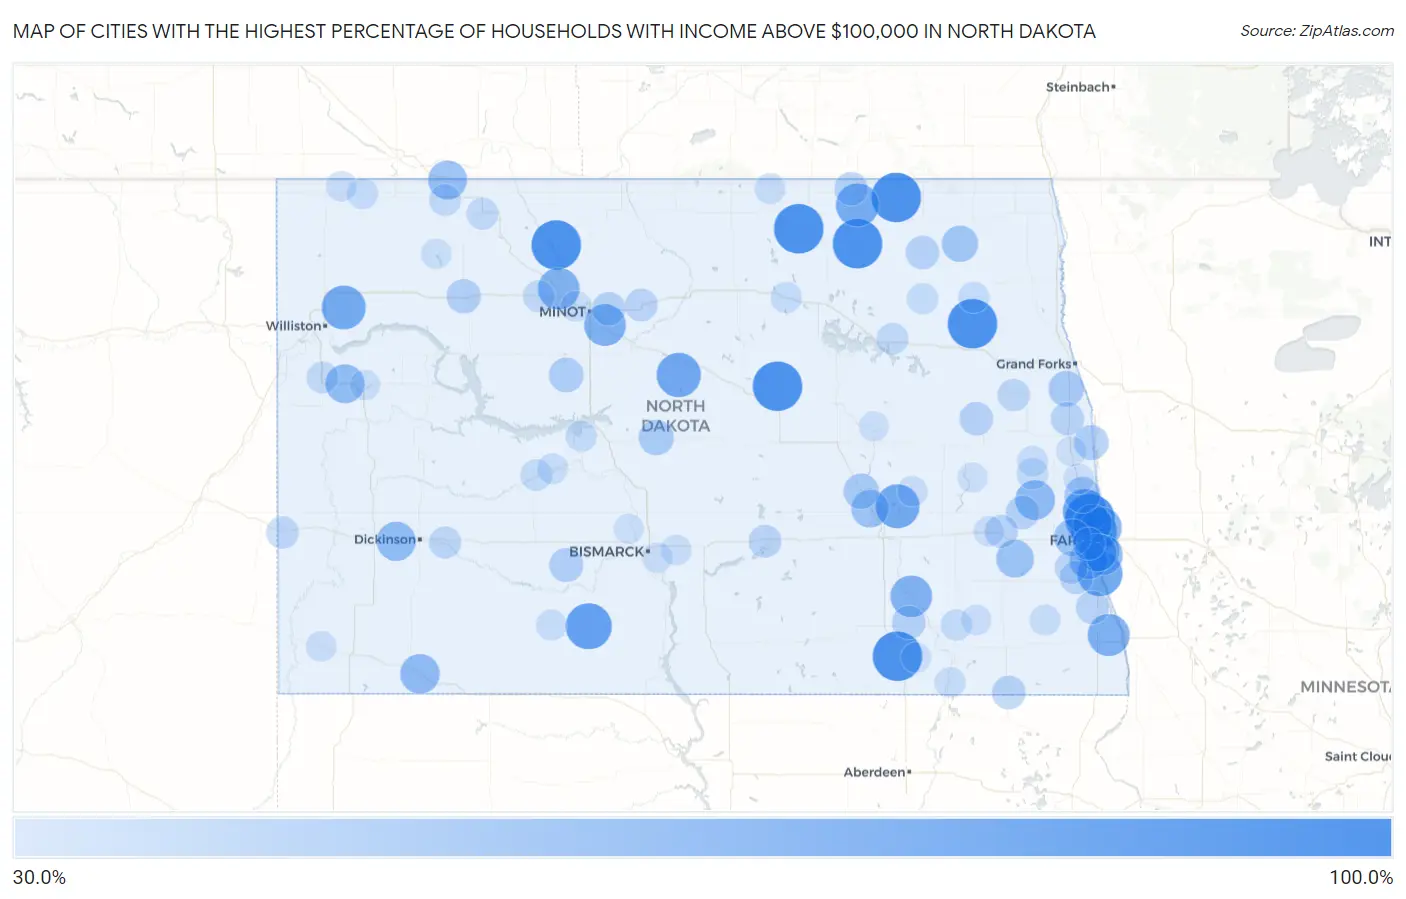
Map of Cities with the Highest Percentage of Households with Income Above $100,000 in North Dakota
0.0%
100.0%
Cities with the Highest Percentage of Households with Income Above $100,000 in North Dakota
| City | Households with Income > $100k | vs State | vs National | |
| 1. | Brooktree Park | 100.0% | 35.6%(+64.4)#1 | 37.3%(+62.7)#33 |
| 2. | Mcgregor | 100.0% | 35.6%(+64.4)#2 | 37.3%(+62.7)#55 |
| 3. | Heimdal | 100.0% | 35.6%(+64.4)#3 | 37.3%(+62.7)#126 |
| 4. | Dahlen | 100.0% | 35.6%(+64.4)#4 | 37.3%(+62.7)#142 |
| 5. | Monango | 100.0% | 35.6%(+64.4)#5 | 37.3%(+62.7)#164 |
| 6. | Perth | 100.0% | 35.6%(+64.4)#6 | 37.3%(+62.7)#166 |
| 7. | Wales | 100.0% | 35.6%(+64.4)#7 | 37.3%(+62.7)#185 |
| 8. | Calio | 100.0% | 35.6%(+64.4)#8 | 37.3%(+62.7)#188 |
| 9. | Grano | 100.0% | 35.6%(+64.4)#9 | 37.3%(+62.7)#198 |
| 10. | Raleigh | 88.9% | 35.6%(+53.3)#10 | 37.3%(+51.6)#275 |
| 11. | Reile S Acres | 88.8% | 35.6%(+53.2)#11 | 37.3%(+51.5)#277 |
| 12. | Oxbow | 85.4% | 35.6%(+49.8)#12 | 37.3%(+48.1)#337 |
| 13. | Argusville | 83.4% | 35.6%(+47.8)#13 | 37.3%(+46.1)#394 |
| 14. | Kief | 83.3% | 35.6%(+47.7)#14 | 37.3%(+46.0)#403 |
| 15. | Spiritwood Lake | 82.4% | 35.6%(+46.8)#15 | 37.3%(+45.1)#449 |
| 16. | Springbrook | 81.9% | 35.6%(+46.3)#16 | 37.3%(+44.6)#464 |
| 17. | Prairie Rose | 80.1% | 35.6%(+44.5)#17 | 37.3%(+42.8)#547 |
| 18. | Calvin | 80.0% | 35.6%(+44.4)#18 | 37.3%(+42.7)#556 |
| 19. | Dwight | 76.4% | 35.6%(+40.8)#19 | 37.3%(+39.1)#797 |
| 20. | Logan | 75.7% | 35.6%(+40.1)#20 | 37.3%(+38.4)#838 |
| 21. | Dickey | 75.0% | 35.6%(+39.4)#21 | 37.3%(+37.7)#904 |
| 22. | Foxholm | 75.0% | 35.6%(+39.4)#22 | 37.3%(+37.7)#907 |
| 23. | North River | 72.8% | 35.6%(+37.2)#23 | 37.3%(+35.5)#1,087 |
| 24. | Briarwood | 71.3% | 35.6%(+35.7)#24 | 37.3%(+34.0)#1,227 |
| 25. | Erie | 68.8% | 35.6%(+33.2)#25 | 37.3%(+31.5)#1,469 |
| 26. | Bucyrus | 68.4% | 35.6%(+32.8)#26 | 37.3%(+31.1)#1,530 |
| 27. | South Heart | 67.3% | 35.6%(+31.7)#27 | 37.3%(+30.0)#1,651 |
| 28. | Arnegard | 66.7% | 35.6%(+31.1)#28 | 37.3%(+29.4)#1,719 |
| 29. | Harwood | 66.5% | 35.6%(+30.9)#29 | 37.3%(+29.2)#1,759 |
| 30. | Portal | 66.3% | 35.6%(+30.7)#30 | 37.3%(+29.0)#1,786 |
| 31. | Horace | 65.0% | 35.6%(+29.4)#31 | 37.3%(+27.7)#1,936 |
| 32. | Frontier | 63.8% | 35.6%(+28.2)#32 | 37.3%(+26.5)#2,096 |
| 33. | Alice | 62.5% | 35.6%(+26.9)#33 | 37.3%(+25.2)#2,301 |
| 34. | Buchanan | 62.1% | 35.6%(+26.5)#34 | 37.3%(+24.8)#2,373 |
| 35. | Mapleton | 60.5% | 35.6%(+24.9)#35 | 37.3%(+23.2)#2,656 |
| 36. | Milton | 58.8% | 35.6%(+23.2)#36 | 37.3%(+21.5)#2,953 |
| 37. | Gardner | 57.7% | 35.6%(+22.1)#37 | 37.3%(+20.4)#3,125 |
| 38. | Pingree | 56.0% | 35.6%(+20.4)#38 | 37.3%(+18.7)#3,425 |
| 39. | Thompson | 55.9% | 35.6%(+20.3)#39 | 37.3%(+18.6)#3,440 |
| 40. | Mercer | 55.3% | 35.6%(+19.7)#40 | 37.3%(+18.0)#3,560 |
| 41. | Caledonia | 53.8% | 35.6%(+18.2)#41 | 37.3%(+16.5)#3,861 |
| 42. | Douglas | 53.4% | 35.6%(+17.8)#42 | 37.3%(+16.1)#3,945 |
| 43. | Stanley | 52.3% | 35.6%(+16.7)#43 | 37.3%(+15.0)#4,178 |
| 44. | Almont | 51.7% | 35.6%(+16.1)#44 | 37.3%(+14.4)#4,324 |
| 45. | Trenton | 51.0% | 35.6%(+15.4)#45 | 37.3%(+13.7)#4,483 |
| 46. | Surrey | 50.1% | 35.6%(+14.5)#46 | 37.3%(+12.8)#4,673 |
| 47. | Berlin | 50.1% | 35.6%(+14.5)#47 | 37.3%(+12.8)#4,682 |
| 48. | Sharon | 50.0% | 35.6%(+14.4)#48 | 37.3%(+12.7)#4,734 |
| 49. | Long Creek | 50.0% | 35.6%(+14.4)#49 | 37.3%(+12.7)#4,738 |
| 50. | Nekoma | 50.0% | 35.6%(+14.4)#51 | 37.3%(+12.7)#4,759 |
| 51. | Sarles | 50.0% | 35.6%(+14.4)#52 | 37.3%(+12.7)#4,760 |
| 52. | Ayr | 50.0% | 35.6%(+14.4)#53 | 37.3%(+12.7)#4,761 |
| 53. | Havana | 49.9% | 35.6%(+14.3)#54 | 37.3%(+12.6)#4,791 |
| 54. | Kindred | 48.9% | 35.6%(+13.3)#55 | 37.3%(+11.6)#5,033 |
| 55. | Tower City | 48.8% | 35.6%(+13.2)#56 | 37.3%(+11.5)#5,062 |
| 56. | Buxton | 48.7% | 35.6%(+13.1)#57 | 37.3%(+11.4)#5,085 |
| 57. | Colfax | 48.7% | 35.6%(+13.1)#58 | 37.3%(+11.4)#5,087 |
| 58. | Apple Valley | 47.9% | 35.6%(+12.3)#59 | 37.3%(+10.6)#5,286 |
| 59. | Granville | 47.7% | 35.6%(+12.1)#60 | 37.3%(+10.4)#5,342 |
| 60. | Dawson | 47.6% | 35.6%(+12.0)#61 | 37.3%(+10.3)#5,377 |
| 61. | Davenport | 47.4% | 35.6%(+11.8)#62 | 37.3%(+10.1)#5,434 |
| 62. | West Fargo | 47.0% | 35.6%(+11.4)#63 | 37.3%(+9.70)#5,532 |
| 63. | Northwood | 46.4% | 35.6%(+10.8)#64 | 37.3%(+9.10)#5,717 |
| 64. | Beach | 46.3% | 35.6%(+10.7)#65 | 37.3%(+9.00)#5,749 |
| 65. | Gladstone | 45.9% | 35.6%(+10.3)#66 | 37.3%(+8.60)#5,871 |
| 66. | Bowbells | 45.3% | 35.6%(+9.70)#67 | 37.3%(+8.00)#6,043 |
| 67. | Alexander | 45.1% | 35.6%(+9.50)#68 | 37.3%(+7.80)#6,100 |
| 68. | Berthold | 44.9% | 35.6%(+9.30)#69 | 37.3%(+7.60)#6,162 |
| 69. | Lignite | 44.9% | 35.6%(+9.30)#70 | 37.3%(+7.60)#6,166 |
| 70. | Crary | 44.8% | 35.6%(+9.20)#71 | 37.3%(+7.50)#6,192 |
| 71. | Beulah | 44.1% | 35.6%(+8.50)#72 | 37.3%(+6.80)#6,377 |
| 72. | Galesburg | 44.1% | 35.6%(+8.50)#73 | 37.3%(+6.80)#6,395 |
| 73. | Verona | 43.2% | 35.6%(+7.60)#74 | 37.3%(+5.90)#6,677 |
| 74. | Lawton | 42.9% | 35.6%(+7.30)#75 | 37.3%(+5.60)#6,774 |
| 75. | York | 42.9% | 35.6%(+7.30)#76 | 37.3%(+5.60)#6,775 |
| 76. | Crosby | 42.8% | 35.6%(+7.20)#77 | 37.3%(+5.50)#6,795 |
| 77. | Riverdale | 42.8% | 35.6%(+7.20)#78 | 37.3%(+5.50)#6,804 |
| 78. | Lankin | 42.5% | 35.6%(+6.90)#79 | 37.3%(+5.20)#6,901 |
| 79. | Mcleod | 42.3% | 35.6%(+6.70)#80 | 37.3%(+5.00)#6,975 |
| 80. | Burlington | 42.1% | 35.6%(+6.50)#81 | 37.3%(+4.80)#7,021 |
| 81. | Hazen | 41.7% | 35.6%(+6.10)#82 | 37.3%(+4.40)#7,126 |
| 82. | St John | 41.7% | 35.6%(+6.10)#83 | 37.3%(+4.40)#7,144 |
| 83. | Ludden | 41.7% | 35.6%(+6.10)#84 | 37.3%(+4.40)#7,151 |
| 84. | Clifford | 41.6% | 35.6%(+6.00)#85 | 37.3%(+4.30)#7,179 |
| 85. | Leith | 41.6% | 35.6%(+6.00)#86 | 37.3%(+4.30)#7,180 |
| 86. | Oriska | 41.3% | 35.6%(+5.70)#87 | 37.3%(+4.00)#7,285 |
| 87. | Rhame | 41.3% | 35.6%(+5.70)#88 | 37.3%(+4.00)#7,286 |
| 88. | Wimbledon | 41.3% | 35.6%(+5.70)#89 | 37.3%(+4.00)#7,287 |
| 89. | Menoken | 41.3% | 35.6%(+5.70)#90 | 37.3%(+4.00)#7,292 |
| 90. | Grandin | 41.2% | 35.6%(+5.60)#91 | 37.3%(+3.90)#7,324 |
| 91. | Englevale | 41.2% | 35.6%(+5.60)#92 | 37.3%(+3.90)#7,327 |
| 92. | Ambrose | 41.2% | 35.6%(+5.60)#93 | 37.3%(+3.90)#7,328 |
| 93. | Watford City | 41.0% | 35.6%(+5.40)#94 | 37.3%(+3.70)#7,363 |
| 94. | Powers Lake | 40.7% | 35.6%(+5.10)#95 | 37.3%(+3.40)#7,474 |
| 95. | Lincoln | 40.6% | 35.6%(+5.00)#96 | 37.3%(+3.30)#7,501 |
| 96. | Hillsboro | 40.5% | 35.6%(+4.90)#97 | 37.3%(+3.20)#7,542 |
| 97. | Fullerton | 40.5% | 35.6%(+4.90)#98 | 37.3%(+3.20)#7,560 |
| 98. | Harmon | 40.0% | 35.6%(+4.40)#99 | 37.3%(+2.70)#7,725 |
| 99. | Grace City | 40.0% | 35.6%(+4.40)#100 | 37.3%(+2.70)#7,746 |
| 100. | Luverne | 40.0% | 35.6%(+4.40)#101 | 37.3%(+2.70)#7,748 |
Common Questions
What are the Top 10 Cities with the Highest Percentage of Households with Income Above $100,000 in North Dakota?
Top 10 Cities with the Highest Percentage of Households with Income Above $100,000 in North Dakota are:
#1
100.0%
#2
100.0%
#3
100.0%
#4
100.0%
#5
100.0%
#6
100.0%
#7
100.0%
#8
100.0%
#9
88.9%
#10
88.8%
What city has the Highest Percentage of Households with Income Above $100,000 in North Dakota?
Brooktree Park has the Highest Percentage of Households with Income Above $100,000 in North Dakota with 100.0%.
What is the Percentage of Households with Income Above $100,000 in the State of North Dakota?
Percentage of Households with Income Above $100,000 in North Dakota is 35.6%.
What is the Percentage of Households with Income Above $100,000 in the United States?
Percentage of Households with Income Above $100,000 in the United States is 37.3%.