Cities with the Highest Percentage of Households with Income Above $100,000 in Ohio
RELATED REPORTS & OPTIONS
Household Income | $100k+
Ohio
Compare Cities
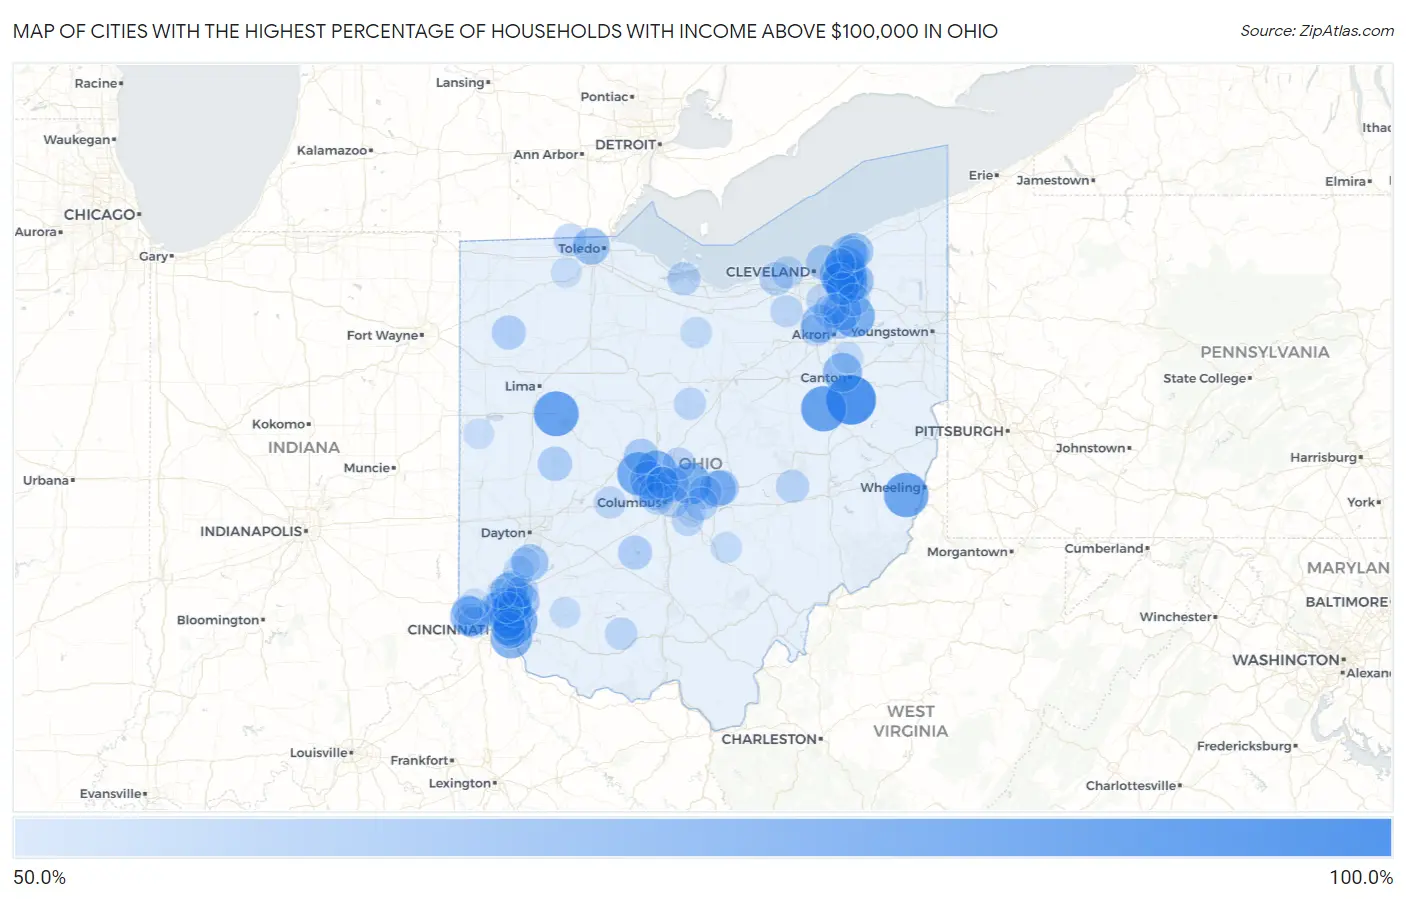
Map of Cities with the Highest Percentage of Households with Income Above $100,000 in Ohio
0.0%
100.0%
Cities with the Highest Percentage of Households with Income Above $100,000 in Ohio
| City | Households with Income > $100k | vs State | vs National | |
| 1. | Sandyville | 100.0% | 31.5%(+68.5)#1 | 37.3%(+62.7)#124 |
| 2. | Dundee | 90.0% | 31.5%(+58.5)#2 | 37.3%(+52.7)#254 |
| 3. | New Hampshire | 89.3% | 31.5%(+57.8)#3 | 37.3%(+52.0)#270 |
| 4. | Glencoe | 87.9% | 31.5%(+56.4)#4 | 37.3%(+50.6)#292 |
| 5. | New California | 84.6% | 31.5%(+53.1)#5 | 37.3%(+47.3)#355 |
| 6. | Terrace Park | 83.0% | 31.5%(+51.5)#6 | 37.3%(+45.7)#416 |
| 7. | New Albany | 82.8% | 31.5%(+51.3)#7 | 37.3%(+45.5)#424 |
| 8. | Sugar Bush Knolls | 82.6% | 31.5%(+51.1)#8 | 37.3%(+45.3)#438 |
| 9. | Bentleyville | 82.5% | 31.5%(+51.0)#9 | 37.3%(+45.2)#443 |
| 10. | Coldstream | 81.4% | 31.5%(+49.9)#10 | 37.3%(+44.1)#482 |
| 11. | Hunting Valley | 80.7% | 31.5%(+49.2)#11 | 37.3%(+43.4)#516 |
| 12. | Powell | 80.5% | 31.5%(+49.0)#12 | 37.3%(+43.2)#523 |
| 13. | Pepper Pike | 78.8% | 31.5%(+47.3)#13 | 37.3%(+41.5)#625 |
| 14. | Moreland Hills | 78.7% | 31.5%(+47.2)#14 | 37.3%(+41.4)#635 |
| 15. | Gates Mills | 78.3% | 31.5%(+46.8)#15 | 37.3%(+41.0)#656 |
| 16. | Concorde Hills | 78.3% | 31.5%(+46.8)#16 | 37.3%(+41.0)#657 |
| 17. | The Village Of Indian Hill | 77.6% | 31.5%(+46.1)#17 | 37.3%(+40.3)#715 |
| 18. | Grandview | 76.7% | 31.5%(+45.2)#18 | 37.3%(+39.4)#781 |
| 19. | Jacksontown | 76.5% | 31.5%(+45.0)#19 | 37.3%(+39.2)#792 |
| 20. | Hills And Dales | 75.5% | 31.5%(+44.0)#20 | 37.3%(+38.2)#855 |
| 21. | Evendale | 74.4% | 31.5%(+42.9)#21 | 37.3%(+37.1)#947 |
| 22. | Madeira | 73.7% | 31.5%(+42.2)#22 | 37.3%(+36.4)#1,008 |
| 23. | Hudson | 73.2% | 31.5%(+41.7)#23 | 37.3%(+35.9)#1,052 |
| 24. | Montrose Ghent | 73.1% | 31.5%(+41.6)#24 | 37.3%(+35.8)#1,058 |
| 25. | Dublin | 73.0% | 31.5%(+41.5)#25 | 37.3%(+35.7)#1,065 |
| 26. | Dry Run | 72.5% | 31.5%(+41.0)#26 | 37.3%(+35.2)#1,112 |
| 27. | South Russell | 71.9% | 31.5%(+40.4)#27 | 37.3%(+34.6)#1,171 |
| 28. | Montgomery | 71.8% | 31.5%(+40.3)#28 | 37.3%(+34.5)#1,176 |
| 29. | Ottawa Hills | 70.4% | 31.5%(+38.9)#29 | 37.3%(+33.1)#1,300 |
| 30. | Wetherington | 70.4% | 31.5%(+38.9)#30 | 37.3%(+33.1)#1,304 |
| 31. | Loveland Park | 70.0% | 31.5%(+38.5)#31 | 37.3%(+32.7)#1,333 |
| 32. | Five Points | 70.0% | 31.5%(+38.5)#32 | 37.3%(+32.7)#1,334 |
| 33. | Waite Hill | 69.6% | 31.5%(+38.1)#33 | 37.3%(+32.3)#1,371 |
| 34. | Kirtland Hills | 69.5% | 31.5%(+38.0)#34 | 37.3%(+32.2)#1,385 |
| 35. | Granville South | 69.3% | 31.5%(+37.8)#35 | 37.3%(+32.0)#1,410 |
| 36. | Riverlea | 69.1% | 31.5%(+37.6)#36 | 37.3%(+31.8)#1,434 |
| 37. | Amberley | 67.3% | 31.5%(+35.8)#37 | 37.3%(+30.0)#1,645 |
| 38. | Granville | 66.7% | 31.5%(+35.2)#38 | 37.3%(+29.4)#1,703 |
| 39. | Wyoming | 66.5% | 31.5%(+35.0)#39 | 37.3%(+29.2)#1,746 |
| 40. | Upper Arlington | 66.1% | 31.5%(+34.6)#40 | 37.3%(+28.8)#1,804 |
| 41. | Sharon Center | 66.0% | 31.5%(+34.5)#41 | 37.3%(+28.7)#1,818 |
| 42. | Ostrander | 66.0% | 31.5%(+34.5)#42 | 37.3%(+28.7)#1,819 |
| 43. | Bratenahl | 65.9% | 31.5%(+34.4)#43 | 37.3%(+28.6)#1,828 |
| 44. | Sherwood | 65.7% | 31.5%(+34.2)#44 | 37.3%(+28.4)#1,854 |
| 45. | Minerva Park | 65.1% | 31.5%(+33.6)#45 | 37.3%(+27.8)#1,924 |
| 46. | Remington | 65.1% | 31.5%(+33.6)#46 | 37.3%(+27.8)#1,928 |
| 47. | Rosewood | 64.6% | 31.5%(+33.1)#47 | 37.3%(+27.3)#1,986 |
| 48. | Bass Lake | 64.5% | 31.5%(+33.0)#48 | 37.3%(+27.2)#2,002 |
| 49. | Orange | 64.3% | 31.5%(+32.8)#49 | 37.3%(+27.0)#2,029 |
| 50. | Oakwood | 64.1% | 31.5%(+32.6)#50 | 37.3%(+26.8)#2,049 |
| 51. | Turpin Hills | 64.0% | 31.5%(+32.5)#51 | 37.3%(+26.7)#2,070 |
| 52. | Pancoastburg | 63.6% | 31.5%(+32.1)#52 | 37.3%(+26.3)#2,128 |
| 53. | Ridgewood | 63.3% | 31.5%(+31.8)#53 | 37.3%(+26.0)#2,163 |
| 54. | Beechwood Trails | 63.1% | 31.5%(+31.6)#54 | 37.3%(+25.8)#2,193 |
| 55. | Avon | 62.7% | 31.5%(+31.2)#55 | 37.3%(+25.4)#2,260 |
| 56. | Four Bridges | 62.4% | 31.5%(+30.9)#56 | 37.3%(+25.1)#2,317 |
| 57. | Sixteen Mile Stand | 62.3% | 31.5%(+30.8)#57 | 37.3%(+25.0)#2,331 |
| 58. | Peninsula | 62.1% | 31.5%(+30.6)#58 | 37.3%(+24.8)#2,369 |
| 59. | Crystal Rock | 62.0% | 31.5%(+30.5)#59 | 37.3%(+24.7)#2,395 |
| 60. | Adamsville | 61.9% | 31.5%(+30.4)#60 | 37.3%(+24.6)#2,410 |
| 61. | Etna | 61.7% | 31.5%(+30.2)#61 | 37.3%(+24.4)#2,443 |
| 62. | Miami Heights | 61.4% | 31.5%(+29.9)#62 | 37.3%(+24.1)#2,493 |
| 63. | Silver Lake | 61.3% | 31.5%(+29.8)#63 | 37.3%(+24.0)#2,514 |
| 64. | Berkey | 61.2% | 31.5%(+29.7)#64 | 37.3%(+23.9)#2,537 |
| 65. | Bexley | 61.1% | 31.5%(+29.6)#65 | 37.3%(+23.8)#2,543 |
| 66. | Solon | 61.0% | 31.5%(+29.5)#66 | 37.3%(+23.7)#2,561 |
| 67. | Galena | 60.6% | 31.5%(+29.1)#67 | 37.3%(+23.3)#2,631 |
| 68. | Aurora | 60.5% | 31.5%(+29.0)#68 | 37.3%(+23.2)#2,644 |
| 69. | Sinking Spring | 60.5% | 31.5%(+29.0)#69 | 37.3%(+23.2)#2,662 |
| 70. | Mariemont | 60.4% | 31.5%(+28.9)#70 | 37.3%(+23.1)#2,668 |
| 71. | Pigeon Creek | 60.2% | 31.5%(+28.7)#71 | 37.3%(+22.9)#2,706 |
| 72. | Bay Village | 60.0% | 31.5%(+28.5)#72 | 37.3%(+22.7)#2,726 |
| 73. | Mason | 59.9% | 31.5%(+28.4)#73 | 37.3%(+22.6)#2,749 |
| 74. | Candlewood Lake | 59.9% | 31.5%(+28.4)#74 | 37.3%(+22.6)#2,760 |
| 75. | Brecksville | 59.8% | 31.5%(+28.3)#75 | 37.3%(+22.5)#2,768 |
| 76. | Marble Cliff | 59.8% | 31.5%(+28.3)#76 | 37.3%(+22.5)#2,777 |
| 77. | Valley City | 59.7% | 31.5%(+28.2)#77 | 37.3%(+22.4)#2,796 |
| 78. | Choctaw Lake | 59.6% | 31.5%(+28.1)#78 | 37.3%(+22.3)#2,818 |
| 79. | Hilliard | 59.4% | 31.5%(+27.9)#79 | 37.3%(+22.1)#2,844 |
| 80. | Kirtland | 59.3% | 31.5%(+27.8)#80 | 37.3%(+22.0)#2,861 |
| 81. | Canal Winchester | 59.1% | 31.5%(+27.6)#81 | 37.3%(+21.8)#2,896 |
| 82. | Kings Mills | 59.1% | 31.5%(+27.6)#82 | 37.3%(+21.8)#2,906 |
| 83. | Worthington | 58.9% | 31.5%(+27.4)#83 | 37.3%(+21.6)#2,924 |
| 84. | Mack | 58.4% | 31.5%(+26.9)#84 | 37.3%(+21.1)#3,012 |
| 85. | Greentown | 58.1% | 31.5%(+26.6)#85 | 37.3%(+20.8)#3,058 |
| 86. | Holiday Lakes | 58.1% | 31.5%(+26.6)#86 | 37.3%(+20.8)#3,061 |
| 87. | Hunter | 57.7% | 31.5%(+26.2)#87 | 37.3%(+20.4)#3,118 |
| 88. | Hide A Way Hills | 57.5% | 31.5%(+26.0)#88 | 37.3%(+20.2)#3,160 |
| 89. | Blue Ash | 57.1% | 31.5%(+25.6)#89 | 37.3%(+19.8)#3,215 |
| 90. | St Martin | 56.9% | 31.5%(+25.4)#90 | 37.3%(+19.6)#3,262 |
| 91. | Neapolis | 56.3% | 31.5%(+24.8)#91 | 37.3%(+19.0)#3,373 |
| 92. | New Baltimore | 56.2% | 31.5%(+24.7)#92 | 37.3%(+18.9)#3,383 |
| 93. | Blue Jay | 56.1% | 31.5%(+24.6)#93 | 37.3%(+18.8)#3,405 |
| 94. | Highland Heights | 55.9% | 31.5%(+24.4)#94 | 37.3%(+18.6)#3,431 |
| 95. | Springboro | 55.8% | 31.5%(+24.3)#95 | 37.3%(+18.5)#3,452 |
| 96. | St Henry | 55.8% | 31.5%(+24.3)#96 | 37.3%(+18.5)#3,462 |
| 97. | Beckett Ridge | 55.2% | 31.5%(+23.7)#97 | 37.3%(+17.9)#3,565 |
| 98. | Boston Heights | 55.2% | 31.5%(+23.7)#98 | 37.3%(+17.9)#3,571 |
| 99. | Maria Stein | 55.2% | 31.5%(+23.7)#99 | 37.3%(+17.9)#3,573 |
| 100. | Pickerington | 54.9% | 31.5%(+23.4)#100 | 37.3%(+17.6)#3,620 |
Common Questions
What are the Top 10 Cities with the Highest Percentage of Households with Income Above $100,000 in Ohio?
Top 10 Cities with the Highest Percentage of Households with Income Above $100,000 in Ohio are:
#1
100.0%
#2
90.0%
#3
89.3%
#4
87.9%
#5
84.6%
#6
83.0%
#7
82.8%
#8
82.6%
#9
82.5%
#10
81.4%
What city has the Highest Percentage of Households with Income Above $100,000 in Ohio?
Sandyville has the Highest Percentage of Households with Income Above $100,000 in Ohio with 100.0%.
What is the Percentage of Households with Income Above $100,000 in the State of Ohio?
Percentage of Households with Income Above $100,000 in Ohio is 31.5%.
What is the Percentage of Households with Income Above $100,000 in the United States?
Percentage of Households with Income Above $100,000 in the United States is 37.3%.