Zip Codes with the Highest Percentage of Households with Income Above $100,000 in Lompoc, CA
RELATED REPORTS & OPTIONS
Household Income | $100k+
Lompoc
Compare Zip Codes
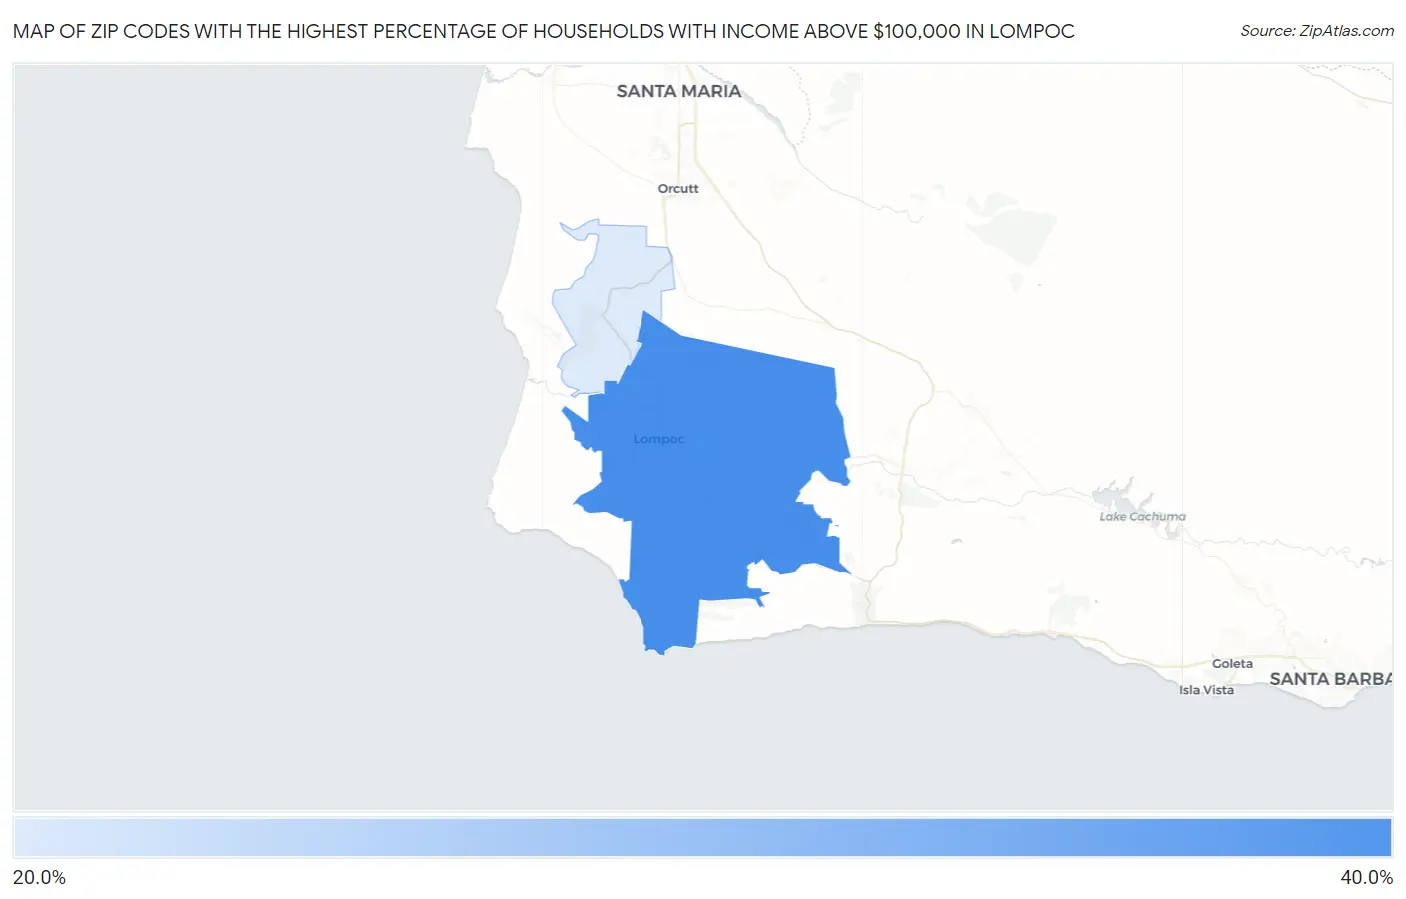
Map of Zip Codes with the Highest Percentage of Households with Income Above $100,000 in Lompoc
24.7%
34.4%
Zip Codes with the Highest Percentage of Households with Income Above $100,000 in Lompoc, CA
| Zip Code | Households with Income > $100k | vs State | vs National | |
| 1. | 93436 | 34.4% | 46.4%(-12.0)#1,082 | 37.3%(-2.90)#12,134 |
| 2. | 93437 | 24.7% | 46.4%(-21.7)#1,370 | 37.3%(-12.6)#20,036 |
1
Common Questions
What are the Top Zip Codes with the Highest Percentage of Households with Income Above $100,000 in Lompoc, CA?
Top Zip Codes with the Highest Percentage of Households with Income Above $100,000 in Lompoc, CA are:
What zip code has the Highest Percentage of Households with Income Above $100,000 in Lompoc, CA?
93436 has the Highest Percentage of Households with Income Above $100,000 in Lompoc, CA with 34.4%.
What is the Percentage of Households with Income Above $100,000 in Lompoc, CA?
Percentage of Households with Income Above $100,000 in Lompoc is 29.8%.
What is the Percentage of Households with Income Above $100,000 in California?
Percentage of Households with Income Above $100,000 in California is 46.4%.
What is the Percentage of Households with Income Above $100,000 in the United States?
Percentage of Households with Income Above $100,000 in the United States is 37.3%.