Cities with the Highest Percentage of Households with Income Above $100,000 in Montana
RELATED REPORTS & OPTIONS
Household Income | $100k+
Montana
Compare Cities
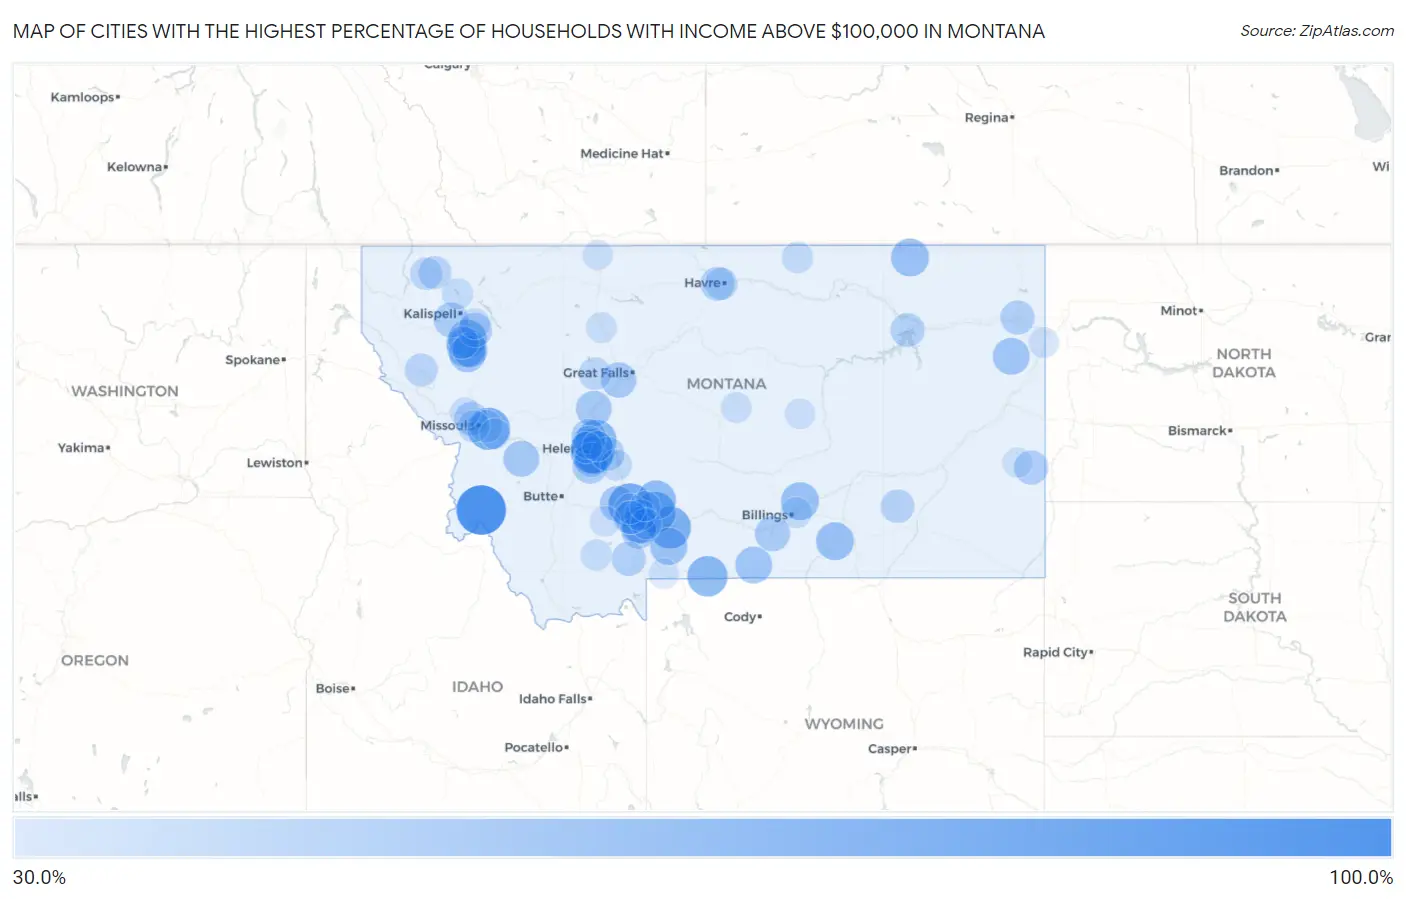
Map of Cities with the Highest Percentage of Households with Income Above $100,000 in Montana
0.0%
100.0%
Cities with the Highest Percentage of Households with Income Above $100,000 in Montana
| City | Households with Income > $100k | vs State | vs National | |
| 1. | Glacier Colony | 100.0% | 30.1%(+69.9)#1 | 37.3%(+62.7)#10 |
| 2. | Fords Creek Colony | 100.0% | 30.1%(+69.9)#2 | 37.3%(+62.7)#103 |
| 3. | Sula | 100.0% | 30.1%(+69.9)#3 | 37.3%(+62.7)#128 |
| 4. | Mammoth | 100.0% | 30.1%(+69.9)#4 | 37.3%(+62.7)#165 |
| 5. | Whitlash | 100.0% | 30.1%(+69.9)#5 | 37.3%(+62.7)#195 |
| 6. | South Hills | 79.9% | 30.1%(+49.8)#6 | 37.3%(+42.6)#559 |
| 7. | Gallatin River Ranch | 78.0% | 30.1%(+47.9)#7 | 37.3%(+40.7)#685 |
| 8. | Turah | 74.4% | 30.1%(+44.3)#8 | 37.3%(+37.1)#948 |
| 9. | Wineglass | 73.7% | 30.1%(+43.6)#9 | 37.3%(+36.4)#1,014 |
| 10. | Bridger | 72.0% | 30.1%(+41.9)#10 | 37.3%(+34.7)#1,165 |
| 11. | Homestead | 71.5% | 30.1%(+41.4)#11 | 37.3%(+34.2)#1,208 |
| 12. | Helena Valley Northeast | 68.2% | 30.1%(+38.1)#12 | 37.3%(+30.9)#1,551 |
| 13. | Silver Gate | 67.9% | 30.1%(+37.8)#13 | 37.3%(+30.6)#1,600 |
| 14. | North Harlem Colony | 66.7% | 30.1%(+36.6)#14 | 37.3%(+29.4)#1,722 |
| 15. | Nye | 64.0% | 30.1%(+33.9)#15 | 37.3%(+26.7)#2,077 |
| 16. | Sedan | 63.9% | 30.1%(+33.8)#16 | 37.3%(+26.6)#2,093 |
| 17. | Lindisfarne | 63.0% | 30.1%(+32.9)#17 | 37.3%(+25.7)#2,225 |
| 18. | Potomac | 62.5% | 30.1%(+32.4)#18 | 37.3%(+25.2)#2,303 |
| 19. | Luther | 61.5% | 30.1%(+31.4)#19 | 37.3%(+24.2)#2,479 |
| 20. | Rollins | 61.2% | 30.1%(+31.1)#20 | 37.3%(+23.9)#2,539 |
| 21. | York | 60.3% | 30.1%(+30.2)#21 | 37.3%(+23.0)#2,689 |
| 22. | Floweree | 60.0% | 30.1%(+29.9)#22 | 37.3%(+22.7)#2,743 |
| 23. | Redstone | 60.0% | 30.1%(+29.9)#23 | 37.3%(+22.7)#2,746 |
| 24. | Utica | 60.0% | 30.1%(+29.9)#24 | 37.3%(+22.7)#2,747 |
| 25. | Opheim | 59.7% | 30.1%(+29.6)#25 | 37.3%(+22.4)#2,803 |
| 26. | Shepherd | 59.6% | 30.1%(+29.5)#26 | 37.3%(+22.3)#2,821 |
| 27. | St Xavier | 59.4% | 30.1%(+29.3)#27 | 37.3%(+22.1)#2,857 |
| 28. | Montana City | 58.6% | 30.1%(+28.5)#28 | 37.3%(+21.3)#2,975 |
| 29. | Fishtail | 58.5% | 30.1%(+28.4)#29 | 37.3%(+21.2)#3,001 |
| 30. | Pray | 57.2% | 30.1%(+27.1)#30 | 37.3%(+19.9)#3,209 |
| 31. | King Arthur Park | 56.6% | 30.1%(+26.5)#31 | 37.3%(+19.3)#3,310 |
| 32. | Bearcreek | 56.1% | 30.1%(+26.0)#32 | 37.3%(+18.8)#3,412 |
| 33. | Fox Lake | 56.0% | 30.1%(+25.9)#33 | 37.3%(+18.7)#3,423 |
| 34. | Rocky Point | 56.0% | 30.1%(+25.9)#34 | 37.3%(+18.7)#3,424 |
| 35. | Four Corners | 55.1% | 30.1%(+25.0)#35 | 37.3%(+17.8)#3,590 |
| 36. | Helmville | 54.6% | 30.1%(+24.5)#36 | 37.3%(+17.3)#3,701 |
| 37. | Raynesford | 53.3% | 30.1%(+23.2)#37 | 37.3%(+16.0)#3,973 |
| 38. | Haugan | 53.3% | 30.1%(+23.2)#38 | 37.3%(+16.0)#3,975 |
| 39. | Maxville | 52.8% | 30.1%(+22.7)#39 | 37.3%(+15.5)#4,068 |
| 40. | Craig | 52.6% | 30.1%(+22.5)#40 | 37.3%(+15.3)#4,107 |
| 41. | Rapelje | 52.0% | 30.1%(+21.9)#41 | 37.3%(+14.7)#4,263 |
| 42. | Wheatland | 51.5% | 30.1%(+21.4)#42 | 37.3%(+14.2)#4,373 |
| 43. | Ulm | 51.0% | 30.1%(+20.9)#43 | 37.3%(+13.7)#4,480 |
| 44. | Kings Point | 50.5% | 30.1%(+20.4)#44 | 37.3%(+13.2)#4,589 |
| 45. | Ayers Ranch Colony | 50.0% | 30.1%(+19.9)#45 | 37.3%(+12.7)#4,744 |
| 46. | Silesia | 50.0% | 30.1%(+19.9)#46 | 37.3%(+12.7)#4,763 |
| 47. | Brockway | 50.0% | 30.1%(+19.9)#47 | 37.3%(+12.7)#4,766 |
| 48. | Lindsay | 50.0% | 30.1%(+19.9)#48 | 37.3%(+12.7)#4,768 |
| 49. | Kila | 49.7% | 30.1%(+19.6)#49 | 37.3%(+12.4)#4,837 |
| 50. | Rockvale | 49.6% | 30.1%(+19.5)#50 | 37.3%(+12.3)#4,870 |
| 51. | Jefferson City | 49.2% | 30.1%(+19.1)#51 | 37.3%(+11.9)#4,959 |
| 52. | Gallatin Gateway | 49.1% | 30.1%(+19.0)#52 | 37.3%(+11.8)#4,988 |
| 53. | Helena Valley Northwest | 48.4% | 30.1%(+18.3)#53 | 37.3%(+11.1)#5,149 |
| 54. | Clancy | 48.3% | 30.1%(+18.2)#54 | 37.3%(+11.0)#5,180 |
| 55. | Woods Bay | 47.6% | 30.1%(+17.5)#55 | 37.3%(+10.3)#5,374 |
| 56. | Baker | 47.1% | 30.1%(+17.0)#56 | 37.3%(+9.80)#5,518 |
| 57. | Big Sky | 46.9% | 30.1%(+16.8)#57 | 37.3%(+9.60)#5,567 |
| 58. | Culbertson | 46.9% | 30.1%(+16.8)#58 | 37.3%(+9.60)#5,584 |
| 59. | Beaver Creek | 46.3% | 30.1%(+16.2)#59 | 37.3%(+9.00)#5,756 |
| 60. | Wye | 46.2% | 30.1%(+16.1)#60 | 37.3%(+8.90)#5,780 |
| 61. | Fort Peck | 46.2% | 30.1%(+16.1)#61 | 37.3%(+8.90)#5,788 |
| 62. | Spokane Creek | 46.1% | 30.1%(+16.0)#62 | 37.3%(+8.80)#5,819 |
| 63. | Colstrip | 45.1% | 30.1%(+15.0)#63 | 37.3%(+7.80)#6,082 |
| 64. | Hardy | 44.8% | 30.1%(+14.7)#64 | 37.3%(+7.50)#6,193 |
| 65. | Helena Valley West Central | 44.3% | 30.1%(+14.2)#65 | 37.3%(+7.00)#6,325 |
| 66. | Amsterdam | 44.3% | 30.1%(+14.2)#66 | 37.3%(+7.00)#6,337 |
| 67. | Churchill | 43.5% | 30.1%(+13.4)#67 | 37.3%(+6.20)#6,575 |
| 68. | Weeksville | 42.9% | 30.1%(+12.8)#68 | 37.3%(+5.60)#6,765 |
| 69. | Turner Colony | 42.9% | 30.1%(+12.8)#69 | 37.3%(+5.60)#6,767 |
| 70. | Stryker | 42.9% | 30.1%(+12.8)#70 | 37.3%(+5.60)#6,772 |
| 71. | Dayton | 42.1% | 30.1%(+12.0)#71 | 37.3%(+4.80)#7,035 |
| 72. | Piltzville | 42.0% | 30.1%(+11.9)#72 | 37.3%(+4.70)#7,055 |
| 73. | Simms | 41.6% | 30.1%(+11.5)#73 | 37.3%(+4.30)#7,174 |
| 74. | Trego | 41.2% | 30.1%(+11.1)#74 | 37.3%(+3.90)#7,316 |
| 75. | West Havre | 41.1% | 30.1%(+11.0)#75 | 37.3%(+3.80)#7,357 |
| 76. | Cyr | 40.0% | 30.1%(+9.90)#76 | 37.3%(+2.70)#7,736 |
| 77. | Orchard Homes | 39.9% | 30.1%(+9.80)#77 | 37.3%(+2.60)#7,771 |
| 78. | The Silos | 37.8% | 30.1%(+7.70)#78 | 37.3%(+0.500)#8,552 |
| 79. | Turner | 37.8% | 30.1%(+7.70)#79 | 37.3%(+0.500)#8,563 |
| 80. | Helena West Side | 37.7% | 30.1%(+7.60)#80 | 37.3%(+0.400)#8,581 |
| 81. | Virginia City | 37.5% | 30.1%(+7.40)#81 | 37.3%(+0.200)#8,676 |
| 82. | Belgrade | 37.1% | 30.1%(+7.00)#82 | 37.3%(-0.200)#8,829 |
| 83. | Whitefish | 36.9% | 30.1%(+6.80)#83 | 37.3%(-0.400)#8,907 |
| 84. | Bozeman | 36.8% | 30.1%(+6.70)#84 | 37.3%(-0.500)#8,935 |
| 85. | Lockwood | 36.6% | 30.1%(+6.50)#85 | 37.3%(-0.700)#9,004 |
| 86. | Brady | 36.0% | 30.1%(+5.90)#86 | 37.3%(-1.30)#9,294 |
| 87. | Lewistown Heights | 35.9% | 30.1%(+5.80)#87 | 37.3%(-1.40)#9,328 |
| 88. | Bigfork | 35.8% | 30.1%(+5.70)#88 | 37.3%(-1.50)#9,343 |
| 89. | Clinton | 35.5% | 30.1%(+5.40)#89 | 37.3%(-1.80)#9,481 |
| 90. | Manhattan | 35.0% | 30.1%(+4.90)#90 | 37.3%(-2.30)#9,697 |
| 91. | Winnett | 34.8% | 30.1%(+4.70)#91 | 37.3%(-2.50)#9,810 |
| 92. | Frenchtown | 34.6% | 30.1%(+4.50)#92 | 37.3%(-2.70)#9,888 |
| 93. | Fairview | 34.6% | 30.1%(+4.50)#93 | 37.3%(-2.70)#9,892 |
| 94. | Harrison | 34.6% | 30.1%(+4.50)#94 | 37.3%(-2.70)#9,909 |
| 95. | Helena Valley Southeast | 34.3% | 30.1%(+4.20)#95 | 37.3%(-3.00)#10,022 |
| 96. | Sunburst | 34.3% | 30.1%(+4.20)#96 | 37.3%(-3.00)#10,053 |
| 97. | Gardiner | 34.2% | 30.1%(+4.10)#97 | 37.3%(-3.10)#10,094 |
| 98. | Plevna | 34.2% | 30.1%(+4.10)#98 | 37.3%(-3.10)#10,100 |
| 99. | Pine Creek | 33.8% | 30.1%(+3.70)#99 | 37.3%(-3.50)#10,274 |
| 100. | Springhill | 33.8% | 30.1%(+3.70)#100 | 37.3%(-3.50)#10,275 |
Common Questions
What are the Top 10 Cities with the Highest Percentage of Households with Income Above $100,000 in Montana?
Top 10 Cities with the Highest Percentage of Households with Income Above $100,000 in Montana are:
#1
100.0%
#2
79.9%
#3
78.0%
#4
74.4%
#5
73.7%
#6
72.0%
#7
68.2%
#8
67.9%
#9
63.9%
#10
63.0%
What city has the Highest Percentage of Households with Income Above $100,000 in Montana?
Sula has the Highest Percentage of Households with Income Above $100,000 in Montana with 100.0%.
What is the Percentage of Households with Income Above $100,000 in the State of Montana?
Percentage of Households with Income Above $100,000 in Montana is 30.1%.
What is the Percentage of Households with Income Above $100,000 in the United States?
Percentage of Households with Income Above $100,000 in the United States is 37.3%.