Zip Codes with the Highest Percentage of Households with Income Above $100,000 in San Diego, CA
RELATED REPORTS & OPTIONS
Household Income | $100k+
San Diego
Compare Zip Codes
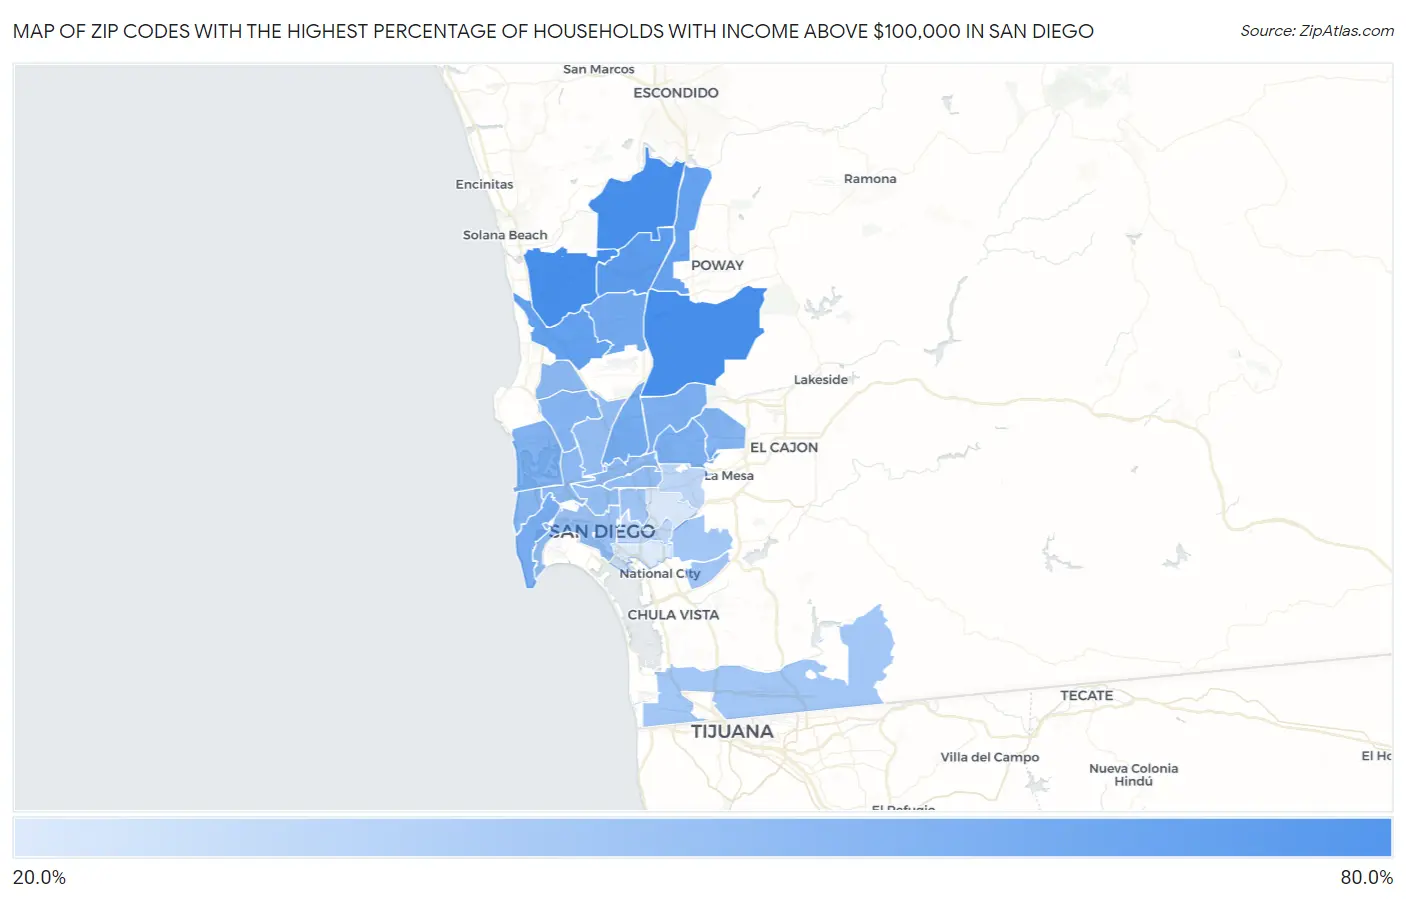
Map of Zip Codes with the Highest Percentage of Households with Income Above $100,000 in San Diego
23.3%
75.2%
Zip Codes with the Highest Percentage of Households with Income Above $100,000 in San Diego, CA
| Zip Code | Households with Income > $100k | vs State | vs National | |
| 1. | 92130 | 75.2% | 46.4%(+28.8)#67 | 37.3%(+37.9)#565 |
| 2. | 92131 | 75.2% | 46.4%(+28.8)#68 | 37.3%(+37.9)#566 |
| 3. | 92127 | 74.9% | 46.4%(+28.5)#71 | 37.3%(+37.6)#579 |
| 4. | 92129 | 67.7% | 46.4%(+21.3)#158 | 37.3%(+30.4)#1,197 |
| 5. | 92121 | 64.1% | 46.4%(+17.7)#236 | 37.3%(+26.8)#1,668 |
| 6. | 92128 | 62.9% | 46.4%(+16.5)#263 | 37.3%(+25.6)#1,858 |
| 7. | 92126 | 57.7% | 46.4%(+11.3)#389 | 37.3%(+20.4)#2,819 |
| 8. | 92123 | 56.9% | 46.4%(+10.5)#406 | 37.3%(+19.6)#3,000 |
| 9. | 92106 | 56.5% | 46.4%(+10.1)#413 | 37.3%(+19.2)#3,089 |
| 10. | 92120 | 54.8% | 46.4%(+8.40)#462 | 37.3%(+17.5)#3,500 |
| 11. | 92124 | 53.9% | 46.4%(+7.50)#497 | 37.3%(+16.6)#3,741 |
| 12. | 92109 | 52.7% | 46.4%(+6.30)#527 | 37.3%(+15.4)#4,051 |
| 13. | 92119 | 52.6% | 46.4%(+6.20)#531 | 37.3%(+15.3)#4,087 |
| 14. | 92117 | 51.1% | 46.4%(+4.70)#568 | 37.3%(+13.8)#4,499 |
| 15. | 92107 | 50.7% | 46.4%(+4.30)#583 | 37.3%(+13.4)#4,625 |
| 16. | 92122 | 49.5% | 46.4%(+3.10)#619 | 37.3%(+12.2)#5,007 |
| 17. | 92110 | 48.1% | 46.4%(+1.70)#657 | 37.3%(+10.8)#5,457 |
| 18. | 92108 | 48.1% | 46.4%(+1.70)#659 | 37.3%(+10.8)#5,459 |
| 19. | 92116 | 46.4% | 46.4%(=0.000)#703 | 37.3%(+9.10)#6,040 |
| 20. | 92103 | 46.3% | 46.4%(-0.100)#708 | 37.3%(+9.00)#6,080 |
| 21. | 92111 | 46.2% | 46.4%(-0.200)#711 | 37.3%(+8.90)#6,117 |
| 22. | 92101 | 44.6% | 46.4%(-1.80)#763 | 37.3%(+7.30)#6,768 |
| 23. | 92139 | 41.9% | 46.4%(-4.50)#851 | 37.3%(+4.60)#7,922 |
| 24. | 92104 | 41.7% | 46.4%(-4.70)#859 | 37.3%(+4.40)#8,022 |
| 25. | 92114 | 41.4% | 46.4%(-5.00)#869 | 37.3%(+4.10)#8,149 |
| 26. | 92154 | 40.9% | 46.4%(-5.50)#889 | 37.3%(+3.60)#8,436 |
| 27. | 92115 | 33.0% | 46.4%(-13.4)#1,129 | 37.3%(-4.30)#13,094 |
| 28. | 92102 | 32.2% | 46.4%(-14.2)#1,149 | 37.3%(-5.10)#13,691 |
| 29. | 92105 | 24.4% | 46.4%(-22.0)#1,378 | 37.3%(-12.9)#20,273 |
| 30. | 92113 | 23.3% | 46.4%(-23.1)#1,412 | 37.3%(-14.0)#21,304 |
1
Common Questions
What are the Top 10 Zip Codes with the Highest Percentage of Households with Income Above $100,000 in San Diego, CA?
Top 10 Zip Codes with the Highest Percentage of Households with Income Above $100,000 in San Diego, CA are:
What zip code has the Highest Percentage of Households with Income Above $100,000 in San Diego, CA?
92130 has the Highest Percentage of Households with Income Above $100,000 in San Diego, CA with 75.2%.
What is the Percentage of Households with Income Above $100,000 in San Diego, CA?
Percentage of Households with Income Above $100,000 in San Diego is 49.5%.
What is the Percentage of Households with Income Above $100,000 in California?
Percentage of Households with Income Above $100,000 in California is 46.4%.
What is the Percentage of Households with Income Above $100,000 in the United States?
Percentage of Households with Income Above $100,000 in the United States is 37.3%.