Cities with the Highest Percentage of Households with Income Above $100,000 in New Mexico
RELATED REPORTS & OPTIONS
Household Income | $100k+
New Mexico
Compare Cities
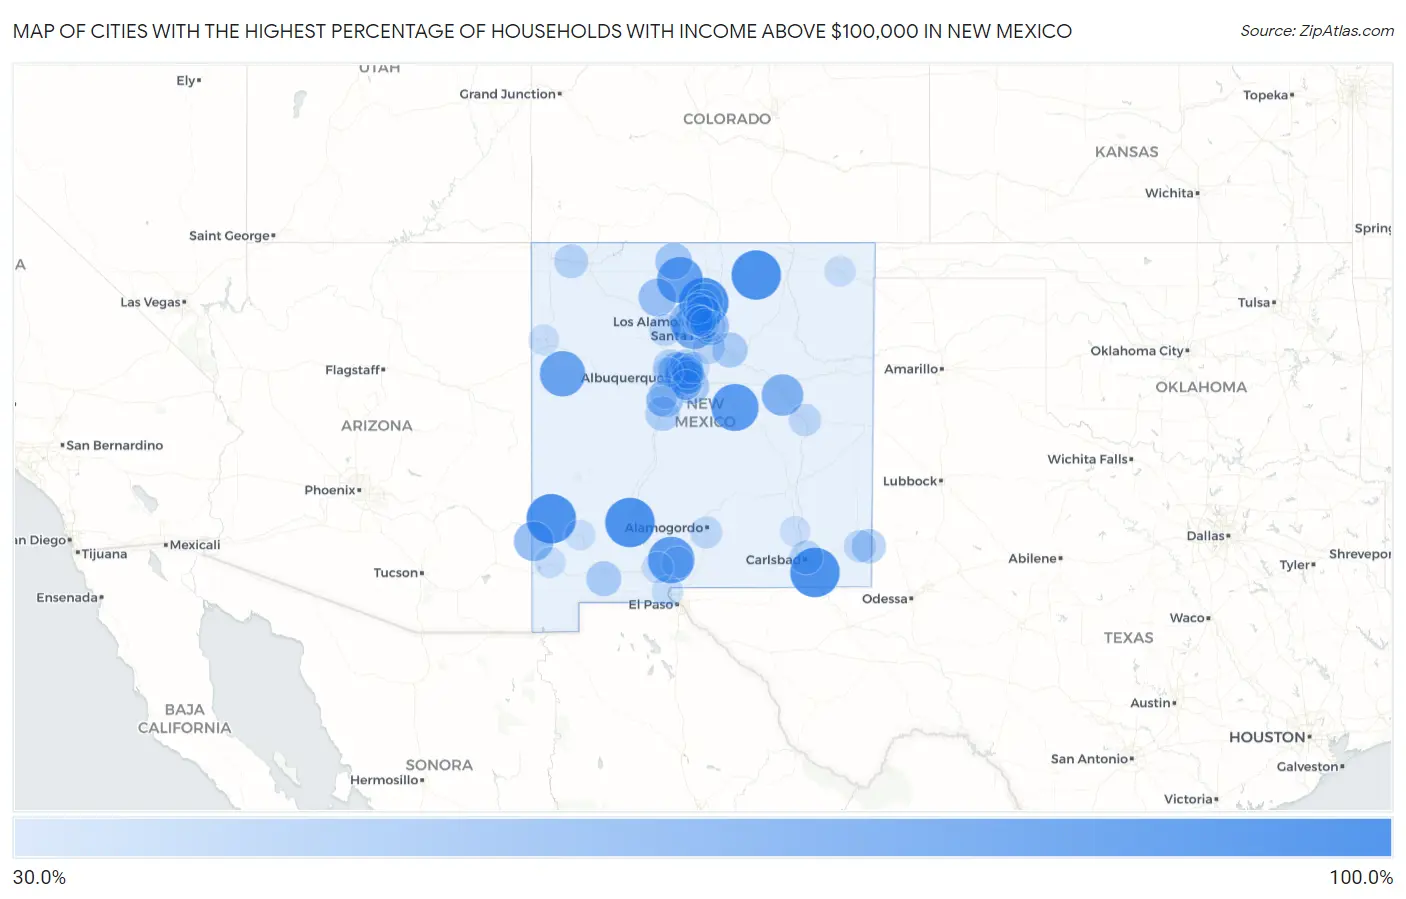
Map of Cities with the Highest Percentage of Households with Income Above $100,000 in New Mexico
0.0%
100.0%
Cities with the Highest Percentage of Households with Income Above $100,000 in New Mexico
| City | Households with Income > $100k | vs State | vs National | |
| 1. | Malaga | 100.0% | 27.3%(+72.7)#1 | 37.3%(+62.7)#27 |
| 2. | Ute Park | 100.0% | 27.3%(+72.7)#2 | 37.3%(+62.7)#60 |
| 3. | Lyden | 100.0% | 27.3%(+72.7)#3 | 37.3%(+62.7)#68 |
| 4. | Caballo | 100.0% | 27.3%(+72.7)#4 | 37.3%(+62.7)#88 |
| 5. | El Morro Valley | 100.0% | 27.3%(+72.7)#5 | 37.3%(+62.7)#96 |
| 6. | Vanderwagen | 100.0% | 27.3%(+72.7)#6 | 37.3%(+62.7)#98 |
| 7. | Ojo Caliente | 100.0% | 27.3%(+72.7)#7 | 37.3%(+62.7)#110 |
| 8. | Buckhorn | 100.0% | 27.3%(+72.7)#8 | 37.3%(+62.7)#130 |
| 9. | Seton | 100.0% | 27.3%(+72.7)#9 | 37.3%(+62.7)#138 |
| 10. | Deer Canyon | 100.0% | 27.3%(+72.7)#10 | 37.3%(+62.7)#151 |
| 11. | Pinehaven | 100.0% | 27.3%(+72.7)#11 | 37.3%(+62.7)#186 |
| 12. | Encino | 92.3% | 27.3%(+65.0)#12 | 37.3%(+55.0)#222 |
| 13. | Organ | 90.3% | 27.3%(+63.0)#13 | 37.3%(+53.0)#248 |
| 14. | Canjilon | 88.0% | 27.3%(+60.7)#14 | 37.3%(+50.7)#290 |
| 15. | Ramah | 86.7% | 27.3%(+59.4)#15 | 37.3%(+49.4)#310 |
| 16. | La Tierra | 80.9% | 27.3%(+53.6)#16 | 37.3%(+43.6)#509 |
| 17. | Paa-Ko | 80.8% | 27.3%(+53.5)#17 | 37.3%(+43.5)#510 |
| 18. | White Rock | 79.2% | 27.3%(+51.9)#18 | 37.3%(+41.9)#599 |
| 19. | Bluewater | 78.9% | 27.3%(+51.6)#19 | 37.3%(+41.6)#622 |
| 20. | Las Campanas | 75.9% | 27.3%(+48.6)#20 | 37.3%(+38.6)#817 |
| 21. | Fort Wingate | 75.9% | 27.3%(+48.6)#21 | 37.3%(+38.6)#823 |
| 22. | Mount Taylor | 75.5% | 27.3%(+48.2)#22 | 37.3%(+38.2)#856 |
| 23. | Puerto De Luna | 73.8% | 27.3%(+46.5)#23 | 37.3%(+36.5)#1,001 |
| 24. | Santa Fe Foothills | 69.8% | 27.3%(+42.5)#24 | 37.3%(+32.5)#1,353 |
| 25. | Picacho Hills | 68.5% | 27.3%(+41.2)#25 | 37.3%(+31.2)#1,510 |
| 26. | Virden | 67.7% | 27.3%(+40.4)#26 | 37.3%(+30.4)#1,621 |
| 27. | Medanales | 66.7% | 27.3%(+39.4)#27 | 37.3%(+29.4)#1,718 |
| 28. | Hyde Park | 66.5% | 27.3%(+39.2)#28 | 37.3%(+29.2)#1,760 |
| 29. | Sandia Park | 65.8% | 27.3%(+38.5)#29 | 37.3%(+28.5)#1,847 |
| 30. | Los Alamos | 65.6% | 27.3%(+38.3)#30 | 37.3%(+28.3)#1,864 |
| 31. | Tano Road | 63.6% | 27.3%(+36.3)#31 | 37.3%(+26.3)#2,122 |
| 32. | Sandia Heights | 62.9% | 27.3%(+35.6)#32 | 37.3%(+25.6)#2,241 |
| 33. | Fruitland | 62.6% | 27.3%(+35.3)#33 | 37.3%(+25.3)#2,281 |
| 34. | Chupadero | 62.3% | 27.3%(+35.0)#34 | 37.3%(+25.0)#2,337 |
| 35. | Gallina | 62.3% | 27.3%(+35.0)#35 | 37.3%(+25.0)#2,338 |
| 36. | Crestview | 61.9% | 27.3%(+34.6)#36 | 37.3%(+24.6)#2,412 |
| 37. | Sombrillo | 61.7% | 27.3%(+34.4)#37 | 37.3%(+24.4)#2,450 |
| 38. | Cedar Crest | 60.7% | 27.3%(+33.4)#38 | 37.3%(+23.4)#2,619 |
| 39. | El Cerro | 59.6% | 27.3%(+32.3)#39 | 37.3%(+22.3)#2,816 |
| 40. | Ensenada | 58.2% | 27.3%(+30.9)#40 | 37.3%(+20.9)#3,050 |
| 41. | Punta De Agua | 56.7% | 27.3%(+29.4)#41 | 37.3%(+19.4)#3,299 |
| 42. | Canova | 56.2% | 27.3%(+28.9)#42 | 37.3%(+18.9)#3,389 |
| 43. | Manzano Springs | 55.0% | 27.3%(+27.7)#43 | 37.3%(+17.7)#3,617 |
| 44. | Rio Rancho Estates | 54.9% | 27.3%(+27.6)#44 | 37.3%(+17.6)#3,630 |
| 45. | Golden Acres | 53.7% | 27.3%(+26.4)#45 | 37.3%(+16.4)#3,885 |
| 46. | North San Ysidro | 53.4% | 27.3%(+26.1)#46 | 37.3%(+16.1)#3,944 |
| 47. | Cuartelez | 53.0% | 27.3%(+25.7)#47 | 37.3%(+15.7)#4,021 |
| 48. | Sunshine | 52.7% | 27.3%(+25.4)#48 | 37.3%(+15.4)#4,089 |
| 49. | Placitas Cdp Sandoval County | 52.5% | 27.3%(+25.2)#49 | 37.3%(+15.2)#4,118 |
| 50. | Tres Arroyos | 52.1% | 27.3%(+24.8)#50 | 37.3%(+14.8)#4,236 |
| 51. | Cedro | 52.0% | 27.3%(+24.7)#51 | 37.3%(+14.7)#4,260 |
| 52. | Canones | 51.1% | 27.3%(+23.8)#52 | 37.3%(+13.8)#4,466 |
| 53. | Casa Colorada | 50.8% | 27.3%(+23.5)#53 | 37.3%(+13.5)#4,528 |
| 54. | Nadine | 50.7% | 27.3%(+23.4)#54 | 37.3%(+13.4)#4,550 |
| 55. | Kirtland | 49.4% | 27.3%(+22.1)#55 | 37.3%(+12.1)#4,912 |
| 56. | Conejo | 49.1% | 27.3%(+21.8)#56 | 37.3%(+11.8)#4,989 |
| 57. | Corrales | 49.0% | 27.3%(+21.7)#57 | 37.3%(+11.7)#4,998 |
| 58. | La Huerta | 49.0% | 27.3%(+21.7)#58 | 37.3%(+11.7)#5,010 |
| 59. | San Jose Cdp San Miguel County | 48.8% | 27.3%(+21.5)#59 | 37.3%(+11.5)#5,067 |
| 60. | Edith Enclave | 48.6% | 27.3%(+21.3)#60 | 37.3%(+11.3)#5,111 |
| 61. | La Madera | 48.2% | 27.3%(+20.9)#61 | 37.3%(+10.9)#5,205 |
| 62. | Canon | 47.4% | 27.3%(+20.1)#62 | 37.3%(+10.1)#5,433 |
| 63. | Sagar | 47.0% | 27.3%(+19.7)#63 | 37.3%(+9.70)#5,554 |
| 64. | Little Walnut | 46.6% | 27.3%(+19.3)#64 | 37.3%(+9.30)#5,660 |
| 65. | Sedillo | 46.6% | 27.3%(+19.3)#65 | 37.3%(+9.30)#5,668 |
| 66. | Eldorado At Santa Fe | 46.3% | 27.3%(+19.0)#66 | 37.3%(+9.00)#5,742 |
| 67. | Encantado | 45.8% | 27.3%(+18.5)#67 | 37.3%(+8.50)#5,895 |
| 68. | La Villita | 45.0% | 27.3%(+17.7)#68 | 37.3%(+7.70)#6,121 |
| 69. | Barton | 44.8% | 27.3%(+17.5)#69 | 37.3%(+7.50)#6,179 |
| 70. | Sandia Knolls | 44.5% | 27.3%(+17.2)#70 | 37.3%(+7.20)#6,271 |
| 71. | Fort Sumner | 44.5% | 27.3%(+17.2)#71 | 37.3%(+7.20)#6,273 |
| 72. | Monument | 44.3% | 27.3%(+17.0)#72 | 37.3%(+7.00)#6,339 |
| 73. | Boles Acres | 43.7% | 27.3%(+16.4)#73 | 37.3%(+6.40)#6,502 |
| 74. | Jemez Springs | 43.7% | 27.3%(+16.4)#74 | 37.3%(+6.40)#6,516 |
| 75. | White Sands | 42.8% | 27.3%(+15.5)#75 | 37.3%(+5.50)#6,794 |
| 76. | Timberlake | 42.7% | 27.3%(+15.4)#76 | 37.3%(+5.40)#6,834 |
| 77. | Rio En Medio | 42.5% | 27.3%(+15.2)#77 | 37.3%(+5.20)#6,898 |
| 78. | La Union | 42.1% | 27.3%(+14.8)#78 | 37.3%(+4.80)#7,027 |
| 79. | Fairacres | 42.0% | 27.3%(+14.7)#79 | 37.3%(+4.70)#7,052 |
| 80. | San Pedro | 41.5% | 27.3%(+14.2)#80 | 37.3%(+4.20)#7,218 |
| 81. | South River | 41.3% | 27.3%(+14.0)#81 | 37.3%(+4.00)#7,270 |
| 82. | Sunlit Hills | 41.0% | 27.3%(+13.7)#82 | 37.3%(+3.70)#7,374 |
| 83. | Stanley | 40.6% | 27.3%(+13.3)#83 | 37.3%(+3.30)#7,517 |
| 84. | El Rancho | 40.3% | 27.3%(+13.0)#84 | 37.3%(+3.00)#7,625 |
| 85. | Glen Acres | 40.3% | 27.3%(+13.0)#85 | 37.3%(+3.00)#7,633 |
| 86. | San Ildefonso Pueblo | 40.2% | 27.3%(+12.9)#86 | 37.3%(+2.90)#7,665 |
| 87. | Rock Springs | 40.0% | 27.3%(+12.7)#87 | 37.3%(+2.70)#7,718 |
| 88. | Grenville | 40.0% | 27.3%(+12.7)#88 | 37.3%(+2.70)#7,747 |
| 89. | Arenas Valley | 39.6% | 27.3%(+12.3)#89 | 37.3%(+2.30)#7,878 |
| 90. | Los Ranchos De Albuquerque | 39.2% | 27.3%(+11.9)#90 | 37.3%(+1.90)#7,983 |
| 91. | Rio Chiquito | 39.0% | 27.3%(+11.7)#91 | 37.3%(+1.70)#8,091 |
| 92. | Artesia | 38.9% | 27.3%(+11.6)#92 | 37.3%(+1.60)#8,101 |
| 93. | El Duende | 38.8% | 27.3%(+11.5)#93 | 37.3%(+1.50)#8,158 |
| 94. | Jaconita | 38.7% | 27.3%(+11.4)#94 | 37.3%(+1.40)#8,211 |
| 95. | Bosque Farms | 38.3% | 27.3%(+11.0)#95 | 37.3%(+1.000)#8,364 |
| 96. | Cañoncito | 38.2% | 27.3%(+10.9)#96 | 37.3%(+0.900)#8,410 |
| 97. | White Cliffs | 38.1% | 27.3%(+10.8)#97 | 37.3%(+0.800)#8,443 |
| 98. | Los Chaves | 38.0% | 27.3%(+10.7)#98 | 37.3%(+0.700)#8,467 |
| 99. | Ponderosa Pine | 37.8% | 27.3%(+10.5)#99 | 37.3%(+0.500)#8,543 |
| 100. | Cuyamungue Grant | 37.6% | 27.3%(+10.3)#100 | 37.3%(+0.300)#8,622 |
Common Questions
What are the Top 10 Cities with the Highest Percentage of Households with Income Above $100,000 in New Mexico?
Top 10 Cities with the Highest Percentage of Households with Income Above $100,000 in New Mexico are:
What city has the Highest Percentage of Households with Income Above $100,000 in New Mexico?
Malaga has the Highest Percentage of Households with Income Above $100,000 in New Mexico with 100.0%.
What is the Percentage of Households with Income Above $100,000 in the State of New Mexico?
Percentage of Households with Income Above $100,000 in New Mexico is 27.3%.
What is the Percentage of Households with Income Above $100,000 in the United States?
Percentage of Households with Income Above $100,000 in the United States is 37.3%.