Zip Codes with the Highest Percentage of Households with Income Above $100,000 in Sacramento, CA
RELATED REPORTS & OPTIONS
Household Income | $100k+
Sacramento
Compare Zip Codes
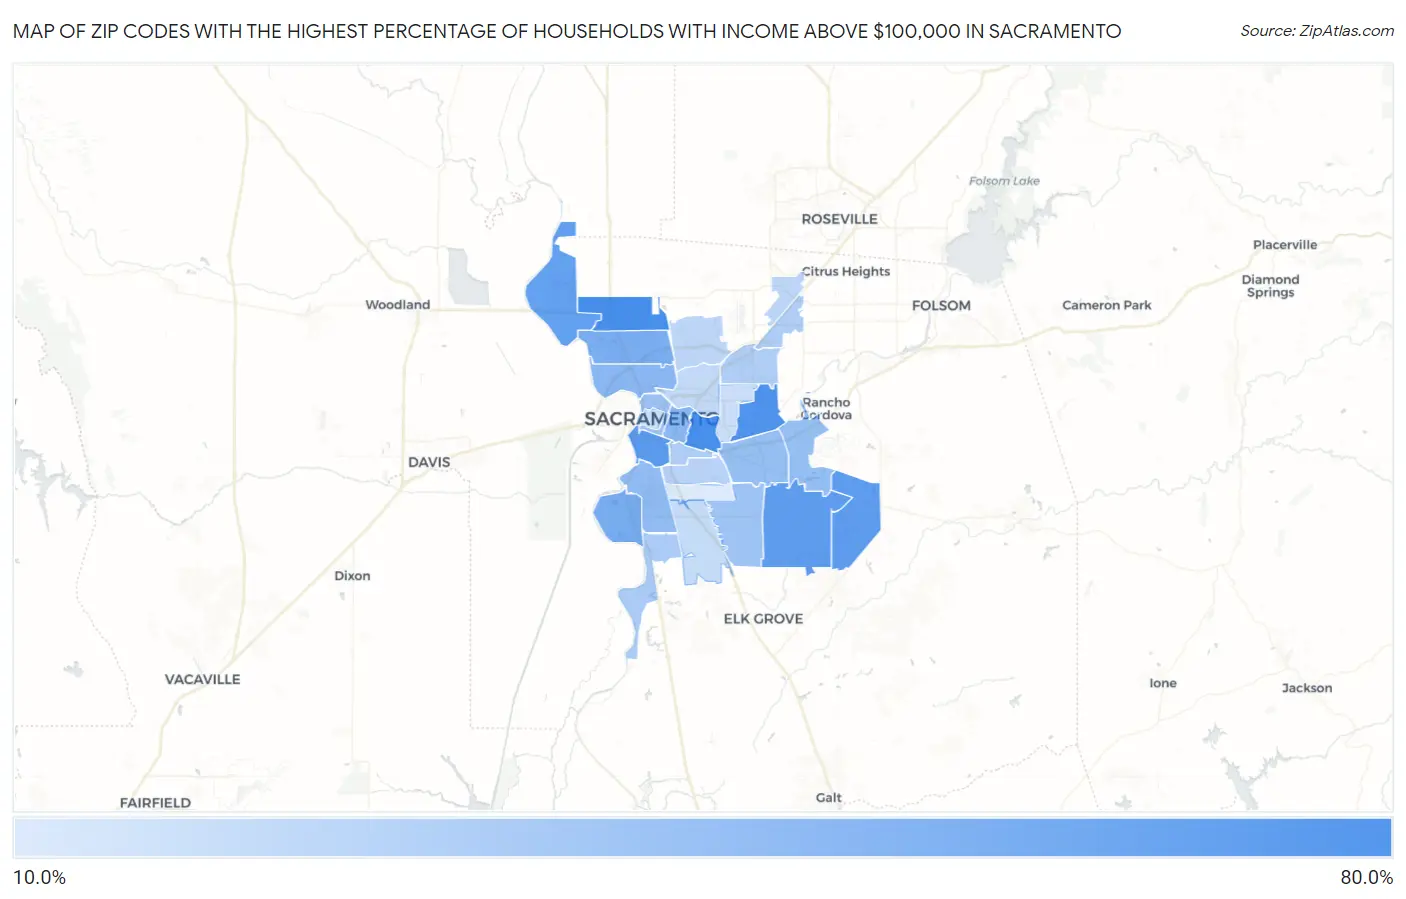
Map of Zip Codes with the Highest Percentage of Households with Income Above $100,000 in Sacramento
17.5%
61.4%
Zip Codes with the Highest Percentage of Households with Income Above $100,000 in Sacramento, CA
| Zip Code | Households with Income > $100k | vs State | vs National | |
| 1. | 95819 | 61.4% | 46.4%(+15.0)#302 | 37.3%(+24.1)#2,103 |
| 2. | 95835 | 61.2% | 46.4%(+14.8)#306 | 37.3%(+23.9)#2,131 |
| 3. | 95864 | 59.1% | 46.4%(+12.7)#366 | 37.3%(+21.8)#2,544 |
| 4. | 95818 | 54.6% | 46.4%(+8.20)#472 | 37.3%(+17.3)#3,549 |
| 5. | 95829 | 54.0% | 46.4%(+7.60)#492 | 37.3%(+16.7)#3,711 |
| 6. | 95830 | 53.8% | 46.4%(+7.40)#499 | 37.3%(+16.5)#3,773 |
| 7. | 95837 | 52.1% | 46.4%(+5.70)#546 | 37.3%(+14.8)#4,228 |
| 8. | 95831 | 45.8% | 46.4%(-0.600)#728 | 37.3%(+8.50)#6,285 |
| 9. | 95834 | 45.3% | 46.4%(-1.10)#742 | 37.3%(+8.00)#6,497 |
| 10. | 95816 | 40.2% | 46.4%(-6.20)#910 | 37.3%(+2.90)#8,792 |
| 11. | 95833 | 39.8% | 46.4%(-6.60)#924 | 37.3%(+2.50)#9,006 |
| 12. | 95822 | 37.9% | 46.4%(-8.50)#970 | 37.3%(+0.600)#10,035 |
| 13. | 95826 | 36.9% | 46.4%(-9.50)#1,007 | 37.3%(-0.400)#10,613 |
| 14. | 95827 | 36.9% | 46.4%(-9.50)#1,009 | 37.3%(-0.400)#10,623 |
| 15. | 95811 | 35.5% | 46.4%(-10.9)#1,046 | 37.3%(-1.80)#11,456 |
| 16. | 95828 | 34.1% | 46.4%(-12.3)#1,096 | 37.3%(-3.20)#12,316 |
| 17. | 95832 | 30.7% | 46.4%(-15.7)#1,192 | 37.3%(-6.60)#14,890 |
| 18. | 95841 | 29.8% | 46.4%(-16.6)#1,223 | 37.3%(-7.50)#15,581 |
| 19. | 95817 | 29.3% | 46.4%(-17.1)#1,240 | 37.3%(-8.00)#16,013 |
| 20. | 95821 | 29.1% | 46.4%(-17.3)#1,249 | 37.3%(-8.20)#16,151 |
| 21. | 95820 | 27.0% | 46.4%(-19.4)#1,308 | 37.3%(-10.3)#17,982 |
| 22. | 95838 | 26.1% | 46.4%(-20.3)#1,325 | 37.3%(-11.2)#18,773 |
| 23. | 95842 | 25.7% | 46.4%(-20.7)#1,337 | 37.3%(-11.6)#19,137 |
| 24. | 95815 | 24.5% | 46.4%(-21.9)#1,375 | 37.3%(-12.8)#20,189 |
| 25. | 95823 | 23.5% | 46.4%(-22.9)#1,407 | 37.3%(-13.8)#21,111 |
| 26. | 95825 | 22.0% | 46.4%(-24.4)#1,438 | 37.3%(-15.3)#22,383 |
| 27. | 95814 | 21.6% | 46.4%(-24.8)#1,452 | 37.3%(-15.7)#22,725 |
| 28. | 95824 | 17.5% | 46.4%(-28.9)#1,535 | 37.3%(-19.8)#25,899 |
1
Common Questions
What are the Top 10 Zip Codes with the Highest Percentage of Households with Income Above $100,000 in Sacramento, CA?
Top 10 Zip Codes with the Highest Percentage of Households with Income Above $100,000 in Sacramento, CA are:
What zip code has the Highest Percentage of Households with Income Above $100,000 in Sacramento, CA?
95819 has the Highest Percentage of Households with Income Above $100,000 in Sacramento, CA with 61.4%.
What is the Percentage of Households with Income Above $100,000 in Sacramento, CA?
Percentage of Households with Income Above $100,000 in Sacramento is 38.5%.
What is the Percentage of Households with Income Above $100,000 in California?
Percentage of Households with Income Above $100,000 in California is 46.4%.
What is the Percentage of Households with Income Above $100,000 in the United States?
Percentage of Households with Income Above $100,000 in the United States is 37.3%.