Cities with the Highest Percentage of Households with Income Above $100,000 in Vermont
RELATED REPORTS & OPTIONS
Household Income | $100k+
Vermont
Compare Cities
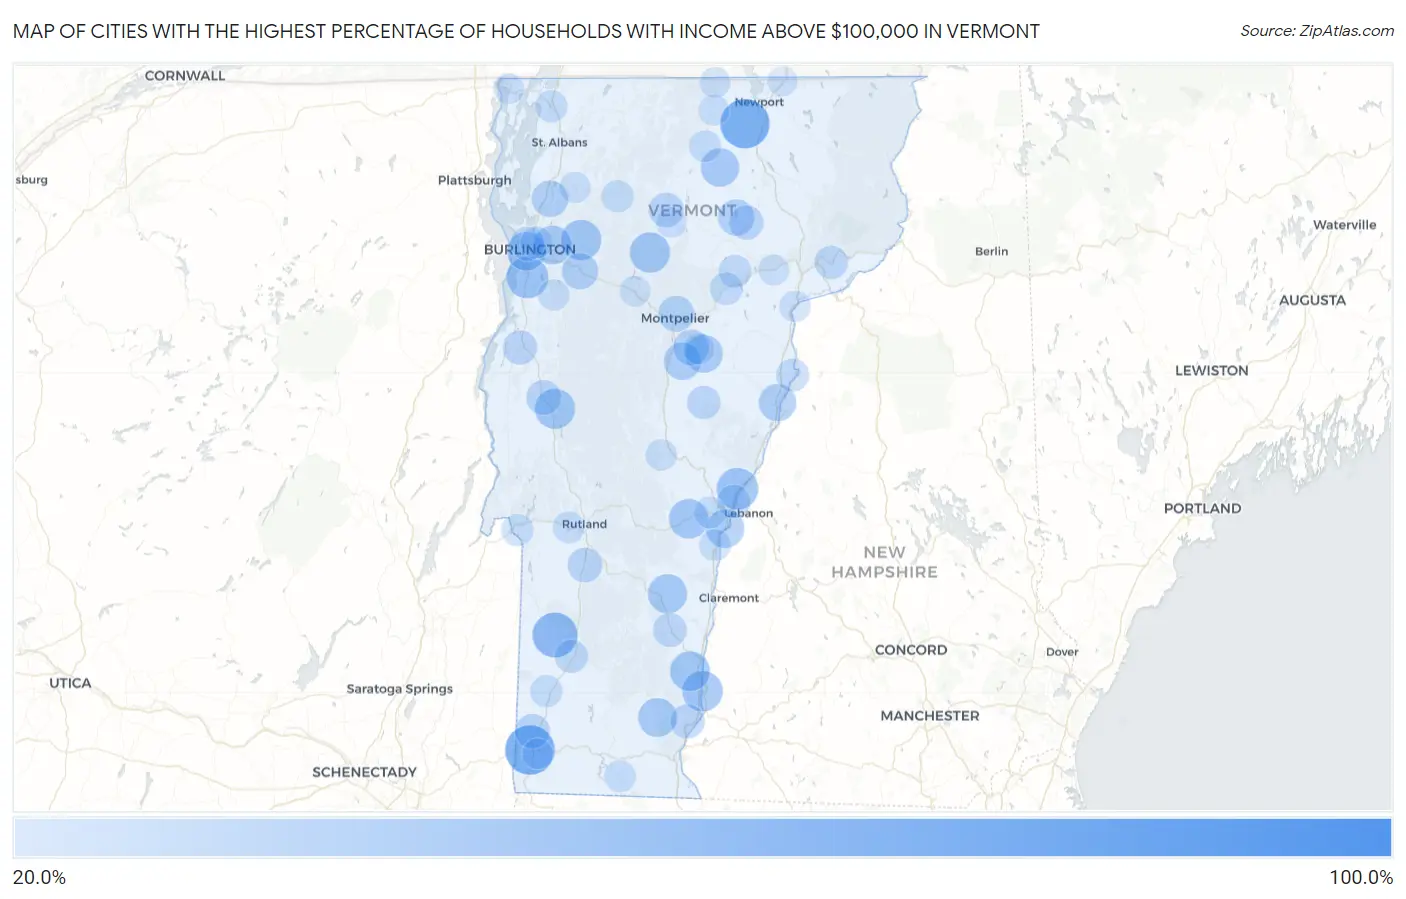
Map of Cities with the Highest Percentage of Households with Income Above $100,000 in Vermont
0.0%
100.0%
Cities with the Highest Percentage of Households with Income Above $100,000 in Vermont
| City | Households with Income > $100k | vs State | vs National | |
| 1. | Bolton | 100.0% | 36.0%(+64.0)#1 | 37.3%(+62.7)#1 |
| 2. | Underhill Center | 100.0% | 36.0%(+64.0)#2 | 37.3%(+62.7)#100 |
| 3. | Stratton Mountain | 89.7% | 36.0%(+53.7)#3 | 37.3%(+52.4)#261 |
| 4. | Hanksville | 83.4% | 36.0%(+47.4)#4 | 37.3%(+46.1)#395 |
| 5. | Old Bennington | 72.2% | 36.0%(+36.2)#5 | 37.3%(+34.9)#1,139 |
| 6. | Coventry | 71.4% | 36.0%(+35.4)#6 | 37.3%(+34.1)#1,218 |
| 7. | West Dummerston | 64.7% | 36.0%(+28.7)#7 | 37.3%(+27.4)#1,976 |
| 8. | Bolton Valley | 63.4% | 36.0%(+27.4)#8 | 37.3%(+26.1)#2,152 |
| 9. | Westford | 61.7% | 36.0%(+25.7)#9 | 37.3%(+24.4)#2,448 |
| 10. | Dorset | 60.6% | 36.0%(+24.6)#10 | 37.3%(+23.3)#2,636 |
| 11. | South Lincoln | 57.9% | 36.0%(+21.9)#11 | 37.3%(+20.6)#3,093 |
| 12. | Lyndon Center | 55.9% | 36.0%(+19.9)#12 | 37.3%(+18.6)#3,446 |
| 13. | Grafton | 54.3% | 36.0%(+18.3)#13 | 37.3%(+17.0)#3,762 |
| 14. | Shelburne | 52.5% | 36.0%(+16.5)#14 | 37.3%(+15.2)#4,117 |
| 15. | Norwich | 52.2% | 36.0%(+16.2)#15 | 37.3%(+14.9)#4,209 |
| 16. | Weston | 50.0% | 36.0%(+14.0)#16 | 37.3%(+12.7)#4,745 |
| 17. | Westminster | 49.7% | 36.0%(+13.7)#17 | 37.3%(+12.4)#4,834 |
| 18. | Stowe | 49.0% | 36.0%(+13.0)#18 | 37.3%(+11.7)#5,013 |
| 19. | Jericho | 48.7% | 36.0%(+12.7)#19 | 37.3%(+11.4)#5,080 |
| 20. | East Middlebury | 48.7% | 36.0%(+12.7)#20 | 37.3%(+11.4)#5,084 |
| 21. | West Charlotte | 47.9% | 36.0%(+11.9)#21 | 37.3%(+10.6)#5,287 |
| 22. | Saxtons River | 47.8% | 36.0%(+11.8)#22 | 37.3%(+10.5)#5,312 |
| 23. | Woodstock | 47.2% | 36.0%(+11.2)#23 | 37.3%(+9.90)#5,489 |
| 24. | Cavendish | 46.1% | 36.0%(+10.1)#24 | 37.3%(+8.80)#5,822 |
| 25. | South Burlington | 45.2% | 36.0%(+9.20)#25 | 37.3%(+7.90)#6,045 |
| 26. | Chittenden | 45.2% | 36.0%(+9.20)#26 | 37.3%(+7.90)#6,068 |
| 27. | Newfane | 45.1% | 36.0%(+9.10)#27 | 37.3%(+7.80)#6,103 |
| 28. | Essex Junction | 44.9% | 36.0%(+8.90)#28 | 37.3%(+7.60)#6,143 |
| 29. | Albany | 44.6% | 36.0%(+8.60)#29 | 37.3%(+7.30)#6,250 |
| 30. | North Hartland | 43.4% | 36.0%(+7.40)#30 | 37.3%(+6.10)#6,614 |
| 31. | East Barre | 42.9% | 36.0%(+6.90)#31 | 37.3%(+5.60)#6,756 |
| 32. | Waterbury Center | 42.8% | 36.0%(+6.80)#32 | 37.3%(+5.50)#6,800 |
| 33. | Highgate Center | 42.5% | 36.0%(+6.50)#33 | 37.3%(+5.20)#6,896 |
| 34. | Williamstown | 42.0% | 36.0%(+6.00)#34 | 37.3%(+4.70)#7,051 |
| 35. | Stamford | 42.0% | 36.0%(+6.00)#35 | 37.3%(+4.70)#7,056 |
| 36. | Bradford | 41.9% | 36.0%(+5.90)#36 | 37.3%(+4.60)#7,076 |
| 37. | North Pownal | 41.5% | 36.0%(+5.50)#37 | 37.3%(+4.20)#7,213 |
| 38. | East Charlotte | 40.7% | 36.0%(+4.70)#38 | 37.3%(+3.40)#7,476 |
| 39. | New Haven | 40.0% | 36.0%(+4.00)#39 | 37.3%(+2.70)#7,728 |
| 40. | Milton | 39.8% | 36.0%(+3.80)#40 | 37.3%(+2.50)#7,798 |
| 41. | Greensboro | 39.2% | 36.0%(+3.20)#41 | 37.3%(+1.90)#8,005 |
| 42. | Richmond | 39.0% | 36.0%(+3.00)#42 | 37.3%(+1.70)#8,082 |
| 43. | Bakersfield | 38.4% | 36.0%(+2.40)#43 | 37.3%(+1.10)#8,344 |
| 44. | Montpelier | 38.3% | 36.0%(+2.30)#44 | 37.3%(+1.000)#8,360 |
| 45. | South Barre | 38.1% | 36.0%(+2.10)#45 | 37.3%(+0.800)#8,434 |
| 46. | St. George | 36.1% | 36.0%(+0.100)#46 | 37.3%(-1.20)#9,229 |
| 47. | Hyde Park | 35.5% | 36.0%(-0.500)#47 | 37.3%(-1.80)#9,484 |
| 48. | Middlebury | 35.4% | 36.0%(-0.600)#48 | 37.3%(-1.90)#9,501 |
| 49. | East Poultney | 35.3% | 36.0%(-0.700)#49 | 37.3%(-2.00)#9,583 |
| 50. | Wallingford | 35.1% | 36.0%(-0.900)#50 | 37.3%(-2.20)#9,661 |
| 51. | South Shaftsbury | 35.0% | 36.0%(-1.00)#51 | 37.3%(-2.30)#9,709 |
| 52. | Greensboro Bend | 34.7% | 36.0%(-1.30)#52 | 37.3%(-2.60)#9,854 |
| 53. | West Woodstock | 34.5% | 36.0%(-1.50)#53 | 37.3%(-2.80)#9,953 |
| 54. | Putney | 34.2% | 36.0%(-1.80)#54 | 37.3%(-3.10)#10,099 |
| 55. | Vergennes | 34.0% | 36.0%(-2.00)#55 | 37.3%(-3.30)#10,172 |
| 56. | Huntington | 33.7% | 36.0%(-2.30)#56 | 37.3%(-3.60)#10,314 |
| 57. | Burlington | 33.3% | 36.0%(-2.70)#57 | 37.3%(-4.00)#10,443 |
| 58. | Chester | 33.1% | 36.0%(-2.90)#58 | 37.3%(-4.20)#10,624 |
| 59. | Concord | 32.1% | 36.0%(-3.90)#59 | 37.3%(-5.20)#11,121 |
| 60. | Chelsea | 32.0% | 36.0%(-4.00)#60 | 37.3%(-5.30)#11,164 |
| 61. | Wilder | 31.6% | 36.0%(-4.40)#61 | 37.3%(-5.70)#11,328 |
| 62. | Manchester Center | 31.4% | 36.0%(-4.60)#62 | 37.3%(-5.90)#11,425 |
| 63. | Newbury | 31.0% | 36.0%(-5.00)#63 | 37.3%(-6.30)#11,630 |
| 64. | Cabot | 30.5% | 36.0%(-5.50)#64 | 37.3%(-6.80)#11,925 |
| 65. | East Dorset | 30.5% | 36.0%(-5.50)#65 | 37.3%(-6.80)#11,928 |
| 66. | Marshfield | 30.3% | 36.0%(-5.70)#66 | 37.3%(-7.00)#12,033 |
| 67. | Hartford | 30.2% | 36.0%(-5.80)#67 | 37.3%(-7.10)#12,086 |
| 68. | North Clarendon | 29.6% | 36.0%(-6.40)#68 | 37.3%(-7.70)#12,439 |
| 69. | South Hero | 29.6% | 36.0%(-6.40)#69 | 37.3%(-7.70)#12,446 |
| 70. | Jeffersonville | 29.4% | 36.0%(-6.60)#70 | 37.3%(-7.90)#12,538 |
| 71. | Arlington | 29.1% | 36.0%(-6.90)#71 | 37.3%(-8.20)#12,683 |
| 72. | Killington | 29.1% | 36.0%(-6.90)#72 | 37.3%(-8.20)#12,698 |
| 73. | Fair Haven | 29.0% | 36.0%(-7.00)#73 | 37.3%(-8.30)#12,738 |
| 74. | Lincoln | 29.0% | 36.0%(-7.00)#74 | 37.3%(-8.30)#12,777 |
| 75. | Swanton | 28.9% | 36.0%(-7.10)#75 | 37.3%(-8.40)#12,803 |
| 76. | Winooski | 28.7% | 36.0%(-7.30)#76 | 37.3%(-8.60)#12,920 |
| 77. | Lowell | 28.6% | 36.0%(-7.40)#77 | 37.3%(-8.70)#13,032 |
| 78. | Quechee | 28.5% | 36.0%(-7.50)#78 | 37.3%(-8.80)#13,124 |
| 79. | Jacksonville | 28.1% | 36.0%(-7.90)#79 | 37.3%(-9.20)#13,373 |
| 80. | West Rutland | 27.9% | 36.0%(-8.10)#80 | 37.3%(-9.40)#13,475 |
| 81. | Proctor | 27.7% | 36.0%(-8.30)#81 | 37.3%(-9.60)#13,609 |
| 82. | Hartland | 27.7% | 36.0%(-8.30)#82 | 37.3%(-9.60)#13,623 |
| 83. | Jamaica | 27.5% | 36.0%(-8.50)#83 | 37.3%(-9.80)#13,765 |
| 84. | Bethel | 27.2% | 36.0%(-8.80)#84 | 37.3%(-10.1)#13,947 |
| 85. | Peacham | 27.2% | 36.0%(-8.80)#85 | 37.3%(-10.1)#13,959 |
| 86. | Middletown Springs | 27.1% | 36.0%(-8.90)#86 | 37.3%(-10.2)#14,030 |
| 87. | Websterville | 27.0% | 36.0%(-9.00)#87 | 37.3%(-10.3)#14,093 |
| 88. | Fairfax | 26.9% | 36.0%(-9.10)#88 | 37.3%(-10.4)#14,157 |
| 89. | Hinesburg | 26.9% | 36.0%(-9.10)#89 | 37.3%(-10.4)#14,159 |
| 90. | Barnet | 26.6% | 36.0%(-9.40)#90 | 37.3%(-10.7)#14,378 |
| 91. | Troy | 26.5% | 36.0%(-9.50)#91 | 37.3%(-10.8)#14,436 |
| 92. | Danville | 25.9% | 36.0%(-10.1)#92 | 37.3%(-11.4)#14,843 |
| 93. | Waterbury | 25.7% | 36.0%(-10.3)#93 | 37.3%(-11.6)#14,970 |
| 94. | Bennington | 25.5% | 36.0%(-10.5)#94 | 37.3%(-11.8)#15,103 |
| 95. | Alburgh | 25.3% | 36.0%(-10.7)#95 | 37.3%(-12.0)#15,297 |
| 96. | Morrisville | 24.9% | 36.0%(-11.1)#96 | 37.3%(-12.4)#15,581 |
| 97. | North Troy | 24.8% | 36.0%(-11.2)#97 | 37.3%(-12.5)#15,663 |
| 98. | Pownal Center | 24.5% | 36.0%(-11.5)#98 | 37.3%(-12.8)#15,878 |
| 99. | Huntington Center | 24.4% | 36.0%(-11.6)#99 | 37.3%(-12.9)#15,977 |
| 100. | Derby Line | 24.1% | 36.0%(-11.9)#100 | 37.3%(-13.2)#16,190 |
1
2Common Questions
What are the Top 10 Cities with the Highest Percentage of Households with Income Above $100,000 in Vermont?
Top 10 Cities with the Highest Percentage of Households with Income Above $100,000 in Vermont are:
#1
72.2%
#2
71.4%
#3
60.6%
#4
52.5%
#5
52.2%
#6
49.7%
#7
49.0%
#8
48.7%
#9
48.7%
#10
47.8%
What city has the Highest Percentage of Households with Income Above $100,000 in Vermont?
Old Bennington has the Highest Percentage of Households with Income Above $100,000 in Vermont with 72.2%.
What is the Percentage of Households with Income Above $100,000 in the State of Vermont?
Percentage of Households with Income Above $100,000 in Vermont is 36.0%.
What is the Percentage of Households with Income Above $100,000 in the United States?
Percentage of Households with Income Above $100,000 in the United States is 37.3%.