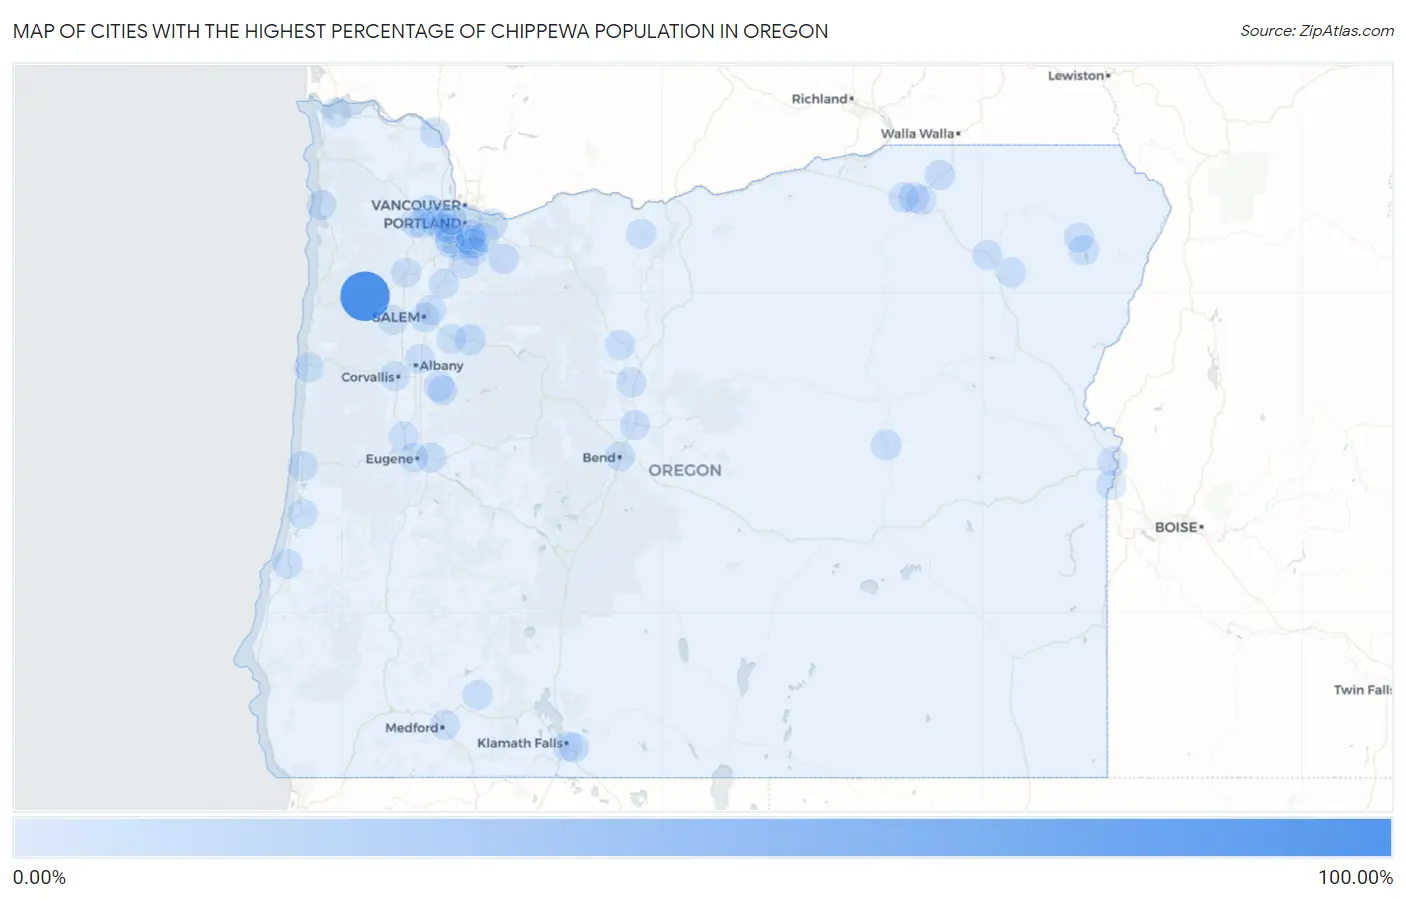
Cities with the Highest Percentage of Chippewa Population in Oregon
RELATED REPORTS & OPTIONS
Chippewa
Oregon
Compare Cities
Map of Cities with the Highest Percentage of Chippewa Population in Oregon
0.00%
100.00%
Cities with the Highest Percentage of Chippewa Population in Oregon
| City | Chippewa | vs State | vs National | |
| 1. | Fort Hill | 100.00% | 0.073%(+99.9)#1 | 0.058%(+99.9)#2 |
| 2. | Mehama | 4.12% | 0.073%(+4.05)#2 | 0.058%(+4.06)#193 |
| 3. | Seneca | 2.40% | 0.073%(+2.32)#3 | 0.058%(+2.34)#330 |
| 4. | Svensen | 1.72% | 0.073%(+1.65)#4 | 0.058%(+1.67)#417 |
| 5. | Estacada | 1.71% | 0.073%(+1.64)#5 | 0.058%(+1.65)#420 |
| 6. | South Lebanon | 1.66% | 0.073%(+1.59)#6 | 0.058%(+1.60)#430 |
| 7. | Rainier | 1.00% | 0.073%(+0.922)#7 | 0.058%(+0.937)#646 |
| 8. | Athena | 0.90% | 0.073%(+0.827)#8 | 0.058%(+0.842)#694 |
| 9. | Joseph | 0.86% | 0.073%(+0.786)#9 | 0.058%(+0.801)#714 |
| 10. | Riverside | 0.85% | 0.073%(+0.780)#10 | 0.058%(+0.794)#721 |
| 11. | Butte Falls | 0.75% | 0.073%(+0.675)#11 | 0.058%(+0.690)#780 |
| 12. | Rivergrove | 0.72% | 0.073%(+0.644)#12 | 0.058%(+0.659)#812 |
| 13. | Dufur | 0.70% | 0.073%(+0.627)#13 | 0.058%(+0.642)#826 |
| 14. | Jennings Lodge | 0.61% | 0.073%(+0.541)#14 | 0.058%(+0.556)#917 |
| 15. | Boring | 0.50% | 0.073%(+0.431)#15 | 0.058%(+0.445)#1,016 |
| 16. | Rockaway Beach | 0.50% | 0.073%(+0.430)#16 | 0.058%(+0.445)#1,017 |
| 17. | Mission | 0.49% | 0.073%(+0.416)#17 | 0.058%(+0.431)#1,035 |
| 18. | Union | 0.45% | 0.073%(+0.380)#18 | 0.058%(+0.395)#1,081 |
| 19. | Nyssa | 0.37% | 0.073%(+0.302)#19 | 0.058%(+0.317)#1,207 |
| 20. | Junction City | 0.34% | 0.073%(+0.264)#20 | 0.058%(+0.279)#1,276 |
| 21. | North Plains | 0.33% | 0.073%(+0.254)#21 | 0.058%(+0.269)#1,303 |
| 22. | Canby | 0.33% | 0.073%(+0.253)#22 | 0.058%(+0.268)#1,304 |
| 23. | Ontario | 0.28% | 0.073%(+0.211)#23 | 0.058%(+0.226)#1,385 |
| 24. | Sodaville | 0.27% | 0.073%(+0.202)#24 | 0.058%(+0.217)#1,405 |
| 25. | Redmond | 0.25% | 0.073%(+0.179)#25 | 0.058%(+0.194)#1,454 |
| 26. | Astoria | 0.25% | 0.073%(+0.173)#26 | 0.058%(+0.188)#1,480 |
| 27. | Florence | 0.25% | 0.073%(+0.172)#27 | 0.058%(+0.187)#1,481 |
| 28. | Enterprise | 0.23% | 0.073%(+0.157)#28 | 0.058%(+0.172)#1,524 |
| 29. | Coos Bay | 0.23% | 0.073%(+0.153)#29 | 0.058%(+0.168)#1,540 |
| 30. | Stayton | 0.22% | 0.073%(+0.146)#30 | 0.058%(+0.161)#1,554 |
| 31. | Springfield | 0.17% | 0.073%(+0.102)#31 | 0.058%(+0.117)#1,691 |
| 32. | Millersburg | 0.17% | 0.073%(+0.096)#32 | 0.058%(+0.111)#1,721 |
| 33. | Gladstone | 0.15% | 0.073%(+0.077)#33 | 0.058%(+0.092)#1,800 |
| 34. | Portland | 0.15% | 0.073%(+0.075)#34 | 0.058%(+0.090)#1,807 |
| 35. | Rockcreek | 0.14% | 0.073%(+0.068)#35 | 0.058%(+0.083)#1,840 |
| 36. | King City | 0.14% | 0.073%(+0.066)#36 | 0.058%(+0.080)#1,855 |
| 37. | Warm Springs | 0.12% | 0.073%(+0.050)#37 | 0.058%(+0.065)#1,911 |
| 38. | Reedsport | 0.12% | 0.073%(+0.043)#38 | 0.058%(+0.058)#1,940 |
| 39. | Eugene | 0.11% | 0.073%(+0.035)#39 | 0.058%(+0.050)#1,980 |
| 40. | Newport | 0.097% | 0.073%(+0.024)#40 | 0.058%(+0.039)#2,026 |
| 41. | Hillsboro | 0.091% | 0.073%(+0.018)#41 | 0.058%(+0.033)#2,049 |
| 42. | Dallas | 0.089% | 0.073%(+0.016)#42 | 0.058%(+0.031)#2,059 |
| 43. | Mcminnville | 0.087% | 0.073%(+0.014)#43 | 0.058%(+0.029)#2,070 |
| 44. | Oak Grove | 0.086% | 0.073%(+0.013)#44 | 0.058%(+0.028)#2,079 |
| 45. | Bend | 0.081% | 0.073%(+0.009)#45 | 0.058%(+0.024)#2,110 |
| 46. | Pendleton | 0.076% | 0.073%(+0.004)#46 | 0.058%(+0.019)#2,133 |
| 47. | Gresham | 0.075% | 0.073%(+0.002)#47 | 0.058%(+0.017)#2,148 |
| 48. | Cornelius | 0.060% | 0.073%(-0.012)#48 | 0.058%(+0.003)#2,252 |
| 49. | Tigard | 0.058% | 0.073%(-0.015)#49 | 0.058%(+0.000)#2,271 |
| 50. | Hayesville | 0.055% | 0.073%(-0.018)#50 | 0.058%(-0.003)#2,298 |
| 51. | Oregon City | 0.051% | 0.073%(-0.022)#51 | 0.058%(-0.007)#2,320 |
| 52. | Aloha | 0.050% | 0.073%(-0.022)#52 | 0.058%(-0.007)#2,324 |
| 53. | Corvallis | 0.050% | 0.073%(-0.023)#53 | 0.058%(-0.008)#2,329 |
| 54. | Beaverton | 0.046% | 0.073%(-0.027)#54 | 0.058%(-0.012)#2,363 |
| 55. | Culver | 0.046% | 0.073%(-0.027)#55 | 0.058%(-0.012)#2,365 |
| 56. | Forest Grove | 0.046% | 0.073%(-0.027)#56 | 0.058%(-0.012)#2,366 |
| 57. | Medford | 0.034% | 0.073%(-0.039)#57 | 0.058%(-0.024)#2,487 |
| 58. | Milwaukie | 0.028% | 0.073%(-0.044)#58 | 0.058%(-0.029)#2,557 |
| 59. | Salem | 0.028% | 0.073%(-0.045)#59 | 0.058%(-0.030)#2,566 |
| 60. | Santa Clara | 0.026% | 0.073%(-0.046)#60 | 0.058%(-0.031)#2,584 |
| 61. | Cedar Mill | 0.026% | 0.073%(-0.047)#61 | 0.058%(-0.032)#2,589 |
| 62. | Klamath Falls | 0.023% | 0.073%(-0.050)#62 | 0.058%(-0.035)#2,635 |
| 63. | Happy Valley | 0.016% | 0.073%(-0.056)#63 | 0.058%(-0.041)#2,734 |
| 64. | Woodburn | 0.011% | 0.073%(-0.061)#64 | 0.058%(-0.046)#2,824 |
| 65. | La Grande | 0.0076% | 0.073%(-0.065)#65 | 0.058%(-0.050)#2,902 |
| 66. | Altamont | 0.0049% | 0.073%(-0.068)#66 | 0.058%(-0.053)#2,957 |
Common Questions
What are the Top 10 Cities with the Highest Percentage of Chippewa Population in Oregon?
Top 10 Cities with the Highest Percentage of Chippewa Population in Oregon are:
#1
100.00%
#2
4.12%
#3
2.40%
#4
1.71%
#5
1.66%
#6
1.00%
#7
0.90%
#8
0.86%
#9
0.85%
#10
0.75%
What city has the Highest Percentage of Chippewa Population in Oregon?
Fort Hill has the Highest Percentage of Chippewa Population in Oregon with 100.00%.
What is the Percentage of Chippewa Population in the State of Oregon?
Percentage of Chippewa Population in Oregon is 0.073%.
What is the Percentage of Chippewa Population in the United States?
Percentage of Chippewa Population in the United States is 0.058%.