Cities with the Highest Percentage of Chippewa Population in Michigan
RELATED REPORTS & OPTIONS
Chippewa
Michigan
Compare Cities
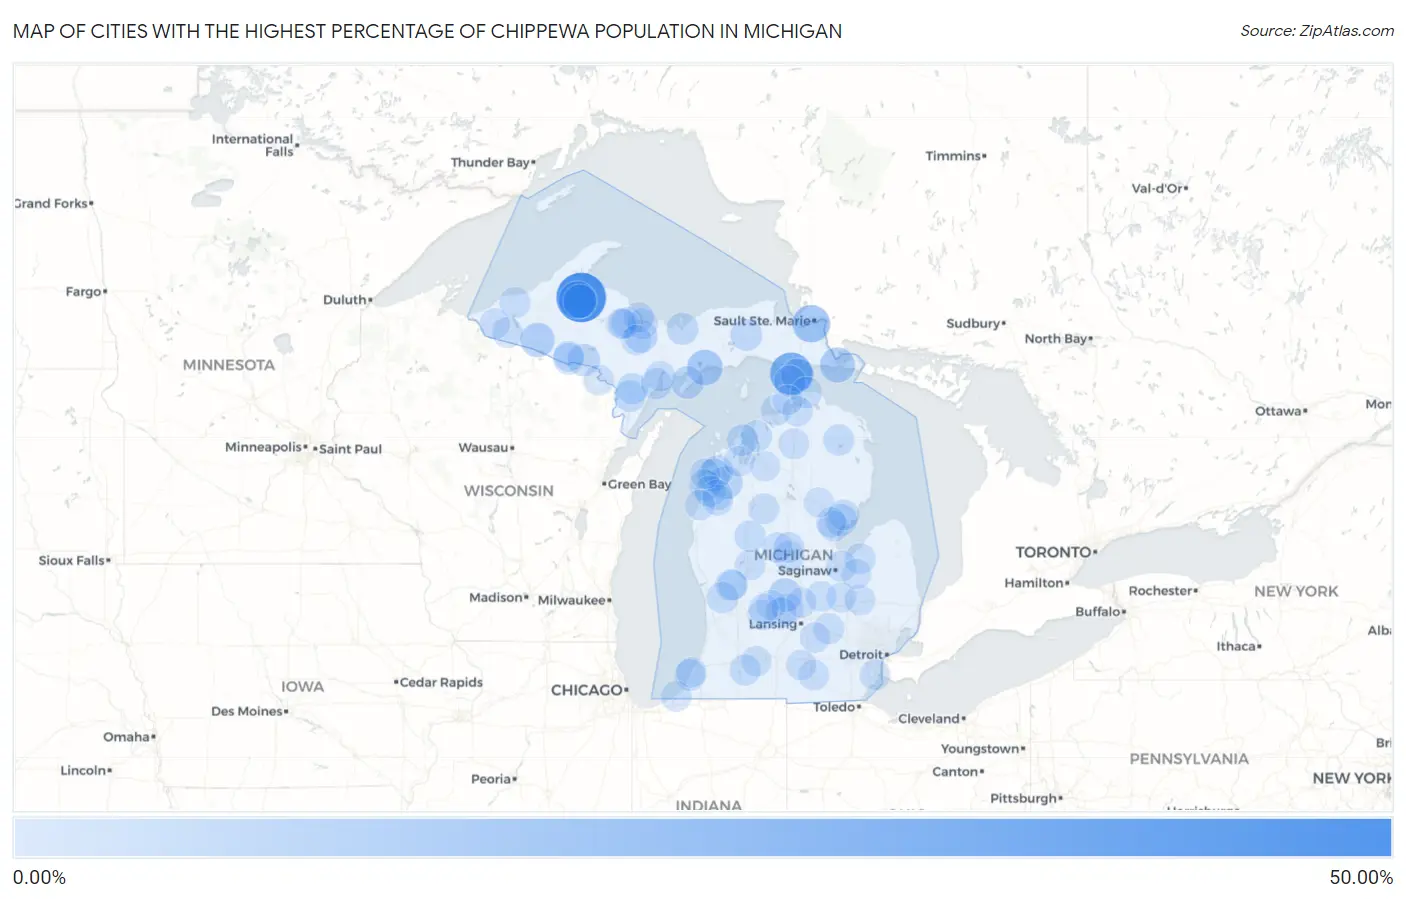
Map of Cities with the Highest Percentage of Chippewa Population in Michigan
0.00%
50.00%
Cities with the Highest Percentage of Chippewa Population in Michigan
| City | Chippewa | vs State | vs National | |
| 1. | Zeba | 45.03% | 0.36%(+44.7)#1 | 0.058%(+45.0)#42 |
| 2. | St Ignace | 28.12% | 0.36%(+27.8)#2 | 0.058%(+28.1)#56 |
| 3. | Kincheloe | 23.56% | 0.36%(+23.2)#3 | 0.058%(+23.5)#58 |
| 4. | Naubinway | 18.67% | 0.36%(+18.3)#4 | 0.058%(+18.6)#65 |
| 5. | Baraga | 17.13% | 0.36%(+16.8)#5 | 0.058%(+17.1)#66 |
| 6. | Sault Ste Marie | 16.75% | 0.36%(+16.4)#6 | 0.058%(+16.7)#67 |
| 7. | Manistique | 12.61% | 0.36%(+12.3)#7 | 0.058%(+12.6)#79 |
| 8. | Brimley | 12.57% | 0.36%(+12.2)#8 | 0.058%(+12.5)#80 |
| 9. | De Tour Village | 11.50% | 0.36%(+11.1)#9 | 0.058%(+11.4)#87 |
| 10. | Hurontown | 10.53% | 0.36%(+10.2)#10 | 0.058%(+10.5)#93 |
| 11. | Watersmeet | 9.88% | 0.36%(+9.52)#11 | 0.058%(+9.82)#97 |
| 12. | L Anse | 8.55% | 0.36%(+8.19)#12 | 0.058%(+8.49)#108 |
| 13. | Greenland | 7.75% | 0.36%(+7.39)#13 | 0.058%(+7.69)#118 |
| 14. | Hubbardston | 7.64% | 0.36%(+7.28)#14 | 0.058%(+7.58)#122 |
| 15. | Mackinac Island | 7.18% | 0.36%(+6.82)#15 | 0.058%(+7.12)#127 |
| 16. | Nessen City | 6.67% | 0.36%(+6.31)#16 | 0.058%(+6.61)#132 |
| 17. | Benzonia | 6.33% | 0.36%(+5.98)#17 | 0.058%(+6.28)#136 |
| 18. | Garden | 5.92% | 0.36%(+5.56)#18 | 0.058%(+5.86)#146 |
| 19. | K I Sawyer | 5.75% | 0.36%(+5.40)#19 | 0.058%(+5.70)#149 |
| 20. | Alpha | 5.71% | 0.36%(+5.36)#20 | 0.058%(+5.66)#151 |
| 21. | Covington | 5.50% | 0.36%(+5.15)#21 | 0.058%(+5.45)#157 |
| 22. | Munising | 4.64% | 0.36%(+4.29)#22 | 0.058%(+4.59)#176 |
| 23. | Omer | 4.49% | 0.36%(+4.13)#23 | 0.058%(+4.43)#178 |
| 24. | Newberry | 4.31% | 0.36%(+3.95)#24 | 0.058%(+4.25)#186 |
| 25. | Mackinaw City | 4.27% | 0.36%(+3.92)#25 | 0.058%(+4.22)#187 |
| 26. | Casnovia | 4.16% | 0.36%(+3.80)#26 | 0.058%(+4.10)#191 |
| 27. | Honor | 4.03% | 0.36%(+3.67)#27 | 0.058%(+3.97)#198 |
| 28. | Carney | 3.92% | 0.36%(+3.56)#28 | 0.058%(+3.86)#202 |
| 29. | Eureka | 3.88% | 0.36%(+3.53)#29 | 0.058%(+3.83)#204 |
| 30. | Powers | 3.85% | 0.36%(+3.49)#30 | 0.058%(+3.79)#205 |
| 31. | Eastport | 3.70% | 0.36%(+3.35)#31 | 0.058%(+3.65)#217 |
| 32. | Caspian | 3.60% | 0.36%(+3.24)#32 | 0.058%(+3.54)#224 |
| 33. | Omena | 3.60% | 0.36%(+3.24)#33 | 0.058%(+3.54)#225 |
| 34. | Arcadia | 3.36% | 0.36%(+3.00)#34 | 0.058%(+3.30)#237 |
| 35. | Escanaba | 3.30% | 0.36%(+2.94)#35 | 0.058%(+3.24)#240 |
| 36. | Cheboygan | 3.28% | 0.36%(+2.93)#36 | 0.058%(+3.23)#241 |
| 37. | Shoreham | 3.26% | 0.36%(+2.90)#37 | 0.058%(+3.20)#244 |
| 38. | Dodgeville | 3.24% | 0.36%(+2.88)#38 | 0.058%(+3.18)#246 |
| 39. | Hersey | 3.09% | 0.36%(+2.73)#39 | 0.058%(+3.03)#258 |
| 40. | Coopersville | 3.02% | 0.36%(+2.66)#40 | 0.058%(+2.96)#264 |
| 41. | Hillman | 3.02% | 0.36%(+2.66)#41 | 0.058%(+2.96)#265 |
| 42. | Vicksburg | 2.95% | 0.36%(+2.60)#42 | 0.058%(+2.90)#270 |
| 43. | Bear Lake | 2.83% | 0.36%(+2.48)#43 | 0.058%(+2.78)#280 |
| 44. | Brethren | 2.81% | 0.36%(+2.45)#44 | 0.058%(+2.75)#283 |
| 45. | Bruce Crossing | 2.72% | 0.36%(+2.37)#45 | 0.058%(+2.67)#295 |
| 46. | White Pine | 2.65% | 0.36%(+2.29)#46 | 0.058%(+2.59)#300 |
| 47. | Negaunee | 2.58% | 0.36%(+2.22)#47 | 0.058%(+2.52)#308 |
| 48. | Fowlerville | 2.54% | 0.36%(+2.18)#48 | 0.058%(+2.48)#315 |
| 49. | Mount Pleasant | 2.50% | 0.36%(+2.14)#49 | 0.058%(+2.44)#321 |
| 50. | Akron | 2.42% | 0.36%(+2.07)#50 | 0.058%(+2.37)#326 |
| 51. | Westphalia | 2.42% | 0.36%(+2.06)#51 | 0.058%(+2.36)#327 |
| 52. | Marenisco | 2.41% | 0.36%(+2.05)#52 | 0.058%(+2.35)#328 |
| 53. | Standish | 2.26% | 0.36%(+1.90)#53 | 0.058%(+2.20)#340 |
| 54. | Twining | 2.25% | 0.36%(+1.89)#54 | 0.058%(+2.19)#341 |
| 55. | Portland | 2.18% | 0.36%(+1.82)#55 | 0.058%(+2.12)#355 |
| 56. | Mcbain | 2.14% | 0.36%(+1.78)#56 | 0.058%(+2.08)#356 |
| 57. | Robin Glen Indiantown | 2.05% | 0.36%(+1.69)#57 | 0.058%(+1.99)#369 |
| 58. | Harbor Springs | 2.02% | 0.36%(+1.66)#58 | 0.058%(+1.96)#377 |
| 59. | Rockwood | 2.01% | 0.36%(+1.65)#59 | 0.058%(+1.95)#379 |
| 60. | Rosebush | 1.97% | 0.36%(+1.61)#60 | 0.058%(+1.91)#383 |
| 61. | Rapid River | 1.97% | 0.36%(+1.61)#61 | 0.058%(+1.91)#384 |
| 62. | Wakefield | 1.87% | 0.36%(+1.51)#62 | 0.058%(+1.81)#394 |
| 63. | Morley | 1.85% | 0.36%(+1.49)#63 | 0.058%(+1.79)#397 |
| 64. | Kaleva | 1.85% | 0.36%(+1.49)#64 | 0.058%(+1.79)#398 |
| 65. | Frankfort | 1.81% | 0.36%(+1.45)#65 | 0.058%(+1.75)#404 |
| 66. | Gaylord | 1.76% | 0.36%(+1.40)#66 | 0.058%(+1.70)#414 |
| 67. | Davison | 1.74% | 0.36%(+1.38)#67 | 0.058%(+1.68)#416 |
| 68. | Harvey | 1.71% | 0.36%(+1.35)#68 | 0.058%(+1.65)#421 |
| 69. | Greilickville | 1.70% | 0.36%(+1.35)#69 | 0.058%(+1.65)#424 |
| 70. | Gladstone | 1.70% | 0.36%(+1.34)#70 | 0.058%(+1.64)#425 |
| 71. | Kingsford | 1.68% | 0.36%(+1.32)#71 | 0.058%(+1.62)#428 |
| 72. | Iron River | 1.64% | 0.36%(+1.28)#72 | 0.058%(+1.58)#437 |
| 73. | Cement City | 1.63% | 0.36%(+1.28)#73 | 0.058%(+1.58)#438 |
| 74. | New Buffalo | 1.62% | 0.36%(+1.26)#74 | 0.058%(+1.56)#443 |
| 75. | Indian River | 1.59% | 0.36%(+1.23)#75 | 0.058%(+1.53)#450 |
| 76. | Dansville | 1.51% | 0.36%(+1.15)#76 | 0.058%(+1.45)#468 |
| 77. | Spring Arbor | 1.49% | 0.36%(+1.14)#77 | 0.058%(+1.44)#472 |
| 78. | Marquette | 1.46% | 0.36%(+1.10)#78 | 0.058%(+1.40)#483 |
| 79. | Henderson | 1.39% | 0.36%(+1.03)#79 | 0.058%(+1.33)#501 |
| 80. | Clarksville | 1.39% | 0.36%(+1.03)#80 | 0.058%(+1.33)#502 |
| 81. | Climax | 1.38% | 0.36%(+1.02)#81 | 0.058%(+1.32)#504 |
| 82. | Ishpeming | 1.37% | 0.36%(+1.02)#82 | 0.058%(+1.32)#507 |
| 83. | West Ishpeming | 1.36% | 0.36%(+1.01)#83 | 0.058%(+1.31)#512 |
| 84. | St Johns | 1.35% | 0.36%(+0.991)#84 | 0.058%(+1.29)#521 |
| 85. | Gwinn | 1.31% | 0.36%(+0.956)#85 | 0.058%(+1.26)#529 |
| 86. | Sterling | 1.24% | 0.36%(+0.887)#86 | 0.058%(+1.19)#553 |
| 87. | Weidman | 1.24% | 0.36%(+0.880)#87 | 0.058%(+1.18)#558 |
| 88. | Pellston | 1.19% | 0.36%(+0.828)#88 | 0.058%(+1.13)#577 |
| 89. | Flushing | 1.08% | 0.36%(+0.720)#89 | 0.058%(+1.02)#614 |
| 90. | Kalkaska | 1.05% | 0.36%(+0.696)#90 | 0.058%(+0.996)#622 |
| 91. | Elm Hall | 1.00% | 0.36%(+0.638)#91 | 0.058%(+0.937)#647 |
| 92. | Ewen | 0.99% | 0.36%(+0.633)#92 | 0.058%(+0.932)#650 |
| 93. | Ionia | 0.96% | 0.36%(+0.598)#93 | 0.058%(+0.898)#664 |
| 94. | St Joseph | 0.96% | 0.36%(+0.598)#94 | 0.058%(+0.897)#667 |
| 95. | Vassar | 0.92% | 0.36%(+0.562)#95 | 0.058%(+0.862)#686 |
| 96. | Manistee | 0.88% | 0.36%(+0.523)#96 | 0.058%(+0.823)#699 |
| 97. | Chassell | 0.87% | 0.36%(+0.516)#97 | 0.058%(+0.816)#703 |
| 98. | Saranac | 0.87% | 0.36%(+0.516)#98 | 0.058%(+0.816)#704 |
| 99. | Kent City | 0.87% | 0.36%(+0.513)#99 | 0.058%(+0.812)#707 |
| 100. | West Branch | 0.86% | 0.36%(+0.507)#100 | 0.058%(+0.807)#710 |
Common Questions
What are the Top 10 Cities with the Highest Percentage of Chippewa Population in Michigan?
Top 10 Cities with the Highest Percentage of Chippewa Population in Michigan are:
#1
45.03%
#2
28.12%
#3
17.13%
#4
16.75%
#5
12.61%
#6
11.50%
#7
9.88%
#8
8.55%
#9
7.64%
#10
7.18%
What city has the Highest Percentage of Chippewa Population in Michigan?
Zeba has the Highest Percentage of Chippewa Population in Michigan with 45.03%.
What is the Percentage of Chippewa Population in the State of Michigan?
Percentage of Chippewa Population in Michigan is 0.36%.
What is the Percentage of Chippewa Population in the United States?
Percentage of Chippewa Population in the United States is 0.058%.