Cities with the Highest Percentage of Chippewa Population in Montana
RELATED REPORTS & OPTIONS
Chippewa
Montana
Compare Cities
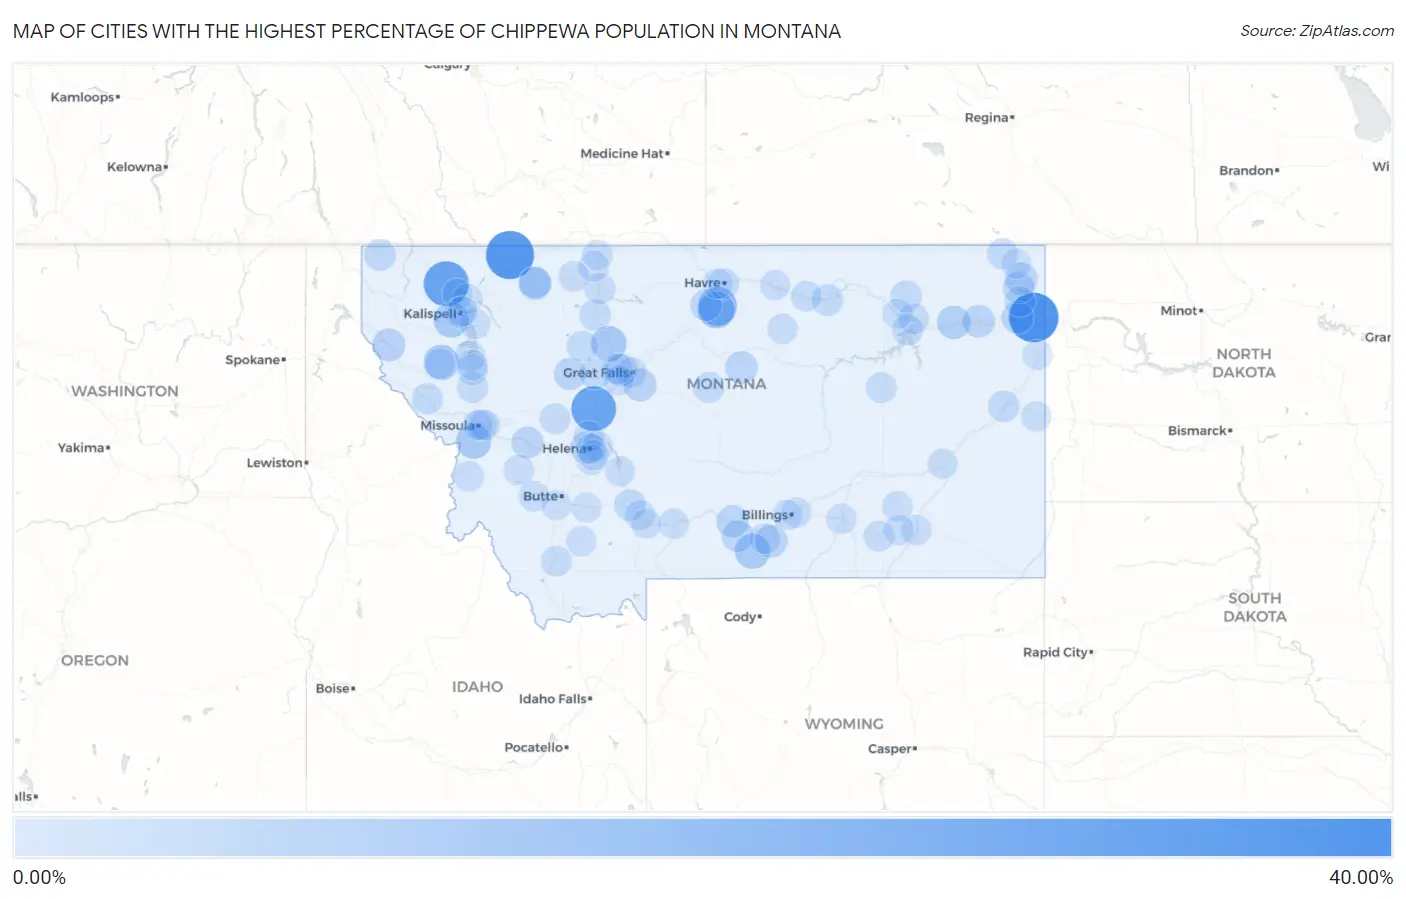
Map of Cities with the Highest Percentage of Chippewa Population in Montana
0.00%
40.00%
Cities with the Highest Percentage of Chippewa Population in Montana
| City | Chippewa | vs State | vs National | |
| 1. | Bainville | 30.72% | 0.44%(+30.3)#1 | 0.058%(+30.7)#52 |
| 2. | Babb | 28.41% | 0.44%(+28.0)#2 | 0.058%(+28.4)#55 |
| 3. | Olney | 23.48% | 0.44%(+23.0)#3 | 0.058%(+23.4)#59 |
| 4. | Craig | 23.08% | 0.44%(+22.6)#4 | 0.058%(+23.0)#60 |
| 5. | Sangrey | 13.37% | 0.44%(+12.9)#5 | 0.058%(+13.3)#75 |
| 6. | St Pierre | 10.19% | 0.44%(+9.74)#6 | 0.058%(+10.1)#94 |
| 7. | Dutton | 8.30% | 0.44%(+7.86)#7 | 0.058%(+8.24)#110 |
| 8. | Camas | 8.11% | 0.44%(+7.67)#8 | 0.058%(+8.05)#113 |
| 9. | Roberts | 7.83% | 0.44%(+7.39)#9 | 0.058%(+7.77)#117 |
| 10. | Carlton | 7.64% | 0.44%(+7.20)#10 | 0.058%(+7.59)#121 |
| 11. | Kila | 7.50% | 0.44%(+7.06)#11 | 0.058%(+7.44)#124 |
| 12. | Wolf Point | 5.20% | 0.44%(+4.76)#12 | 0.058%(+5.14)#162 |
| 13. | Trout Creek | 4.36% | 0.44%(+3.92)#13 | 0.058%(+4.30)#183 |
| 14. | South Browning | 4.05% | 0.44%(+3.61)#14 | 0.058%(+3.99)#197 |
| 15. | Stockett | 4.00% | 0.44%(+3.56)#15 | 0.058%(+3.94)#201 |
| 16. | Edgar | 3.85% | 0.44%(+3.40)#16 | 0.058%(+3.79)#206 |
| 17. | Fishtail | 3.70% | 0.44%(+3.26)#17 | 0.058%(+3.65)#218 |
| 18. | Reserve | 3.70% | 0.44%(+3.26)#18 | 0.058%(+3.65)#219 |
| 19. | Poplar | 3.69% | 0.44%(+3.25)#19 | 0.058%(+3.64)#220 |
| 20. | Winifred | 3.59% | 0.44%(+3.15)#20 | 0.058%(+3.53)#227 |
| 21. | Reed Point | 3.43% | 0.44%(+2.99)#21 | 0.058%(+3.37)#234 |
| 22. | Augusta | 3.26% | 0.44%(+2.81)#22 | 0.058%(+3.20)#245 |
| 23. | Helena West Side | 3.21% | 0.44%(+2.76)#23 | 0.058%(+3.15)#247 |
| 24. | Culbertson | 3.13% | 0.44%(+2.69)#24 | 0.058%(+3.07)#255 |
| 25. | Sun Prairie | 2.93% | 0.44%(+2.49)#25 | 0.058%(+2.87)#272 |
| 26. | Drummond | 2.89% | 0.44%(+2.45)#26 | 0.058%(+2.83)#276 |
| 27. | Browning | 2.76% | 0.44%(+2.31)#27 | 0.058%(+2.70)#290 |
| 28. | Absarokee | 2.65% | 0.44%(+2.20)#28 | 0.058%(+2.59)#301 |
| 29. | Rocky Boy West | 2.56% | 0.44%(+2.12)#29 | 0.058%(+2.50)#312 |
| 30. | Medicine Lake | 2.43% | 0.44%(+1.98)#30 | 0.058%(+2.37)#324 |
| 31. | Yaak | 2.42% | 0.44%(+1.98)#31 | 0.058%(+2.37)#325 |
| 32. | Gallatin River Ranch | 2.19% | 0.44%(+1.74)#32 | 0.058%(+2.13)#353 |
| 33. | St Marie | 2.10% | 0.44%(+1.66)#33 | 0.058%(+2.05)#362 |
| 34. | West Glendive | 2.04% | 0.44%(+1.60)#34 | 0.058%(+1.98)#372 |
| 35. | Malta | 2.03% | 0.44%(+1.59)#35 | 0.058%(+1.97)#375 |
| 36. | Simms | 1.82% | 0.44%(+1.38)#36 | 0.058%(+1.77)#402 |
| 37. | Conrad | 1.82% | 0.44%(+1.38)#37 | 0.058%(+1.76)#403 |
| 38. | Havre | 1.61% | 0.44%(+1.17)#38 | 0.058%(+1.55)#446 |
| 39. | Denton | 1.59% | 0.44%(+1.15)#39 | 0.058%(+1.53)#451 |
| 40. | Choteau | 1.58% | 0.44%(+1.13)#40 | 0.058%(+1.52)#452 |
| 41. | Fort Peck | 1.50% | 0.44%(+1.06)#41 | 0.058%(+1.44)#471 |
| 42. | Superior | 1.49% | 0.44%(+1.05)#42 | 0.058%(+1.43)#473 |
| 43. | Outlook | 1.41% | 0.44%(+0.966)#43 | 0.058%(+1.35)#494 |
| 44. | St Ignatius | 1.18% | 0.44%(+0.735)#44 | 0.058%(+1.12)#580 |
| 45. | Shelby | 1.11% | 0.44%(+0.670)#45 | 0.058%(+1.05)#598 |
| 46. | Dillon | 1.11% | 0.44%(+0.669)#46 | 0.058%(+1.05)#599 |
| 47. | Lincoln | 1.09% | 0.44%(+0.652)#47 | 0.058%(+1.04)#605 |
| 48. | Joliet | 1.09% | 0.44%(+0.646)#48 | 0.058%(+1.03)#609 |
| 49. | Polson | 1.03% | 0.44%(+0.593)#49 | 0.058%(+0.977)#628 |
| 50. | Great Falls | 0.99% | 0.44%(+0.552)#50 | 0.058%(+0.936)#648 |
| 51. | Froid | 0.99% | 0.44%(+0.545)#51 | 0.058%(+0.929)#652 |
| 52. | Nashua | 0.96% | 0.44%(+0.513)#52 | 0.058%(+0.898)#666 |
| 53. | Vaughn | 0.92% | 0.44%(+0.481)#53 | 0.058%(+0.865)#685 |
| 54. | Jordan | 0.92% | 0.44%(+0.475)#54 | 0.058%(+0.860)#687 |
| 55. | East Missoula | 0.90% | 0.44%(+0.460)#55 | 0.058%(+0.845)#692 |
| 56. | Busby | 0.84% | 0.44%(+0.402)#56 | 0.058%(+0.786)#730 |
| 57. | Dodson | 0.84% | 0.44%(+0.398)#57 | 0.058%(+0.783)#733 |
| 58. | Kevin | 0.81% | 0.44%(+0.364)#58 | 0.058%(+0.749)#747 |
| 59. | Ronan | 0.75% | 0.44%(+0.307)#59 | 0.058%(+0.692)#779 |
| 60. | Pablo | 0.72% | 0.44%(+0.280)#60 | 0.058%(+0.665)#804 |
| 61. | Kalispell | 0.72% | 0.44%(+0.280)#61 | 0.058%(+0.665)#805 |
| 62. | Sheridan | 0.69% | 0.44%(+0.250)#62 | 0.058%(+0.634)#830 |
| 63. | Lockwood | 0.69% | 0.44%(+0.248)#63 | 0.058%(+0.632)#831 |
| 64. | Cut Bank | 0.69% | 0.44%(+0.244)#64 | 0.058%(+0.628)#835 |
| 65. | Ulm | 0.65% | 0.44%(+0.211)#65 | 0.058%(+0.595)#872 |
| 66. | Hamilton | 0.65% | 0.44%(+0.203)#66 | 0.058%(+0.587)#884 |
| 67. | Ashland | 0.64% | 0.44%(+0.196)#67 | 0.058%(+0.581)#888 |
| 68. | Bonner West Riverside | 0.62% | 0.44%(+0.182)#68 | 0.058%(+0.567)#903 |
| 69. | Helena Valley Northwest | 0.62% | 0.44%(+0.180)#69 | 0.058%(+0.564)#909 |
| 70. | Anaconda Deer Lodge County | 0.61% | 0.44%(+0.173)#70 | 0.058%(+0.557)#914 |
| 71. | Bigfork | 0.61% | 0.44%(+0.164)#71 | 0.058%(+0.548)#924 |
| 72. | Colstrip | 0.60% | 0.44%(+0.159)#72 | 0.058%(+0.544)#926 |
| 73. | Hays | 0.55% | 0.44%(+0.106)#73 | 0.058%(+0.490)#976 |
| 74. | Philipsburg | 0.55% | 0.44%(+0.105)#74 | 0.058%(+0.489)#977 |
| 75. | Hot Springs | 0.49% | 0.44%(+0.047)#75 | 0.058%(+0.432)#1,031 |
| 76. | Hardin | 0.47% | 0.44%(+0.031)#76 | 0.058%(+0.416)#1,055 |
| 77. | Townsend | 0.41% | 0.44%(-0.029)#77 | 0.058%(+0.356)#1,140 |
| 78. | Lame Deer | 0.39% | 0.44%(-0.055)#78 | 0.058%(+0.330)#1,186 |
| 79. | Helena Valley Southeast | 0.36% | 0.44%(-0.079)#79 | 0.058%(+0.305)#1,225 |
| 80. | Billings | 0.36% | 0.44%(-0.085)#80 | 0.058%(+0.299)#1,236 |
| 81. | Clancy | 0.36% | 0.44%(-0.087)#81 | 0.058%(+0.298)#1,241 |
| 82. | Livingston | 0.34% | 0.44%(-0.101)#82 | 0.058%(+0.284)#1,266 |
| 83. | Montana City | 0.33% | 0.44%(-0.111)#83 | 0.058%(+0.274)#1,291 |
| 84. | Wibaux | 0.31% | 0.44%(-0.130)#84 | 0.058%(+0.255)#1,329 |
| 85. | Miles City | 0.31% | 0.44%(-0.134)#85 | 0.058%(+0.251)#1,339 |
| 86. | Harlem | 0.30% | 0.44%(-0.144)#86 | 0.058%(+0.241)#1,363 |
| 87. | Belgrade | 0.29% | 0.44%(-0.150)#87 | 0.058%(+0.235)#1,373 |
| 88. | Butte Silver Bow Balance | 0.28% | 0.44%(-0.162)#88 | 0.058%(+0.222)#1,396 |
| 89. | Helena | 0.28% | 0.44%(-0.162)#89 | 0.058%(+0.222)#1,397 |
| 90. | Whitehall | 0.27% | 0.44%(-0.176)#90 | 0.058%(+0.208)#1,418 |
| 91. | Beaver Creek | 0.26% | 0.44%(-0.180)#91 | 0.058%(+0.204)#1,429 |
| 92. | Sunburst | 0.26% | 0.44%(-0.187)#92 | 0.058%(+0.197)#1,445 |
| 93. | Glasgow | 0.25% | 0.44%(-0.193)#93 | 0.058%(+0.192)#1,462 |
| 94. | Plentywood | 0.22% | 0.44%(-0.218)#94 | 0.058%(+0.167)#1,542 |
| 95. | Columbia Falls | 0.20% | 0.44%(-0.240)#95 | 0.058%(+0.145)#1,594 |
| 96. | Whitefish | 0.20% | 0.44%(-0.245)#96 | 0.058%(+0.140)#1,606 |
| 97. | Bozeman | 0.16% | 0.44%(-0.283)#97 | 0.058%(+0.101)#1,763 |
| 98. | Missoula | 0.095% | 0.44%(-0.347)#98 | 0.058%(+0.037)#2,030 |
| 99. | Evergreen | 0.059% | 0.44%(-0.383)#99 | 0.058%(+0.001)#2,267 |
| 100. | Sidney | 0.032% | 0.44%(-0.410)#100 | 0.058%(-0.026)#2,515 |
Common Questions
What are the Top 10 Cities with the Highest Percentage of Chippewa Population in Montana?
Top 10 Cities with the Highest Percentage of Chippewa Population in Montana are:
What city has the Highest Percentage of Chippewa Population in Montana?
Bainville has the Highest Percentage of Chippewa Population in Montana with 30.72%.
What is the Percentage of Chippewa Population in the State of Montana?
Percentage of Chippewa Population in Montana is 0.44%.
What is the Percentage of Chippewa Population in the United States?
Percentage of Chippewa Population in the United States is 0.058%.