Cities with the Highest Percentage of Chippewa Population in Illinois
RELATED REPORTS & OPTIONS
Chippewa
Illinois
Compare Cities
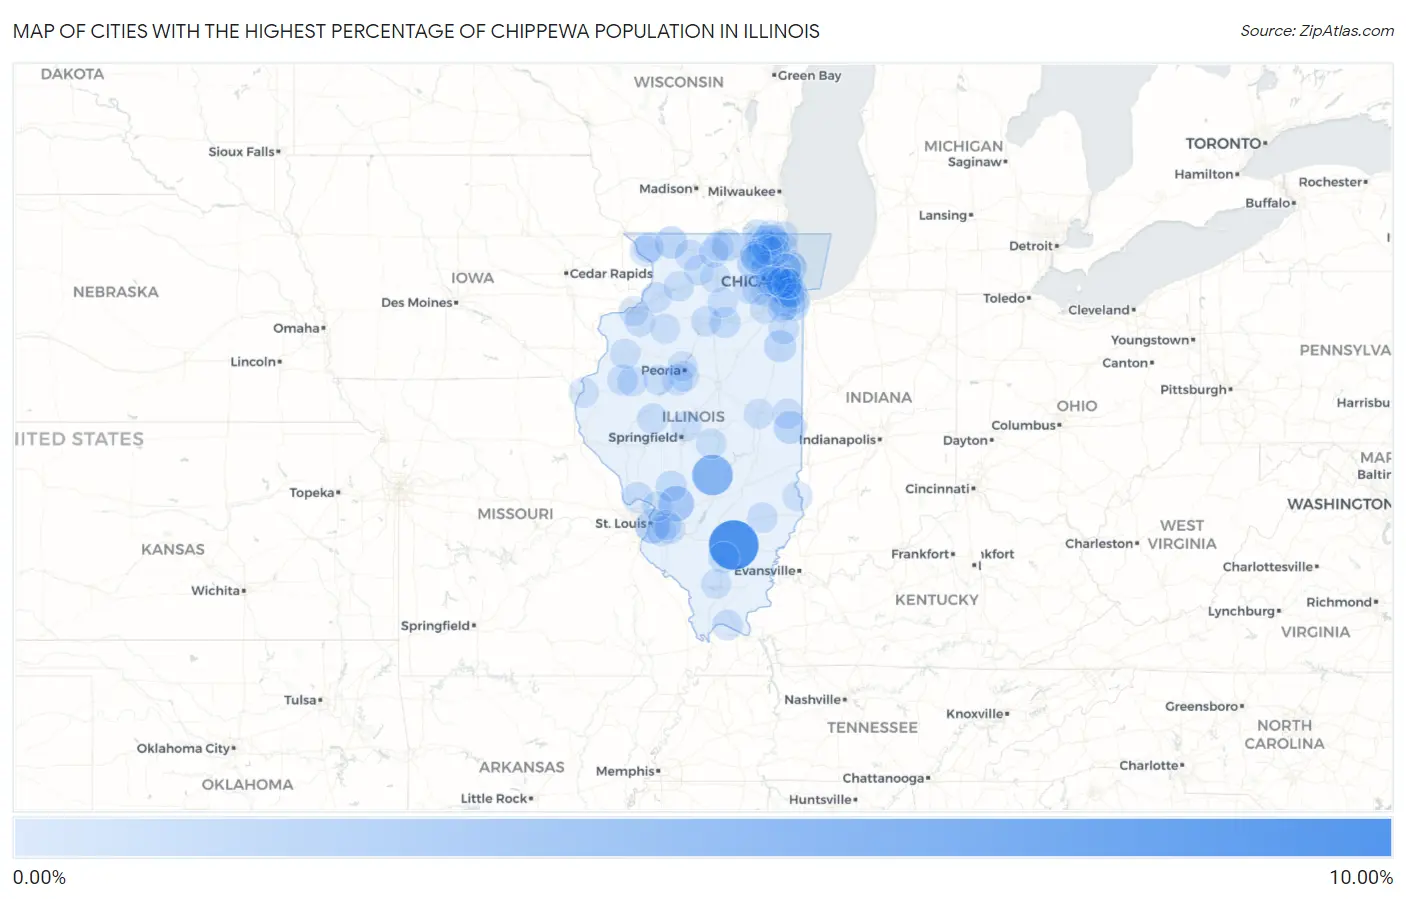
Map of Cities with the Highest Percentage of Chippewa Population in Illinois
0.00%
10.00%
Cities with the Highest Percentage of Chippewa Population in Illinois
| City | Chippewa | vs State | vs National | |
| 1. | Bluford | 8.47% | 0.023%(+8.45)#1 | 0.058%(+8.41)#109 |
| 2. | Oconee | 4.47% | 0.023%(+4.45)#2 | 0.058%(+4.41)#179 |
| 3. | Alhambra | 2.25% | 0.023%(+2.23)#3 | 0.058%(+2.19)#342 |
| 4. | Sauget | 1.85% | 0.023%(+1.83)#4 | 0.058%(+1.79)#396 |
| 5. | Gilberts | 1.28% | 0.023%(+1.26)#5 | 0.058%(+1.23)#540 |
| 6. | Indianola | 1.02% | 0.023%(+0.993)#6 | 0.058%(+0.957)#634 |
| 7. | Lena | 0.89% | 0.023%(+0.867)#7 | 0.058%(+0.832)#696 |
| 8. | Poplar Grove | 0.85% | 0.023%(+0.824)#8 | 0.058%(+0.788)#726 |
| 9. | Chebanse | 0.76% | 0.023%(+0.742)#9 | 0.058%(+0.707)#772 |
| 10. | Dundas | 0.65% | 0.023%(+0.629)#10 | 0.058%(+0.594)#874 |
| 11. | Burbank | 0.64% | 0.023%(+0.620)#11 | 0.058%(+0.584)#886 |
| 12. | Homewood | 0.58% | 0.023%(+0.561)#12 | 0.058%(+0.526)#944 |
| 13. | Ina | 0.46% | 0.023%(+0.434)#13 | 0.058%(+0.398)#1,077 |
| 14. | Richmond | 0.44% | 0.023%(+0.419)#14 | 0.058%(+0.384)#1,098 |
| 15. | Naplate | 0.42% | 0.023%(+0.397)#15 | 0.058%(+0.362)#1,124 |
| 16. | Johnsburg | 0.39% | 0.023%(+0.369)#16 | 0.058%(+0.334)#1,177 |
| 17. | Gillespie | 0.38% | 0.023%(+0.353)#17 | 0.058%(+0.318)#1,205 |
| 18. | Lyons | 0.36% | 0.023%(+0.333)#18 | 0.058%(+0.298)#1,240 |
| 19. | Hanover | 0.35% | 0.023%(+0.331)#19 | 0.058%(+0.296)#1,246 |
| 20. | Grafton | 0.35% | 0.023%(+0.328)#20 | 0.058%(+0.293)#1,253 |
| 21. | Mapleton | 0.33% | 0.023%(+0.312)#21 | 0.058%(+0.277)#1,284 |
| 22. | Chandlerville | 0.33% | 0.023%(+0.308)#22 | 0.058%(+0.273)#1,296 |
| 23. | Joppa | 0.30% | 0.023%(+0.278)#23 | 0.058%(+0.243)#1,356 |
| 24. | Orion | 0.25% | 0.023%(+0.232)#24 | 0.058%(+0.197)#1,446 |
| 25. | Good Hope | 0.24% | 0.023%(+0.218)#25 | 0.058%(+0.183)#1,493 |
| 26. | Wilmette | 0.24% | 0.023%(+0.215)#26 | 0.058%(+0.180)#1,504 |
| 27. | Manteno | 0.23% | 0.023%(+0.209)#27 | 0.058%(+0.174)#1,519 |
| 28. | Fox Lake Hills | 0.21% | 0.023%(+0.186)#28 | 0.058%(+0.151)#1,586 |
| 29. | Williamsville | 0.20% | 0.023%(+0.182)#29 | 0.058%(+0.147)#1,593 |
| 30. | German Valley | 0.20% | 0.023%(+0.179)#30 | 0.058%(+0.143)#1,597 |
| 31. | Scott Afb | 0.20% | 0.023%(+0.176)#31 | 0.058%(+0.141)#1,602 |
| 32. | Marquette Heights | 0.19% | 0.023%(+0.165)#32 | 0.058%(+0.129)#1,641 |
| 33. | Lakemoor | 0.18% | 0.023%(+0.157)#33 | 0.058%(+0.122)#1,667 |
| 34. | Erie | 0.18% | 0.023%(+0.154)#34 | 0.058%(+0.118)#1,682 |
| 35. | Forest Park | 0.17% | 0.023%(+0.147)#35 | 0.058%(+0.112)#1,719 |
| 36. | Oakwood Hills | 0.16% | 0.023%(+0.139)#36 | 0.058%(+0.104)#1,753 |
| 37. | Noble | 0.15% | 0.023%(+0.132)#37 | 0.058%(+0.096)#1,782 |
| 38. | Oakwood | 0.15% | 0.023%(+0.126)#38 | 0.058%(+0.090)#1,806 |
| 39. | Spring Valley | 0.14% | 0.023%(+0.122)#39 | 0.058%(+0.087)#1,825 |
| 40. | Hawthorn Woods | 0.14% | 0.023%(+0.120)#40 | 0.058%(+0.085)#1,834 |
| 41. | Bushnell | 0.14% | 0.023%(+0.118)#41 | 0.058%(+0.083)#1,846 |
| 42. | North Chicago | 0.12% | 0.023%(+0.100)#42 | 0.058%(+0.065)#1,905 |
| 43. | Elizabeth | 0.12% | 0.023%(+0.100)#43 | 0.058%(+0.065)#1,907 |
| 44. | Sterling | 0.12% | 0.023%(+0.099)#44 | 0.058%(+0.063)#1,916 |
| 45. | Canton | 0.12% | 0.023%(+0.097)#45 | 0.058%(+0.062)#1,922 |
| 46. | Riverside | 0.12% | 0.023%(+0.097)#46 | 0.058%(+0.061)#1,925 |
| 47. | Blue Mound | 0.11% | 0.023%(+0.085)#47 | 0.058%(+0.049)#1,981 |
| 48. | Bridgeview | 0.11% | 0.023%(+0.084)#48 | 0.058%(+0.048)#1,985 |
| 49. | Oak Park | 0.10% | 0.023%(+0.080)#49 | 0.058%(+0.044)#2,005 |
| 50. | Oak Brook | 0.099% | 0.023%(+0.077)#50 | 0.058%(+0.041)#2,021 |
| 51. | Evanston | 0.086% | 0.023%(+0.063)#51 | 0.058%(+0.028)#2,080 |
| 52. | Hinsdale | 0.082% | 0.023%(+0.059)#52 | 0.058%(+0.024)#2,107 |
| 53. | Morton Grove | 0.076% | 0.023%(+0.054)#53 | 0.058%(+0.019)#2,137 |
| 54. | Riverdale | 0.076% | 0.023%(+0.053)#54 | 0.058%(+0.018)#2,138 |
| 55. | Oregon | 0.076% | 0.023%(+0.053)#55 | 0.058%(+0.018)#2,142 |
| 56. | La Grange Park | 0.075% | 0.023%(+0.052)#56 | 0.058%(+0.017)#2,145 |
| 57. | Rochelle | 0.074% | 0.023%(+0.052)#57 | 0.058%(+0.017)#2,151 |
| 58. | Palestine | 0.073% | 0.023%(+0.050)#58 | 0.058%(+0.015)#2,172 |
| 59. | Monmouth | 0.068% | 0.023%(+0.046)#59 | 0.058%(+0.011)#2,200 |
| 60. | Orland Park | 0.065% | 0.023%(+0.043)#60 | 0.058%(+0.007)#2,219 |
| 61. | Crystal Lake | 0.062% | 0.023%(+0.039)#61 | 0.058%(+0.004)#2,245 |
| 62. | Naperville | 0.058% | 0.023%(+0.036)#62 | 0.058%(+0.001)#2,269 |
| 63. | Wood Dale | 0.058% | 0.023%(+0.035)#63 | 0.058%(-0.000)#2,284 |
| 64. | Gages Lake | 0.055% | 0.023%(+0.033)#64 | 0.058%(-0.003)#2,297 |
| 65. | Earlville | 0.054% | 0.023%(+0.032)#65 | 0.058%(-0.003)#2,301 |
| 66. | Aurora | 0.052% | 0.023%(+0.029)#66 | 0.058%(-0.006)#2,313 |
| 67. | Addison | 0.050% | 0.023%(+0.028)#67 | 0.058%(-0.007)#2,323 |
| 68. | Niles | 0.049% | 0.023%(+0.026)#68 | 0.058%(-0.009)#2,339 |
| 69. | Belleville | 0.047% | 0.023%(+0.025)#69 | 0.058%(-0.010)#2,349 |
| 70. | O Fallon | 0.047% | 0.023%(+0.024)#70 | 0.058%(-0.011)#2,356 |
| 71. | Streamwood | 0.046% | 0.023%(+0.023)#71 | 0.058%(-0.012)#2,368 |
| 72. | Zion | 0.045% | 0.023%(+0.022)#72 | 0.058%(-0.013)#2,370 |
| 73. | Sugar Grove | 0.043% | 0.023%(+0.021)#73 | 0.058%(-0.015)#2,385 |
| 74. | Lindenhurst | 0.042% | 0.023%(+0.019)#74 | 0.058%(-0.016)#2,393 |
| 75. | Wheaton | 0.041% | 0.023%(+0.018)#75 | 0.058%(-0.017)#2,405 |
| 76. | Tinley Park | 0.040% | 0.023%(+0.017)#76 | 0.058%(-0.018)#2,422 |
| 77. | Villa Park | 0.040% | 0.023%(+0.017)#77 | 0.058%(-0.018)#2,423 |
| 78. | Hamilton | 0.036% | 0.023%(+0.014)#78 | 0.058%(-0.021)#2,461 |
| 79. | Hoffman Estates | 0.035% | 0.023%(+0.012)#79 | 0.058%(-0.023)#2,479 |
| 80. | Oak Lawn | 0.033% | 0.023%(+0.010)#80 | 0.058%(-0.025)#2,498 |
| 81. | Kewanee | 0.033% | 0.023%(+0.010)#81 | 0.058%(-0.025)#2,500 |
| 82. | Herrin | 0.032% | 0.023%(+0.010)#82 | 0.058%(-0.025)#2,504 |
| 83. | Mundelein | 0.028% | 0.023%(+0.006)#83 | 0.058%(-0.029)#2,552 |
| 84. | Wauconda | 0.028% | 0.023%(+0.006)#84 | 0.058%(-0.029)#2,553 |
| 85. | Antioch | 0.027% | 0.023%(+0.005)#85 | 0.058%(-0.031)#2,572 |
| 86. | Rockford | 0.027% | 0.023%(+0.004)#86 | 0.058%(-0.031)#2,575 |
| 87. | Loves Park | 0.026% | 0.023%(+0.004)#87 | 0.058%(-0.032)#2,588 |
| 88. | Chicago | 0.026% | 0.023%(+0.003)#88 | 0.058%(-0.032)#2,596 |
| 89. | Evergreen Park | 0.025% | 0.023%(+0.003)#89 | 0.058%(-0.032)#2,600 |
| 90. | Mokena | 0.025% | 0.023%(+0.003)#90 | 0.058%(-0.033)#2,605 |
| 91. | Glen Ellyn | 0.025% | 0.023%(+0.002)#91 | 0.058%(-0.033)#2,613 |
| 92. | Lake In The Hills | 0.024% | 0.023%(+0.002)#92 | 0.058%(-0.034)#2,620 |
| 93. | Westchester | 0.024% | 0.023%(+0.001)#93 | 0.058%(-0.034)#2,624 |
| 94. | Champaign | 0.024% | 0.023%(+0.001)#94 | 0.058%(-0.034)#2,628 |
| 95. | Moline | 0.024% | 0.023%(+0.001)#95 | 0.058%(-0.034)#2,629 |
| 96. | Berwyn | 0.021% | 0.023%(-0.001)#96 | 0.058%(-0.037)#2,653 |
| 97. | Peoria | 0.020% | 0.023%(-0.002)#97 | 0.058%(-0.037)#2,664 |
| 98. | Wood River | 0.019% | 0.023%(-0.003)#98 | 0.058%(-0.038)#2,679 |
| 99. | Joliet | 0.018% | 0.023%(-0.005)#99 | 0.058%(-0.040)#2,698 |
| 100. | Algonquin | 0.017% | 0.023%(-0.006)#100 | 0.058%(-0.041)#2,727 |
Common Questions
What are the Top 10 Cities with the Highest Percentage of Chippewa Population in Illinois?
Top 10 Cities with the Highest Percentage of Chippewa Population in Illinois are:
What city has the Highest Percentage of Chippewa Population in Illinois?
Bluford has the Highest Percentage of Chippewa Population in Illinois with 8.47%.
What is the Percentage of Chippewa Population in the State of Illinois?
Percentage of Chippewa Population in Illinois is 0.023%.
What is the Percentage of Chippewa Population in the United States?
Percentage of Chippewa Population in the United States is 0.058%.