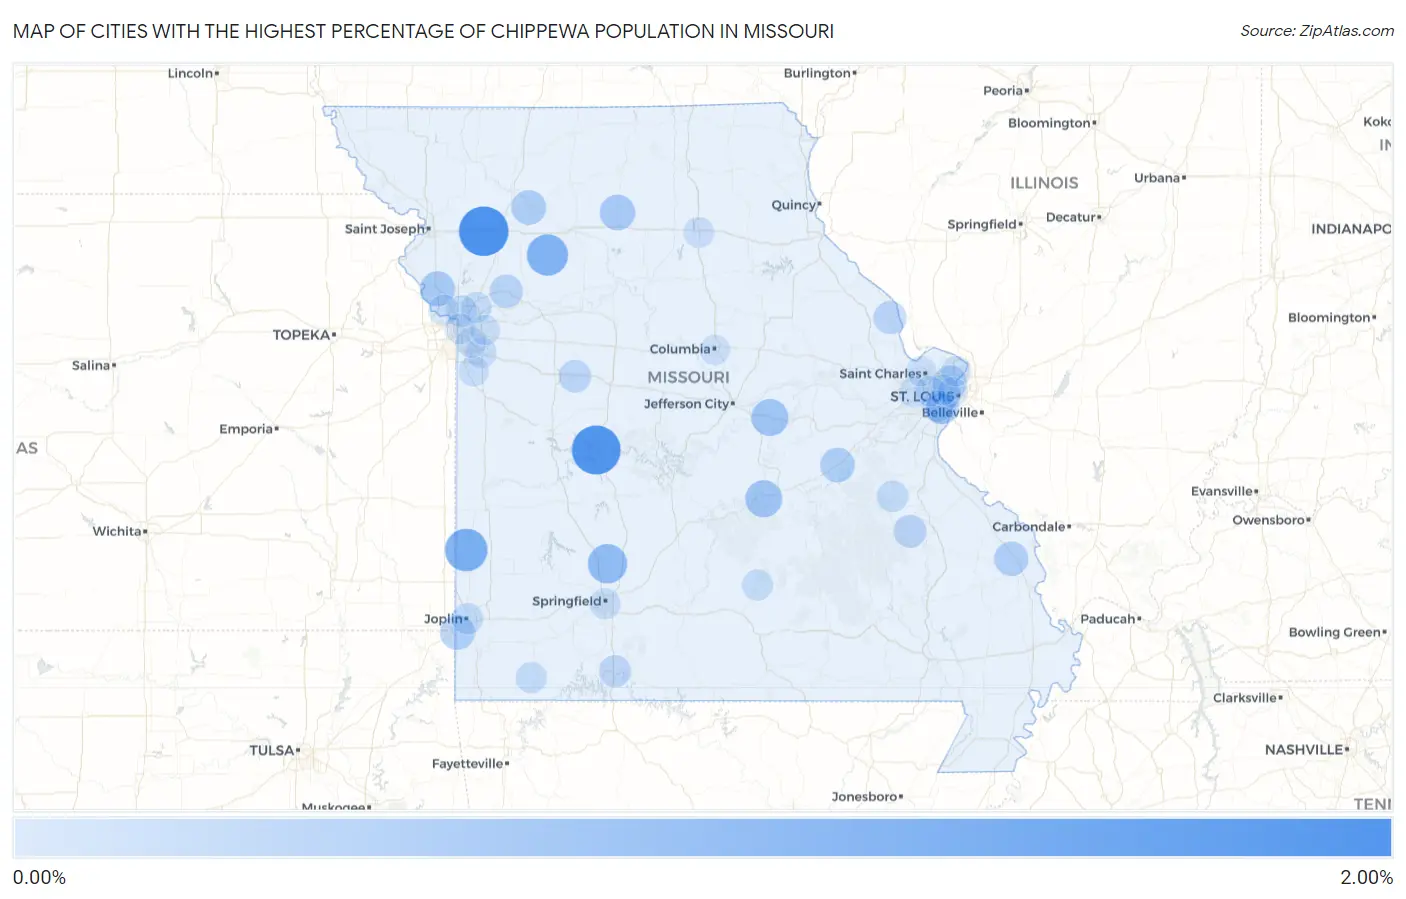
Cities with the Highest Percentage of Chippewa Population in Missouri
RELATED REPORTS & OPTIONS
Chippewa
Missouri
Compare Cities
Map of Cities with the Highest Percentage of Chippewa Population in Missouri
0.00%
2.00%
Cities with the Highest Percentage of Chippewa Population in Missouri
| City | Chippewa | vs State | vs National | |
| 1. | Osborn | 1.80% | 0.018%(+1.78)#1 | 0.058%(+1.74)#407 |
| 2. | Warsaw | 1.72% | 0.018%(+1.70)#2 | 0.058%(+1.66)#419 |
| 3. | Liberal | 1.13% | 0.018%(+1.12)#3 | 0.058%(+1.08)#590 |
| 4. | Braymer | 1.01% | 0.018%(+0.995)#4 | 0.058%(+0.955)#636 |
| 5. | Pleasant Hope | 0.83% | 0.018%(+0.809)#5 | 0.058%(+0.769)#737 |
| 6. | Newburg | 0.61% | 0.018%(+0.590)#6 | 0.058%(+0.550)#921 |
| 7. | Linn | 0.61% | 0.018%(+0.589)#7 | 0.058%(+0.549)#923 |
| 8. | Linneus | 0.48% | 0.018%(+0.465)#8 | 0.058%(+0.425)#1,042 |
| 9. | Platte City | 0.44% | 0.018%(+0.421)#9 | 0.058%(+0.381)#1,100 |
| 10. | Loma Linda | 0.41% | 0.018%(+0.388)#10 | 0.058%(+0.348)#1,153 |
| 11. | Gallatin | 0.40% | 0.018%(+0.383)#11 | 0.058%(+0.343)#1,158 |
| 12. | Bourbon | 0.40% | 0.018%(+0.380)#12 | 0.058%(+0.340)#1,164 |
| 13. | Oak Ridge | 0.36% | 0.018%(+0.341)#13 | 0.058%(+0.301)#1,232 |
| 14. | Jennings | 0.33% | 0.018%(+0.313)#14 | 0.058%(+0.273)#1,292 |
| 15. | Wood Heights | 0.28% | 0.018%(+0.266)#15 | 0.058%(+0.226)#1,386 |
| 16. | Affton | 0.28% | 0.018%(+0.263)#16 | 0.058%(+0.223)#1,393 |
| 17. | Elsberry | 0.25% | 0.018%(+0.235)#17 | 0.058%(+0.195)#1,449 |
| 18. | Iron Mountain Lake | 0.25% | 0.018%(+0.230)#18 | 0.058%(+0.190)#1,465 |
| 19. | Knob Noster | 0.21% | 0.018%(+0.197)#19 | 0.058%(+0.157)#1,566 |
| 20. | Bull Creek | 0.18% | 0.018%(+0.158)#20 | 0.058%(+0.119)#1,679 |
| 21. | Potosi | 0.12% | 0.018%(+0.099)#21 | 0.058%(+0.059)#1,938 |
| 22. | Joplin | 0.12% | 0.018%(+0.098)#22 | 0.058%(+0.058)#1,944 |
| 23. | Crestwood | 0.11% | 0.018%(+0.096)#23 | 0.058%(+0.056)#1,956 |
| 24. | Exeter | 0.11% | 0.018%(+0.088)#24 | 0.058%(+0.048)#1,989 |
| 25. | Gladstone | 0.085% | 0.018%(+0.067)#25 | 0.058%(+0.028)#2,082 |
| 26. | Houston | 0.083% | 0.018%(+0.065)#26 | 0.058%(+0.025)#2,096 |
| 27. | Liberty | 0.083% | 0.018%(+0.065)#27 | 0.058%(+0.025)#2,100 |
| 28. | Springfield | 0.071% | 0.018%(+0.053)#28 | 0.058%(+0.013)#2,181 |
| 29. | Lakeshire | 0.070% | 0.018%(+0.052)#29 | 0.058%(+0.013)#2,187 |
| 30. | Lee S Summit | 0.059% | 0.018%(+0.041)#30 | 0.058%(+0.001)#2,264 |
| 31. | Parkville | 0.039% | 0.018%(+0.021)#31 | 0.058%(-0.019)#2,431 |
| 32. | Macon | 0.037% | 0.018%(+0.019)#32 | 0.058%(-0.021)#2,458 |
| 33. | University City | 0.034% | 0.018%(+0.017)#33 | 0.058%(-0.023)#2,482 |
| 34. | Kansas City | 0.024% | 0.018%(+0.006)#34 | 0.058%(-0.034)#2,626 |
| 35. | Raymore | 0.022% | 0.018%(+0.004)#35 | 0.058%(-0.036)#2,649 |
| 36. | Creve Coeur | 0.021% | 0.018%(+0.004)#36 | 0.058%(-0.036)#2,652 |
| 37. | St Louis | 0.020% | 0.018%(+0.003)#37 | 0.058%(-0.037)#2,662 |
| 38. | Raytown | 0.013% | 0.018%(-0.004)#38 | 0.058%(-0.044)#2,785 |
| 39. | Spanish Lake | 0.011% | 0.018%(-0.007)#39 | 0.058%(-0.047)#2,833 |
| 40. | Columbia | 0.010% | 0.018%(-0.008)#40 | 0.058%(-0.047)#2,844 |
| 41. | Chesterfield | 0.010% | 0.018%(-0.008)#41 | 0.058%(-0.048)#2,849 |
| 42. | Independence | 0.0065% | 0.018%(-0.011)#42 | 0.058%(-0.051)#2,929 |
| 43. | St Charles | 0.0057% | 0.018%(-0.012)#43 | 0.058%(-0.052)#2,944 |
Common Questions
What are the Top 10 Cities with the Highest Percentage of Chippewa Population in Missouri?
Top 10 Cities with the Highest Percentage of Chippewa Population in Missouri are:
#1
1.80%
#2
1.72%
#3
1.13%
#4
1.01%
#5
0.83%
#6
0.61%
#7
0.61%
#8
0.48%
#9
0.44%
#10
0.41%
What city has the Highest Percentage of Chippewa Population in Missouri?
Osborn has the Highest Percentage of Chippewa Population in Missouri with 1.80%.
What is the Percentage of Chippewa Population in the State of Missouri?
Percentage of Chippewa Population in Missouri is 0.018%.
What is the Percentage of Chippewa Population in the United States?
Percentage of Chippewa Population in the United States is 0.058%.