Cities with the Highest Percentage of Chippewa Population in Texas
RELATED REPORTS & OPTIONS
Chippewa
Texas
Compare Cities
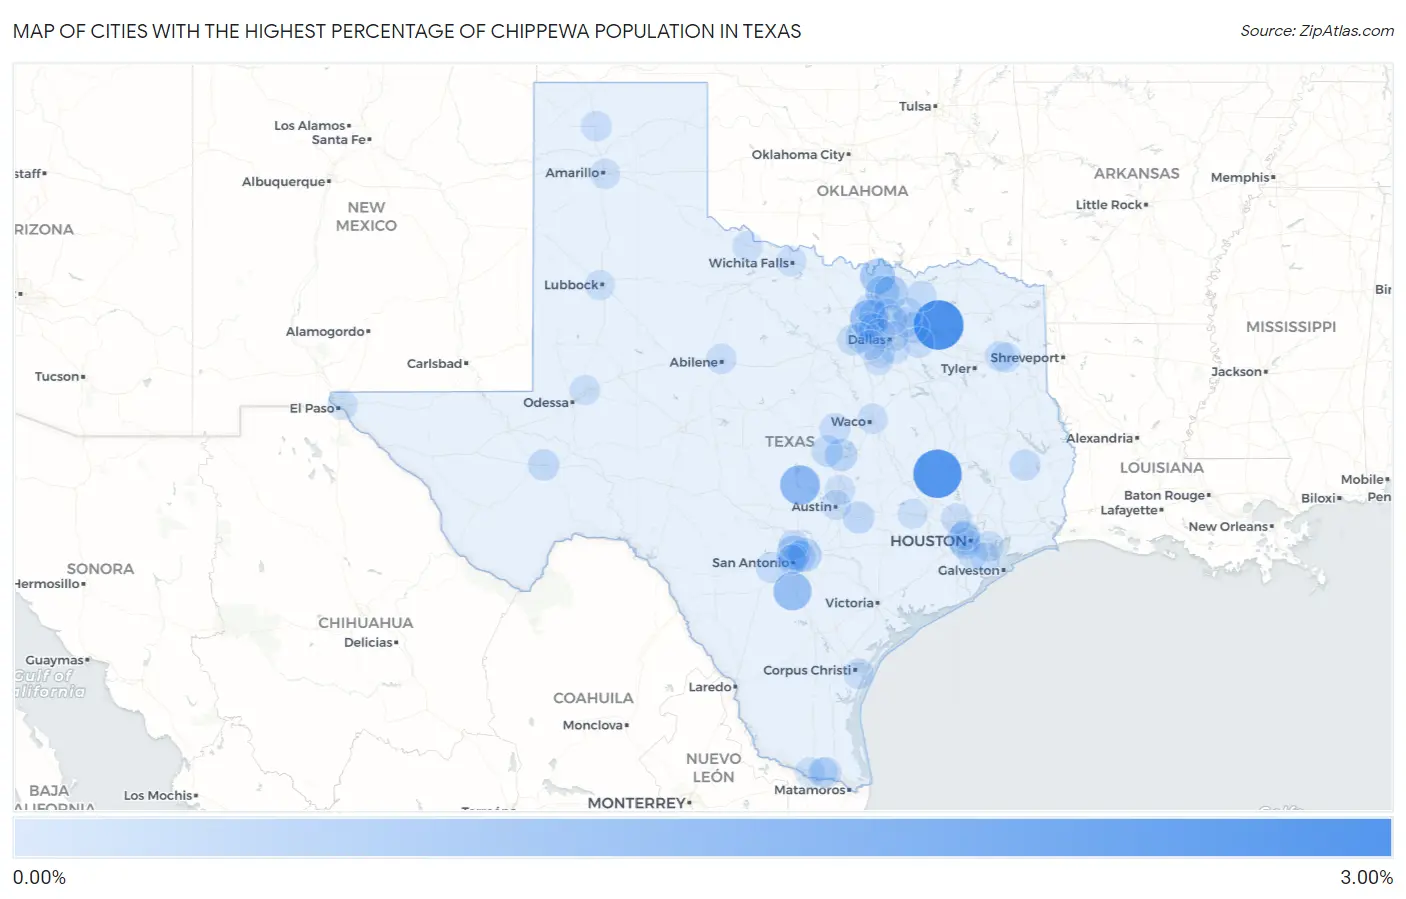
Map of Cities with the Highest Percentage of Chippewa Population in Texas
0.00%
3.00%
Cities with the Highest Percentage of Chippewa Population in Texas
| City | Chippewa | vs State | vs National | |
| 1. | Lone Oak | 2.67% | 0.0090%(+2.66)#1 | 0.058%(+2.61)#296 |
| 2. | Bedias | 2.50% | 0.0090%(+2.49)#2 | 0.058%(+2.44)#317 |
| 3. | Granite Shoals | 1.28% | 0.0090%(+1.27)#3 | 0.058%(+1.22)#542 |
| 4. | Pleasanton | 1.07% | 0.0090%(+1.07)#4 | 0.058%(+1.02)#618 |
| 5. | Bartonville | 0.97% | 0.0090%(+0.962)#5 | 0.058%(+0.913)#655 |
| 6. | Callisburg | 0.66% | 0.0090%(+0.653)#6 | 0.058%(+0.604)#861 |
| 7. | Hill Country Village | 0.50% | 0.0090%(+0.490)#7 | 0.058%(+0.441)#1,022 |
| 8. | Tioga | 0.46% | 0.0090%(+0.452)#8 | 0.058%(+0.403)#1,071 |
| 9. | Gunter | 0.44% | 0.0090%(+0.430)#9 | 0.058%(+0.381)#1,102 |
| 10. | Randolph Afb | 0.42% | 0.0090%(+0.409)#10 | 0.058%(+0.361)#1,125 |
| 11. | Hilshire Village | 0.36% | 0.0090%(+0.355)#11 | 0.058%(+0.306)#1,224 |
| 12. | Harker Heights | 0.30% | 0.0090%(+0.291)#12 | 0.058%(+0.242)#1,360 |
| 13. | Bastrop | 0.22% | 0.0090%(+0.212)#13 | 0.058%(+0.163)#1,551 |
| 14. | Windcrest | 0.17% | 0.0090%(+0.163)#14 | 0.058%(+0.114)#1,705 |
| 15. | Fort Stockton | 0.17% | 0.0090%(+0.158)#15 | 0.058%(+0.109)#1,733 |
| 16. | Copperas Cove | 0.16% | 0.0090%(+0.150)#16 | 0.058%(+0.101)#1,761 |
| 17. | Colmesneil | 0.14% | 0.0090%(+0.128)#17 | 0.058%(+0.080)#1,859 |
| 18. | Fate | 0.13% | 0.0090%(+0.123)#18 | 0.058%(+0.074)#1,879 |
| 19. | Leonard | 0.12% | 0.0090%(+0.113)#19 | 0.058%(+0.064)#1,914 |
| 20. | White Settlement | 0.10% | 0.0090%(+0.096)#20 | 0.058%(+0.047)#1,994 |
| 21. | Gatesville | 0.10% | 0.0090%(+0.092)#21 | 0.058%(+0.043)#2,009 |
| 22. | Castroville | 0.10% | 0.0090%(+0.091)#22 | 0.058%(+0.042)#2,012 |
| 23. | Terrell | 0.089% | 0.0090%(+0.080)#23 | 0.058%(+0.031)#2,055 |
| 24. | Bellaire | 0.082% | 0.0090%(+0.073)#24 | 0.058%(+0.024)#2,105 |
| 25. | Mercedes | 0.073% | 0.0090%(+0.064)#25 | 0.058%(+0.016)#2,159 |
| 26. | Tomball | 0.063% | 0.0090%(+0.054)#26 | 0.058%(+0.006)#2,234 |
| 27. | Dumas | 0.062% | 0.0090%(+0.053)#27 | 0.058%(+0.005)#2,240 |
| 28. | Abilene | 0.051% | 0.0090%(+0.042)#28 | 0.058%(-0.007)#2,322 |
| 29. | Corinth | 0.040% | 0.0090%(+0.031)#29 | 0.058%(-0.018)#2,416 |
| 30. | Bellmead | 0.038% | 0.0090%(+0.029)#30 | 0.058%(-0.020)#2,444 |
| 31. | Timberwood Park | 0.035% | 0.0090%(+0.026)#31 | 0.058%(-0.023)#2,478 |
| 32. | Pearland | 0.033% | 0.0090%(+0.024)#32 | 0.058%(-0.025)#2,499 |
| 33. | White Oak | 0.032% | 0.0090%(+0.023)#33 | 0.058%(-0.026)#2,512 |
| 34. | La Porte | 0.031% | 0.0090%(+0.022)#34 | 0.058%(-0.027)#2,532 |
| 35. | Corpus Christi | 0.029% | 0.0090%(+0.020)#35 | 0.058%(-0.029)#2,546 |
| 36. | Southlake | 0.029% | 0.0090%(+0.020)#36 | 0.058%(-0.029)#2,547 |
| 37. | Wichita Falls | 0.022% | 0.0090%(+0.013)#37 | 0.058%(-0.035)#2,639 |
| 38. | Frisco | 0.020% | 0.0090%(+0.011)#38 | 0.058%(-0.037)#2,667 |
| 39. | Wylie | 0.019% | 0.0090%(+0.010)#39 | 0.058%(-0.038)#2,680 |
| 40. | Hutchins | 0.018% | 0.0090%(+0.009)#40 | 0.058%(-0.040)#2,706 |
| 41. | Brenham | 0.017% | 0.0090%(+0.008)#41 | 0.058%(-0.041)#2,723 |
| 42. | Round Rock | 0.017% | 0.0090%(+0.008)#42 | 0.058%(-0.041)#2,729 |
| 43. | Princeton | 0.016% | 0.0090%(+0.007)#43 | 0.058%(-0.042)#2,738 |
| 44. | San Antonio | 0.015% | 0.0090%(+0.006)#44 | 0.058%(-0.043)#2,754 |
| 45. | Alamo Heights | 0.013% | 0.0090%(+0.004)#45 | 0.058%(-0.044)#2,784 |
| 46. | Houston | 0.012% | 0.0090%(+0.003)#46 | 0.058%(-0.045)#2,799 |
| 47. | El Paso | 0.012% | 0.0090%(+0.003)#47 | 0.058%(-0.046)#2,810 |
| 48. | Grapevine | 0.012% | 0.0090%(+0.003)#48 | 0.058%(-0.046)#2,815 |
| 49. | Cedar Hill | 0.010% | 0.0090%(+0.001)#49 | 0.058%(-0.048)#2,845 |
| 50. | Vernon | 0.0100% | 0.0090%(+0.001)#50 | 0.058%(-0.048)#2,853 |
| 51. | Austin | 0.0094% | 0.0090%(+0.000)#51 | 0.058%(-0.048)#2,869 |
| 52. | Lubbock | 0.0093% | 0.0090%(+0.000)#52 | 0.058%(-0.048)#2,871 |
| 53. | Midlothian | 0.0085% | 0.0090%(-0.001)#53 | 0.058%(-0.049)#2,886 |
| 54. | Midland | 0.0075% | 0.0090%(-0.001)#54 | 0.058%(-0.050)#2,909 |
| 55. | Denton | 0.0070% | 0.0090%(-0.002)#55 | 0.058%(-0.051)#2,917 |
| 56. | Dallas | 0.0068% | 0.0090%(-0.002)#56 | 0.058%(-0.051)#2,923 |
| 57. | Plano | 0.0067% | 0.0090%(-0.002)#57 | 0.058%(-0.051)#2,926 |
| 58. | Pharr | 0.0063% | 0.0090%(-0.003)#58 | 0.058%(-0.051)#2,936 |
| 59. | Fort Worth | 0.0050% | 0.0090%(-0.004)#59 | 0.058%(-0.053)#2,955 |
| 60. | Amarillo | 0.0045% | 0.0090%(-0.005)#60 | 0.058%(-0.053)#2,959 |
| 61. | League City | 0.0044% | 0.0090%(-0.005)#61 | 0.058%(-0.053)#2,960 |
| 62. | Weslaco | 0.0024% | 0.0090%(-0.007)#62 | 0.058%(-0.055)#2,993 |
| 63. | Longview | 0.0024% | 0.0090%(-0.007)#63 | 0.058%(-0.055)#2,994 |
| 64. | Irving | 0.0024% | 0.0090%(-0.007)#64 | 0.058%(-0.055)#2,995 |
| 65. | Arlington | 0.0020% | 0.0090%(-0.007)#65 | 0.058%(-0.056)#2,999 |
Common Questions
What are the Top 10 Cities with the Highest Percentage of Chippewa Population in Texas?
Top 10 Cities with the Highest Percentage of Chippewa Population in Texas are:
#1
2.67%
#2
2.50%
#3
1.28%
#4
1.07%
#5
0.97%
#6
0.66%
#7
0.50%
#8
0.46%
#9
0.44%
#10
0.42%
What city has the Highest Percentage of Chippewa Population in Texas?
Lone Oak has the Highest Percentage of Chippewa Population in Texas with 2.67%.
What is the Percentage of Chippewa Population in the State of Texas?
Percentage of Chippewa Population in Texas is 0.0090%.
What is the Percentage of Chippewa Population in the United States?
Percentage of Chippewa Population in the United States is 0.058%.