Cedar Ridge, CA Map & Demographics
Cedar Ridge Map
Cedar Ridge Overview
$39,037
PER CAPITA INCOME
$99,643
AVG FAMILY INCOME
$73,750
AVG HOUSEHOLD INCOME
23.0%
WAGE / INCOME GAP [ % ]
77.0¢/ $1
WAGE / INCOME GAP [ $ ]
0.41
INEQUALITY / GINI INDEX
1,650
TOTAL POPULATION
855
MALE POPULATION
795
FEMALE POPULATION
107.55
MALES / 100 FEMALES
92.98
FEMALES / 100 MALES
47.6
MEDIAN AGE
2.9
AVG FAMILY SIZE
2.5
AVG HOUSEHOLD SIZE
742
LABOR FORCE [ PEOPLE ]
57.0%
PERCENT IN LABOR FORCE
6.4%
UNEMPLOYMENT RATE
Cedar Ridge Area Codes
Income in Cedar Ridge
Income Overview in Cedar Ridge
Per Capita Income in Cedar Ridge is $39,037, while median incomes of families and households are $99,643 and $73,750 respectively.
| Characteristic | Number | Measure |
| Per Capita Income | 1,650 | $39,037 |
| Median Family Income | 462 | $99,643 |
| Mean Family Income | 462 | $119,514 |
| Median Household Income | 672 | $73,750 |
| Mean Household Income | 672 | $98,842 |
| Income Deficit | 462 | $0 |
| Wage / Income Gap (%) | 1,650 | 22.98% |
| Wage / Income Gap ($) | 1,650 | 77.02¢ per $1 |
| Gini / Inequality Index | 1,650 | 0.41 |
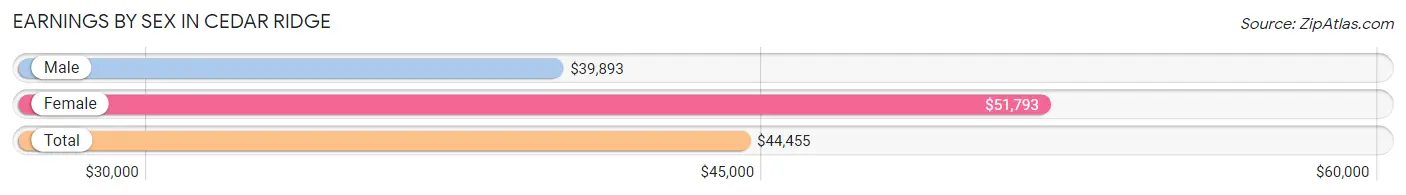
Earnings by Sex in Cedar Ridge
Average Earnings in Cedar Ridge are $44,455, $39,893 for men and $51,793 for women, a difference of 23.0%.
| Sex | Number | Average Earnings |
| Male | 415 (54.5%) | $39,893 |
| Female | 347 (45.5%) | $51,793 |
| Total | 762 (100.0%) | $44,455 |
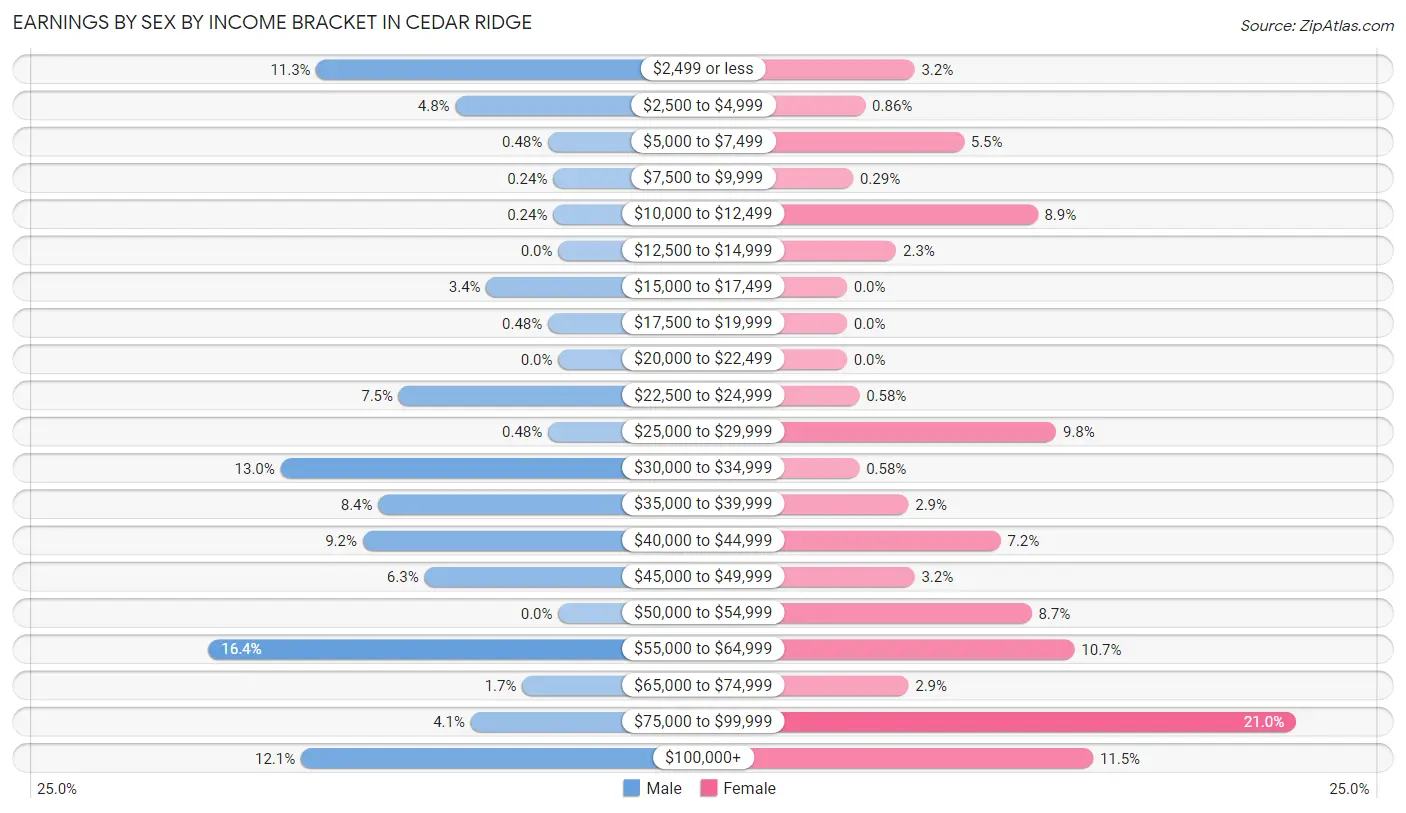
Earnings by Sex by Income Bracket in Cedar Ridge
The most common earnings brackets in Cedar Ridge are $55,000 to $64,999 for men (68 | 16.4%) and $75,000 to $99,999 for women (73 | 21.0%).
| Income | Male | Female |
| $2,499 or less | 47 (11.3%) | 11 (3.2%) |
| $2,500 to $4,999 | 20 (4.8%) | 3 (0.9%) |
| $5,000 to $7,499 | 2 (0.5%) | 19 (5.5%) |
| $7,500 to $9,999 | 1 (0.2%) | 1 (0.3%) |
| $10,000 to $12,499 | 1 (0.2%) | 31 (8.9%) |
| $12,500 to $14,999 | 0 (0.0%) | 8 (2.3%) |
| $15,000 to $17,499 | 14 (3.4%) | 0 (0.0%) |
| $17,500 to $19,999 | 2 (0.5%) | 0 (0.0%) |
| $20,000 to $22,499 | 0 (0.0%) | 0 (0.0%) |
| $22,500 to $24,999 | 31 (7.5%) | 2 (0.6%) |
| $25,000 to $29,999 | 2 (0.5%) | 34 (9.8%) |
| $30,000 to $34,999 | 54 (13.0%) | 2 (0.6%) |
| $35,000 to $39,999 | 35 (8.4%) | 10 (2.9%) |
| $40,000 to $44,999 | 38 (9.2%) | 25 (7.2%) |
| $45,000 to $49,999 | 26 (6.3%) | 11 (3.2%) |
| $50,000 to $54,999 | 0 (0.0%) | 30 (8.6%) |
| $55,000 to $64,999 | 68 (16.4%) | 37 (10.7%) |
| $65,000 to $74,999 | 7 (1.7%) | 10 (2.9%) |
| $75,000 to $99,999 | 17 (4.1%) | 73 (21.0%) |
| $100,000+ | 50 (12.0%) | 40 (11.5%) |
| Total | 415 (100.0%) | 347 (100.0%) |
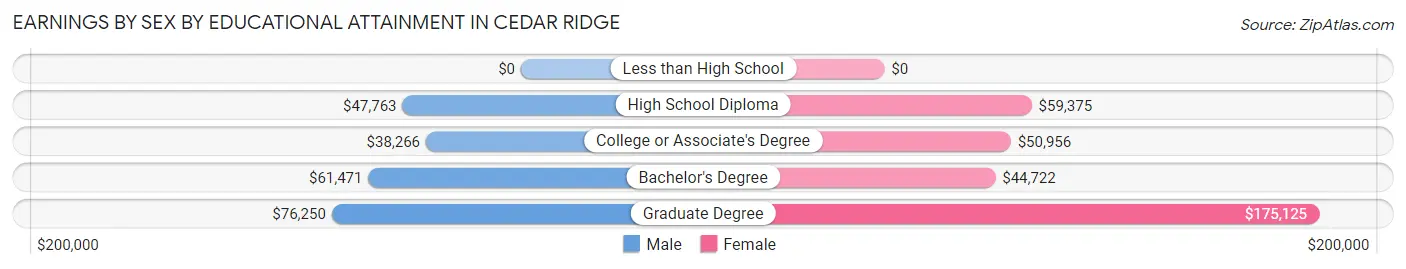
Earnings by Sex by Educational Attainment in Cedar Ridge
Average earnings in Cedar Ridge are $43,182 for men and $52,679 for women, a difference of 18.0%. Men with an educational attainment of graduate degree enjoy the highest average annual earnings of $76,250, while those with college or associate's degree education earn the least with $38,266. Women with an educational attainment of graduate degree earn the most with the average annual earnings of $175,125, while those with bachelor's degree education have the smallest earnings of $44,722.
| Educational Attainment | Male Income | Female Income |
| Less than High School | - | - |
| High School Diploma | $47,763 | $59,375 |
| College or Associate's Degree | $38,266 | $50,956 |
| Bachelor's Degree | $61,471 | $44,722 |
| Graduate Degree | $76,250 | $175,125 |
| Total | $43,182 | $52,679 |
Family Income in Cedar Ridge
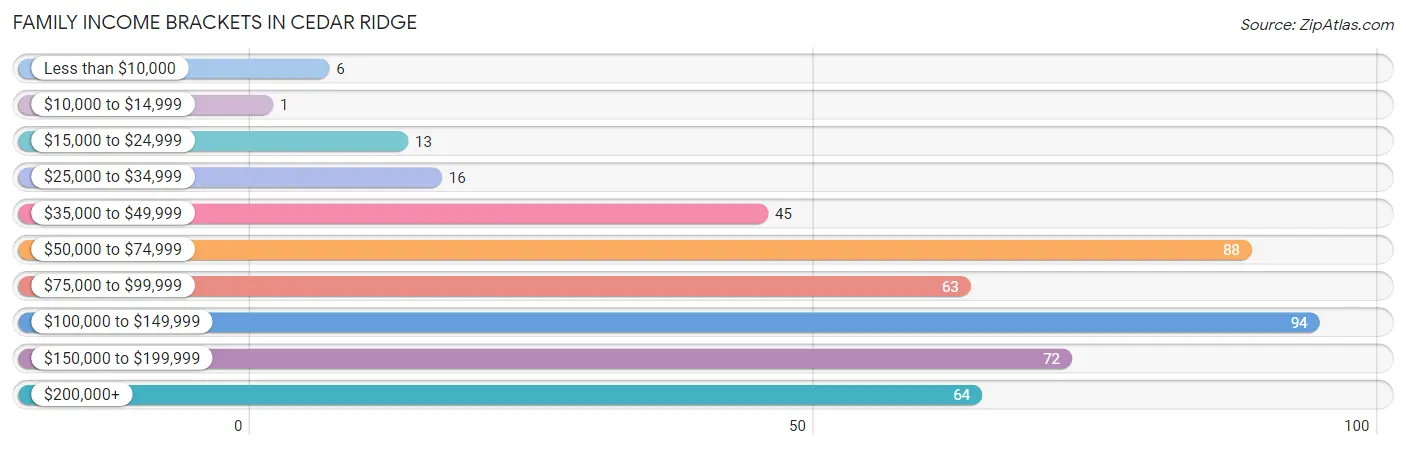
Family Income Brackets in Cedar Ridge
According to the Cedar Ridge family income data, there are 94 families falling into the $100,000 to $149,999 income range, which is the most common income bracket and makes up 20.3% of all families. Conversely, the $10,000 to $14,999 income bracket is the least frequent group with only 1 families (0.2%) belonging to this category.
| Income Bracket | # Families | % Families |
| Less than $10,000 | 6 | 1.3% |
| $10,000 to $14,999 | 1 | 0.2% |
| $15,000 to $24,999 | 13 | 2.8% |
| $25,000 to $34,999 | 16 | 3.5% |
| $35,000 to $49,999 | 45 | 9.7% |
| $50,000 to $74,999 | 88 | 19.0% |
| $75,000 to $99,999 | 63 | 13.6% |
| $100,000 to $149,999 | 94 | 20.3% |
| $150,000 to $199,999 | 72 | 15.6% |
| $200,000+ | 64 | 13.9% |
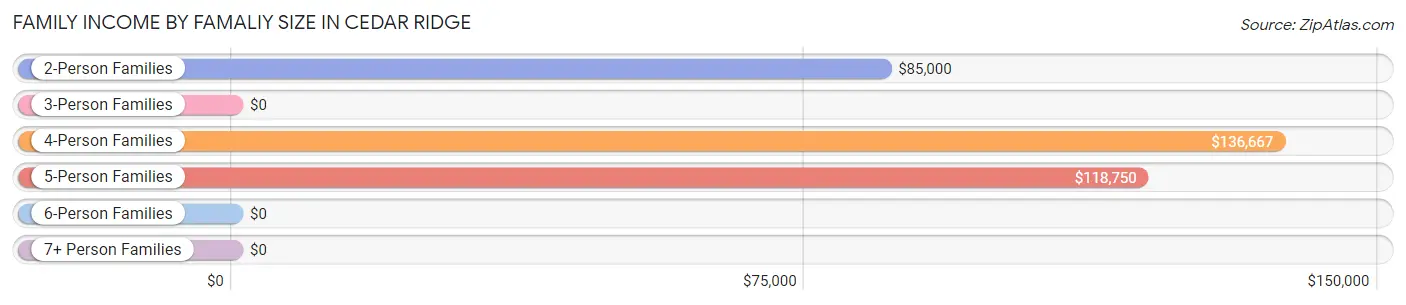
Family Income by Famaliy Size in Cedar Ridge
4-person families (74 | 16.0%) account for the highest median family income in Cedar Ridge with $136,667 per family, while 2-person families (264 | 57.1%) have the highest median income of $42,500 per family member.
| Income Bracket | # Families | Median Income |
| 2-Person Families | 264 (57.1%) | $85,000 |
| 3-Person Families | 47 (10.2%) | $0 |
| 4-Person Families | 74 (16.0%) | $136,667 |
| 5-Person Families | 71 (15.4%) | $118,750 |
| 6-Person Families | 6 (1.3%) | $0 |
| 7+ Person Families | 0 (0.0%) | $0 |
| Total | 462 (100.0%) | $99,643 |
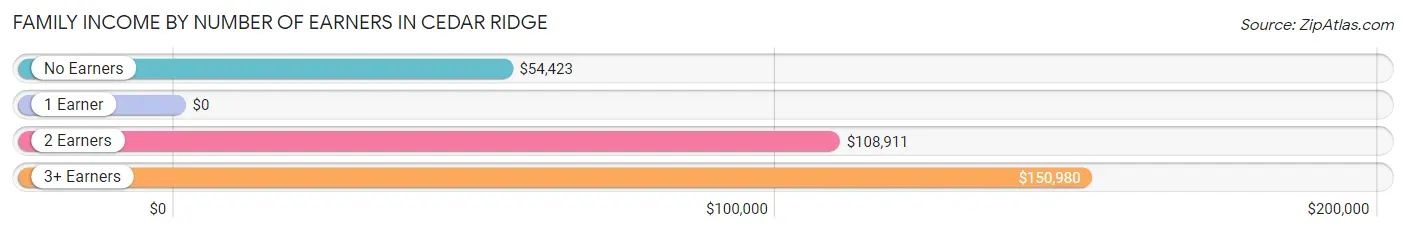
Family Income by Number of Earners in Cedar Ridge
| Number of Earners | # Families | Median Income |
| No Earners | 124 (26.8%) | $54,423 |
| 1 Earner | 100 (21.6%) | $0 |
| 2 Earners | 183 (39.6%) | $108,911 |
| 3+ Earners | 55 (11.9%) | $150,980 |
| Total | 462 (100.0%) | $99,643 |
Household Income in Cedar Ridge
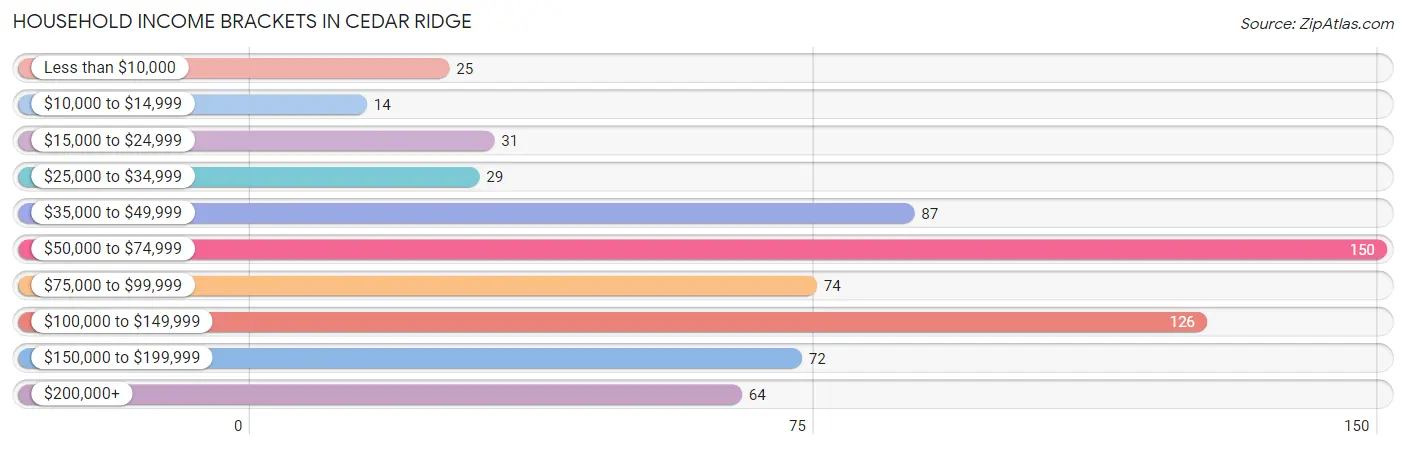
Household Income Brackets in Cedar Ridge
With 150 households falling in the category, the $50,000 to $74,999 income range is the most frequent in Cedar Ridge, accounting for 22.3% of all households. In contrast, only 14 households (2.1%) fall into the $10,000 to $14,999 income bracket, making it the least populous group.
| Income Bracket | # Households | % Households |
| Less than $10,000 | 25 | 3.7% |
| $10,000 to $14,999 | 14 | 2.1% |
| $15,000 to $24,999 | 31 | 4.6% |
| $25,000 to $34,999 | 29 | 4.3% |
| $35,000 to $49,999 | 87 | 12.9% |
| $50,000 to $74,999 | 150 | 22.3% |
| $75,000 to $99,999 | 74 | 11.0% |
| $100,000 to $149,999 | 126 | 18.8% |
| $150,000 to $199,999 | 72 | 10.7% |
| $200,000+ | 64 | 9.5% |
Household Income by Householder Age in Cedar Ridge
The median household income in Cedar Ridge is $73,750, with the highest median household income of $107,742 found in the 25 to 44 years age bracket for the primary householder. A total of 110 households (16.4%) fall into this category.
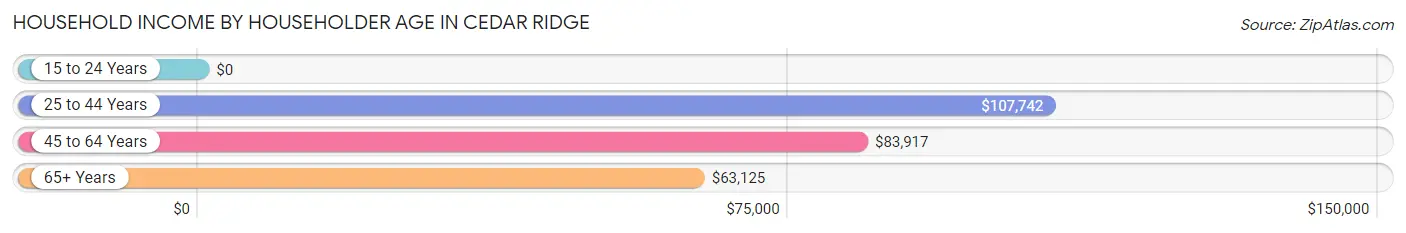
| Income Bracket | # Households | Median Income |
| 15 to 24 Years | 0 (0.0%) | $0 |
| 25 to 44 Years | 110 (16.4%) | $107,742 |
| 45 to 64 Years | 299 (44.5%) | $83,917 |
| 65+ Years | 263 (39.1%) | $63,125 |
| Total | 672 (100.0%) | $73,750 |
Poverty in Cedar Ridge
Income Below Poverty by Sex and Age in Cedar Ridge
With 5.0% poverty level for males and 10.4% for females among the residents of Cedar Ridge, 75 year old and over males and 45 to 54 year old females are the most vulnerable to poverty, with 11 males (12.8%) and 48 females (46.6%) in their respective age groups living below the poverty level.
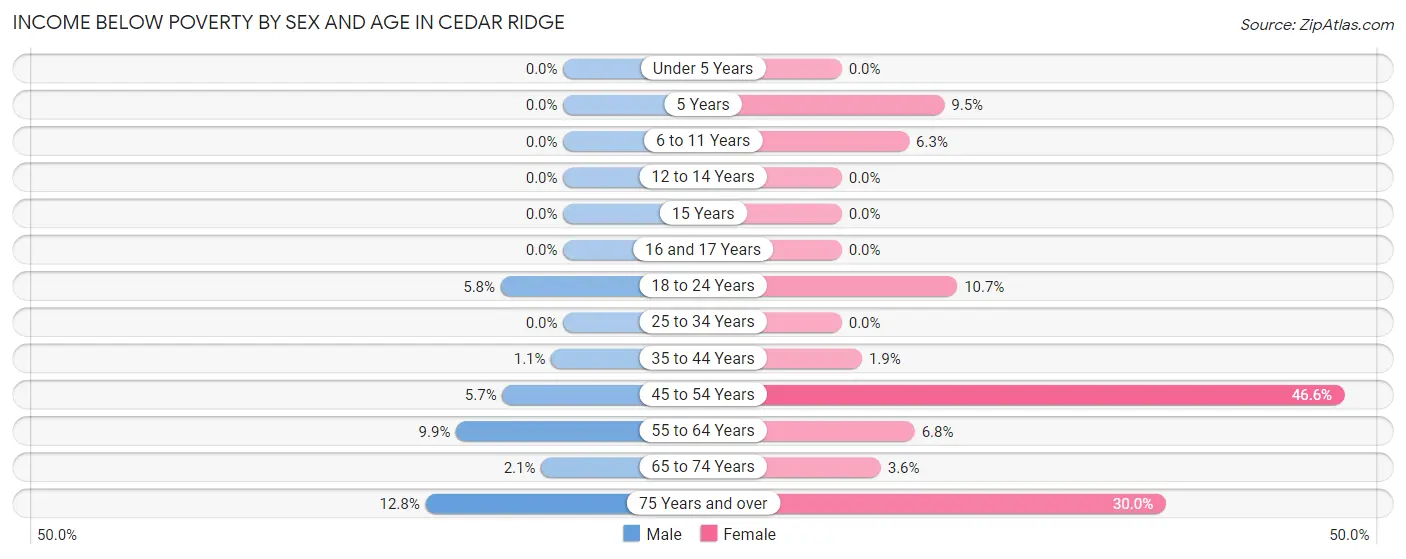
| Age Bracket | Male | Female |
| Under 5 Years | 0 (0.0%) | 0 (0.0%) |
| 5 Years | 0 (0.0%) | 2 (9.5%) |
| 6 to 11 Years | 0 (0.0%) | 5 (6.2%) |
| 12 to 14 Years | 0 (0.0%) | 0 (0.0%) |
| 15 Years | 0 (0.0%) | 0 (0.0%) |
| 16 and 17 Years | 0 (0.0%) | 0 (0.0%) |
| 18 to 24 Years | 4 (5.8%) | 3 (10.7%) |
| 25 to 34 Years | 0 (0.0%) | 0 (0.0%) |
| 35 to 44 Years | 1 (1.1%) | 2 (1.9%) |
| 45 to 54 Years | 7 (5.7%) | 48 (46.6%) |
| 55 to 64 Years | 16 (9.9%) | 9 (6.8%) |
| 65 to 74 Years | 3 (2.1%) | 5 (3.6%) |
| 75 Years and over | 11 (12.8%) | 9 (30.0%) |
| Total | 42 (5.0%) | 83 (10.4%) |
Income Above Poverty by Sex and Age in Cedar Ridge
According to the poverty statistics in Cedar Ridge, males aged under 5 years and females aged under 5 years are the age groups that are most secure financially, with 100.0% of males and 100.0% of females in these age groups living above the poverty line.
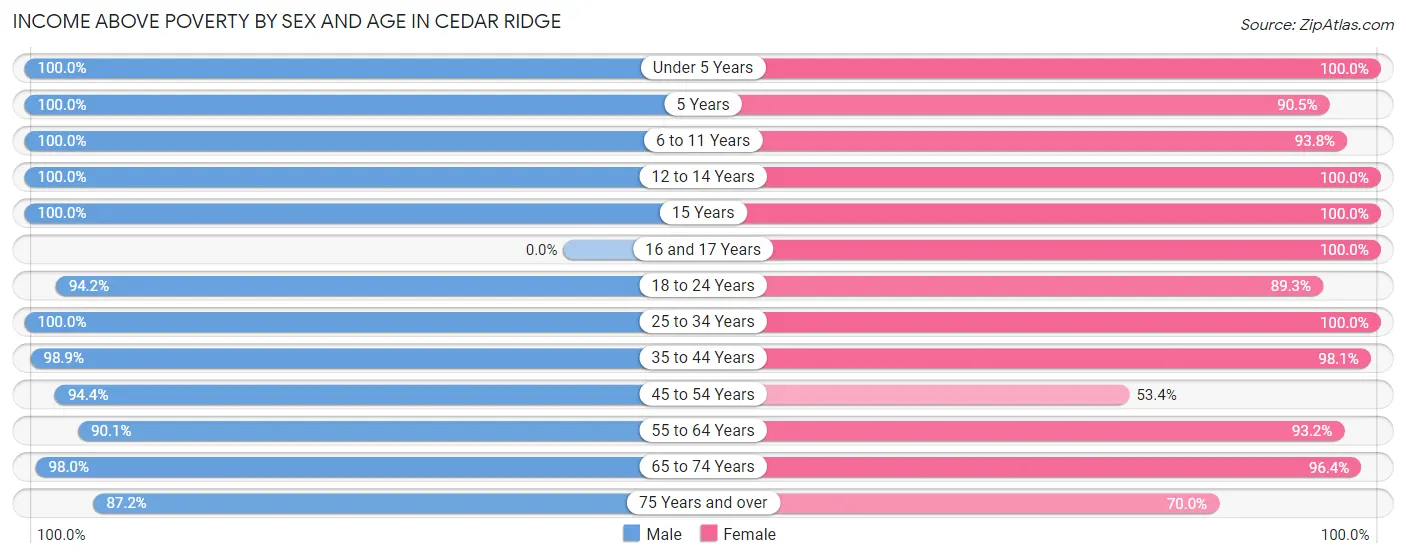
| Age Bracket | Male | Female |
| Under 5 Years | 29 (100.0%) | 5 (100.0%) |
| 5 Years | 33 (100.0%) | 19 (90.5%) |
| 6 to 11 Years | 56 (100.0%) | 75 (93.8%) |
| 12 to 14 Years | 21 (100.0%) | 42 (100.0%) |
| 15 Years | 10 (100.0%) | 31 (100.0%) |
| 16 and 17 Years | 0 (0.0%) | 35 (100.0%) |
| 18 to 24 Years | 65 (94.2%) | 25 (89.3%) |
| 25 to 34 Years | 9 (100.0%) | 42 (100.0%) |
| 35 to 44 Years | 89 (98.9%) | 105 (98.1%) |
| 45 to 54 Years | 117 (94.4%) | 55 (53.4%) |
| 55 to 64 Years | 145 (90.1%) | 124 (93.2%) |
| 65 to 74 Years | 143 (98.0%) | 133 (96.4%) |
| 75 Years and over | 75 (87.2%) | 21 (70.0%) |
| Total | 792 (95.0%) | 712 (89.6%) |
Income Below Poverty Among Married-Couple Families in Cedar Ridge
The poverty statistics for married-couple families in Cedar Ridge show that 4.1% or 17 of the total 415 families live below the poverty line. Families with no children have the highest poverty rate of 6.3%, comprising of 16 families. On the other hand, families with 3 or 4 children have the lowest poverty rate of 0.0%, which includes 0 families.
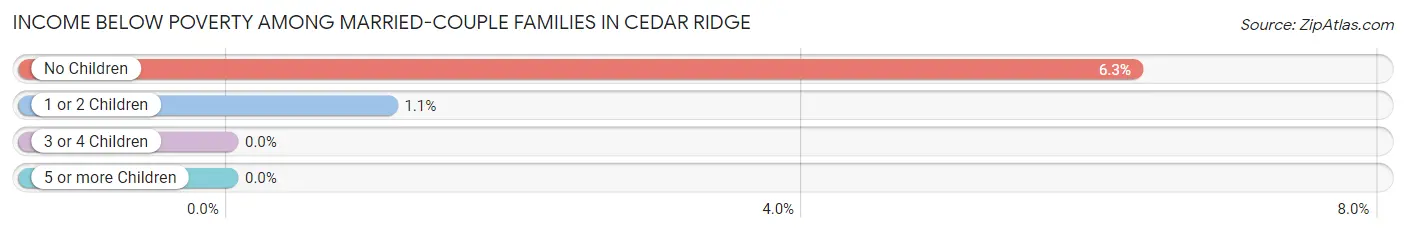
| Children | Above Poverty | Below Poverty |
| No Children | 238 (93.7%) | 16 (6.3%) |
| 1 or 2 Children | 89 (98.9%) | 1 (1.1%) |
| 3 or 4 Children | 71 (100.0%) | 0 (0.0%) |
| 5 or more Children | 0 (0.0%) | 0 (0.0%) |
| Total | 398 (95.9%) | 17 (4.1%) |
Income Below Poverty Among Single-Parent Households in Cedar Ridge
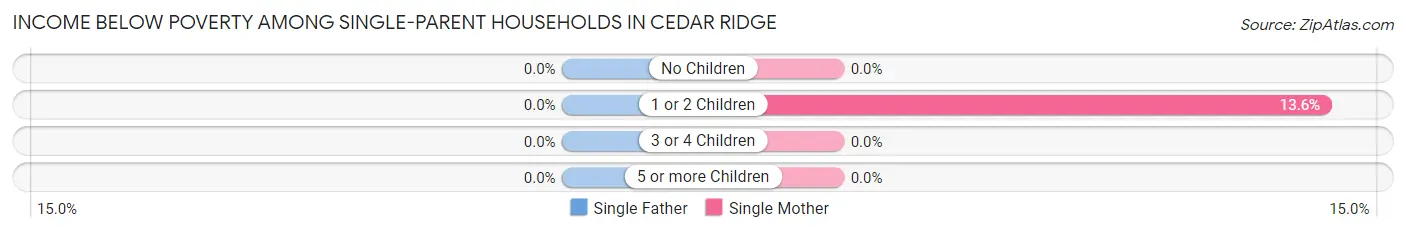
| Children | Single Father | Single Mother |
| No Children | 0 (0.0%) | 0 (0.0%) |
| 1 or 2 Children | 0 (0.0%) | 3 (13.6%) |
| 3 or 4 Children | 0 (0.0%) | 0 (0.0%) |
| 5 or more Children | 0 (0.0%) | 0 (0.0%) |
| Total | 0 (0.0%) | 3 (13.6%) |
Income Below Poverty Among Married-Couple vs Single-Parent Households in Cedar Ridge
The poverty data for Cedar Ridge shows that 17 of the married-couple family households (4.1%) and 3 of the single-parent households (6.4%) are living below the poverty level. Within the married-couple family households, those with no children have the highest poverty rate, with 16 households (6.3%) falling below the poverty line. Among the single-parent households, those with 1 or 2 children have the highest poverty rate, with 3 household (8.8%) living below poverty.
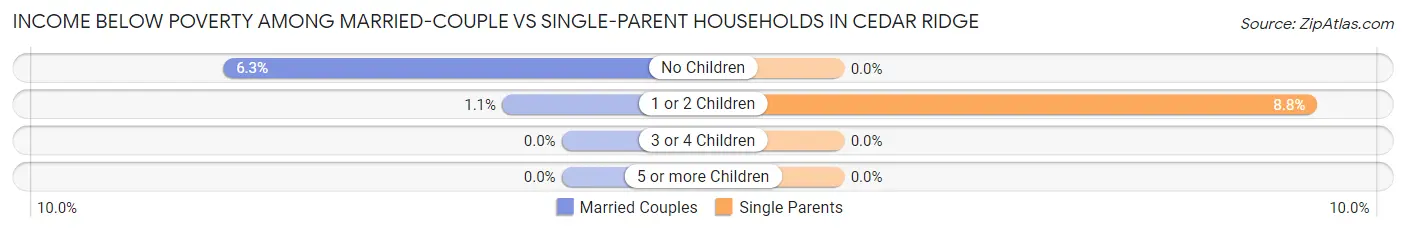
| Children | Married-Couple Families | Single-Parent Households |
| No Children | 16 (6.3%) | 0 (0.0%) |
| 1 or 2 Children | 1 (1.1%) | 3 (8.8%) |
| 3 or 4 Children | 0 (0.0%) | 0 (0.0%) |
| 5 or more Children | 0 (0.0%) | 0 (0.0%) |
| Total | 17 (4.1%) | 3 (6.4%) |
Race in Cedar Ridge
The most populous races in Cedar Ridge are White / Caucasian (1,436 | 87.0%), Two or more Races (147 | 8.9%), and Hispanic or Latino (129 | 7.8%).
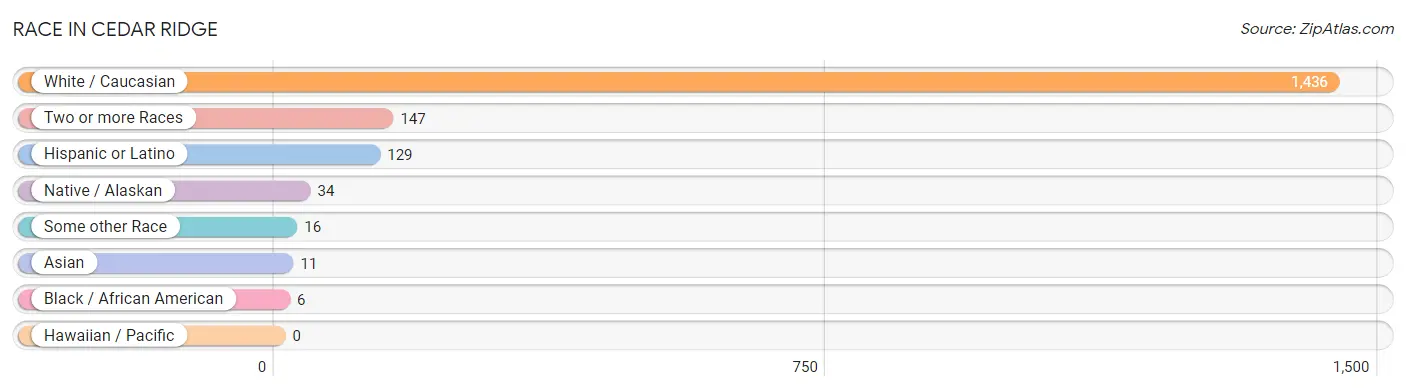
| Race | # Population | % Population |
| Asian | 11 | 0.7% |
| Black / African American | 6 | 0.4% |
| Hawaiian / Pacific | 0 | 0.0% |
| Hispanic or Latino | 129 | 7.8% |
| Native / Alaskan | 34 | 2.1% |
| White / Caucasian | 1,436 | 87.0% |
| Two or more Races | 147 | 8.9% |
| Some other Race | 16 | 1.0% |
| Total | 1,650 | 100.0% |
Ancestry in Cedar Ridge
The most populous ancestries reported in Cedar Ridge are Irish (426 | 25.8%), German (415 | 25.2%), English (296 | 17.9%), European (159 | 9.6%), and Mexican (102 | 6.2%), together accounting for 84.7% of all Cedar Ridge residents.
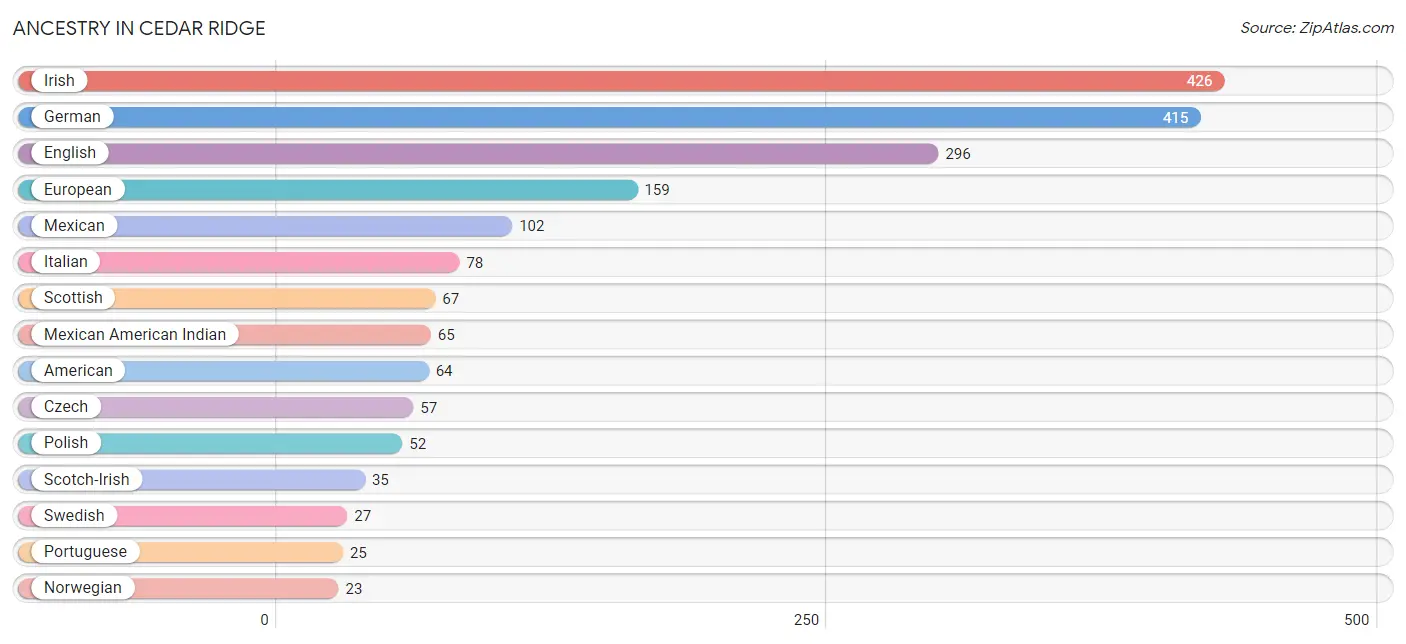
| Ancestry | # Population | % Population |
| American | 64 | 3.9% |
| Arab | 5 | 0.3% |
| Austrian | 4 | 0.2% |
| Canadian | 3 | 0.2% |
| Chippewa | 3 | 0.2% |
| Colombian | 7 | 0.4% |
| Croatian | 4 | 0.2% |
| Czech | 57 | 3.5% |
| Danish | 3 | 0.2% |
| Dutch | 12 | 0.7% |
| Eastern European | 3 | 0.2% |
| English | 296 | 17.9% |
| European | 159 | 9.6% |
| Finnish | 8 | 0.5% |
| French | 17 | 1.0% |
| German | 415 | 25.2% |
| Hungarian | 7 | 0.4% |
| Indian (Asian) | 2 | 0.1% |
| Irish | 426 | 25.8% |
| Italian | 78 | 4.7% |
| Japanese | 4 | 0.2% |
| Korean | 15 | 0.9% |
| Latvian | 3 | 0.2% |
| Lebanese | 5 | 0.3% |
| Mexican | 102 | 6.2% |
| Mexican American Indian | 65 | 3.9% |
| Navajo | 22 | 1.3% |
| Norwegian | 23 | 1.4% |
| Pennsylvania German | 4 | 0.2% |
| Polish | 52 | 3.2% |
| Portuguese | 25 | 1.5% |
| Russian | 5 | 0.3% |
| Scandinavian | 3 | 0.2% |
| Scotch-Irish | 35 | 2.1% |
| Scottish | 67 | 4.1% |
| South American | 7 | 0.4% |
| Spaniard | 20 | 1.2% |
| Swedish | 27 | 1.6% |
| Swiss | 9 | 0.5% |
| Ukrainian | 4 | 0.2% |
| Welsh | 15 | 0.9% | View All 41 Rows |
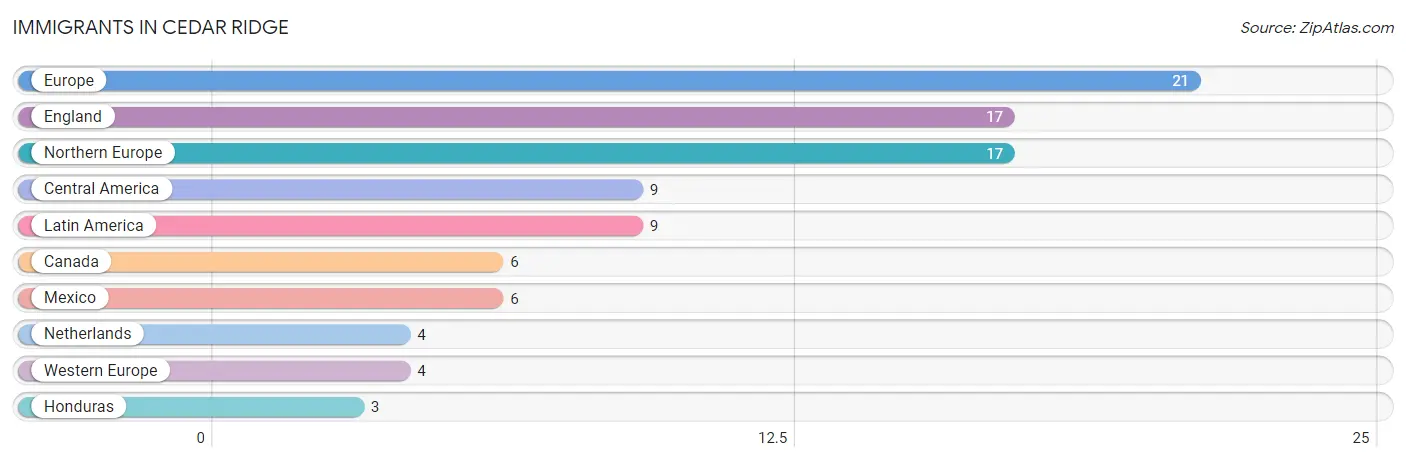
Immigrants in Cedar Ridge
The most numerous immigrant groups reported in Cedar Ridge came from Europe (21 | 1.3%), England (17 | 1.0%), Northern Europe (17 | 1.0%), Central America (9 | 0.5%), and Latin America (9 | 0.5%), together accounting for 4.4% of all Cedar Ridge residents.
| Immigration Origin | # Population | % Population |
| Canada | 6 | 0.4% |
| Central America | 9 | 0.5% |
| England | 17 | 1.0% |
| Europe | 21 | 1.3% |
| Honduras | 3 | 0.2% |
| Latin America | 9 | 0.5% |
| Mexico | 6 | 0.4% |
| Netherlands | 4 | 0.2% |
| Northern Europe | 17 | 1.0% |
| Western Europe | 4 | 0.2% | View All 10 Rows |
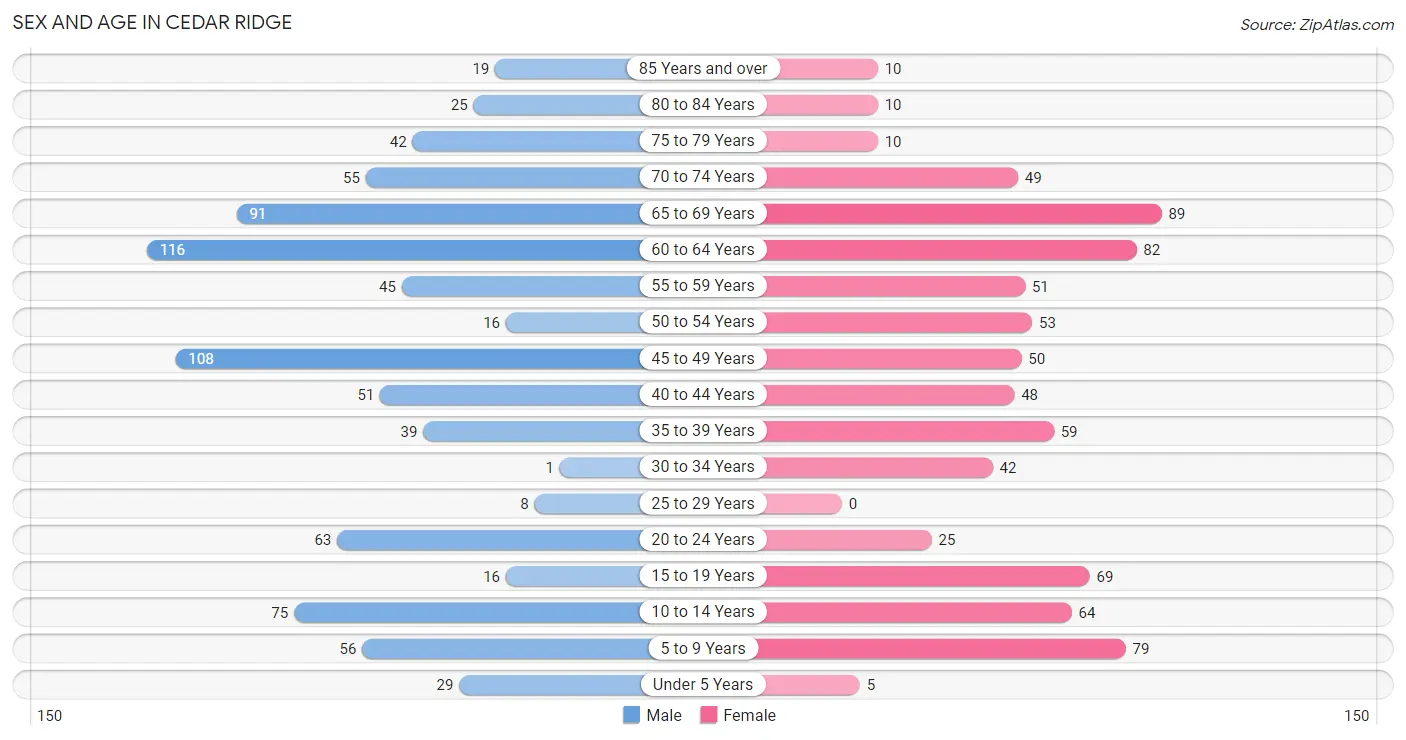
Sex and Age in Cedar Ridge
Sex and Age in Cedar Ridge
The most populous age groups in Cedar Ridge are 60 to 64 Years (116 | 13.6%) for men and 65 to 69 Years (89 | 11.2%) for women.
| Age Bracket | Male | Female |
| Under 5 Years | 29 (3.4%) | 5 (0.6%) |
| 5 to 9 Years | 56 (6.6%) | 79 (9.9%) |
| 10 to 14 Years | 75 (8.8%) | 64 (8.1%) |
| 15 to 19 Years | 16 (1.9%) | 69 (8.7%) |
| 20 to 24 Years | 63 (7.4%) | 25 (3.1%) |
| 25 to 29 Years | 8 (0.9%) | 0 (0.0%) |
| 30 to 34 Years | 1 (0.1%) | 42 (5.3%) |
| 35 to 39 Years | 39 (4.6%) | 59 (7.4%) |
| 40 to 44 Years | 51 (6.0%) | 48 (6.0%) |
| 45 to 49 Years | 108 (12.6%) | 50 (6.3%) |
| 50 to 54 Years | 16 (1.9%) | 53 (6.7%) |
| 55 to 59 Years | 45 (5.3%) | 51 (6.4%) |
| 60 to 64 Years | 116 (13.6%) | 82 (10.3%) |
| 65 to 69 Years | 91 (10.6%) | 89 (11.2%) |
| 70 to 74 Years | 55 (6.4%) | 49 (6.2%) |
| 75 to 79 Years | 42 (4.9%) | 10 (1.3%) |
| 80 to 84 Years | 25 (2.9%) | 10 (1.3%) |
| 85 Years and over | 19 (2.2%) | 10 (1.3%) |
| Total | 855 (100.0%) | 795 (100.0%) |
Families and Households in Cedar Ridge
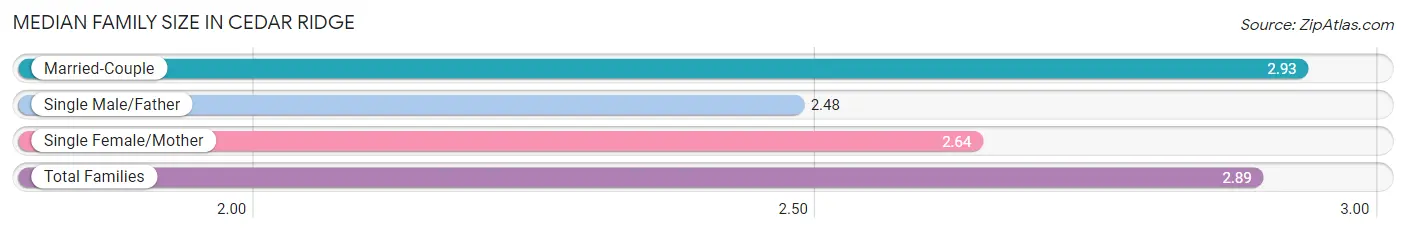
Median Family Size in Cedar Ridge
The median family size in Cedar Ridge is 2.89 persons per family, with married-couple families (415 | 89.8%) accounting for the largest median family size of 2.93 persons per family. On the other hand, single male/father families (25 | 5.4%) represent the smallest median family size with 2.48 persons per family.
| Family Type | # Families | Family Size |
| Married-Couple | 415 (89.8%) | 2.93 |
| Single Male/Father | 25 (5.4%) | 2.48 |
| Single Female/Mother | 22 (4.8%) | 2.64 |
| Total Families | 462 (100.0%) | 2.89 |
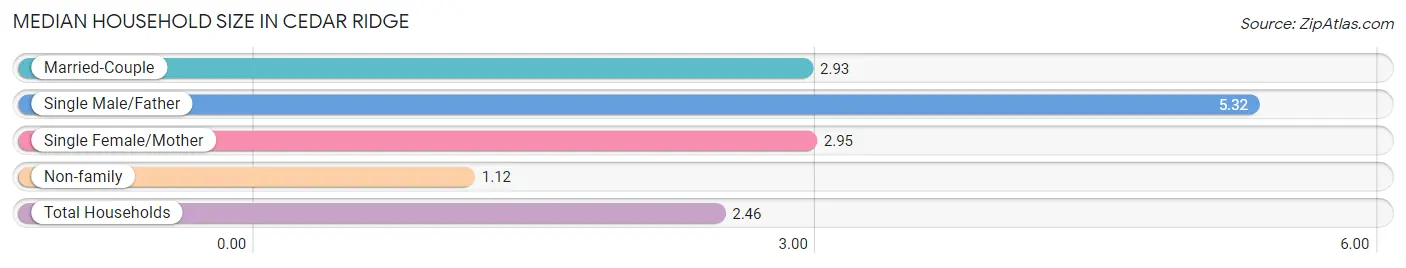
Median Household Size in Cedar Ridge
The median household size in Cedar Ridge is 2.46 persons per household, with single male/father households (25 | 3.7%) accounting for the largest median household size of 5.32 persons per household. non-family households (210 | 31.2%) represent the smallest median household size with 1.12 persons per household.
| Household Type | # Households | Household Size |
| Married-Couple | 415 (61.8%) | 2.93 |
| Single Male/Father | 25 (3.7%) | 5.32 |
| Single Female/Mother | 22 (3.3%) | 2.95 |
| Non-family | 210 (31.2%) | 1.12 |
| Total Households | 672 (100.0%) | 2.46 |
Household Size by Marriage Status in Cedar Ridge
Out of a total of 672 households in Cedar Ridge, 462 (68.8%) are family households, while 210 (31.2%) are nonfamily households. The most numerous type of family households are 2-person households, comprising 249, and the most common type of nonfamily households are 1-person households, comprising 168.
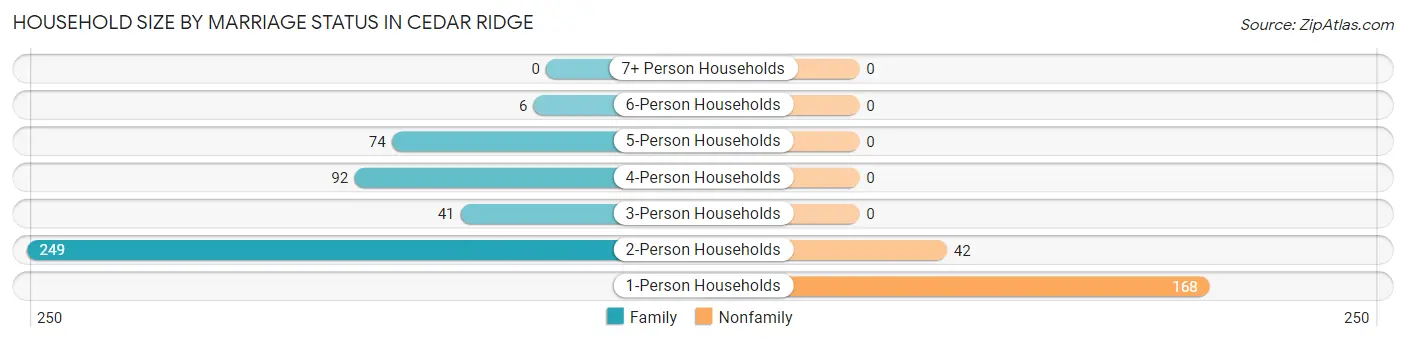
| Household Size | Family Households | Nonfamily Households |
| 1-Person Households | - | 168 (25.0%) |
| 2-Person Households | 249 (37.0%) | 42 (6.2%) |
| 3-Person Households | 41 (6.1%) | 0 (0.0%) |
| 4-Person Households | 92 (13.7%) | 0 (0.0%) |
| 5-Person Households | 74 (11.0%) | 0 (0.0%) |
| 6-Person Households | 6 (0.9%) | 0 (0.0%) |
| 7+ Person Households | 0 (0.0%) | 0 (0.0%) |
| Total | 462 (68.8%) | 210 (31.2%) |
Female Fertility in Cedar Ridge
Fertility by Age in Cedar Ridge
Average fertility rate in Cedar Ridge is 111.0 births per 1,000 women. Women in the age bracket of 35 to 50 years have the highest fertility rate with 188.0 births per 1,000 women. Women in the age bracket of 35 to 50 years acount for 100.0% of all women with births.
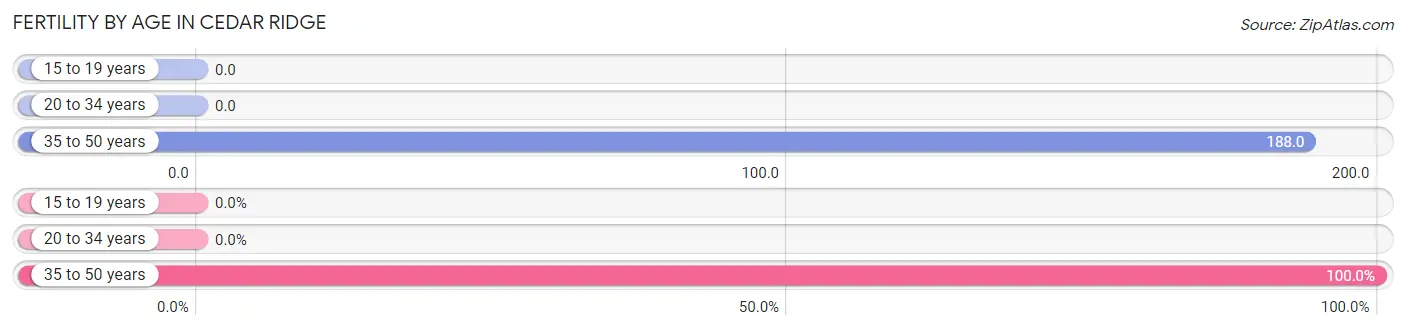
| Age Bracket | Women with Births | Births / 1,000 Women |
| 15 to 19 years | 0 (0.0%) | 0.0 |
| 20 to 34 years | 0 (0.0%) | 0.0 |
| 35 to 50 years | 37 (100.0%) | 188.0 |
| Total | 37 (100.0%) | 111.0 |
Fertility by Age by Marriage Status in Cedar Ridge
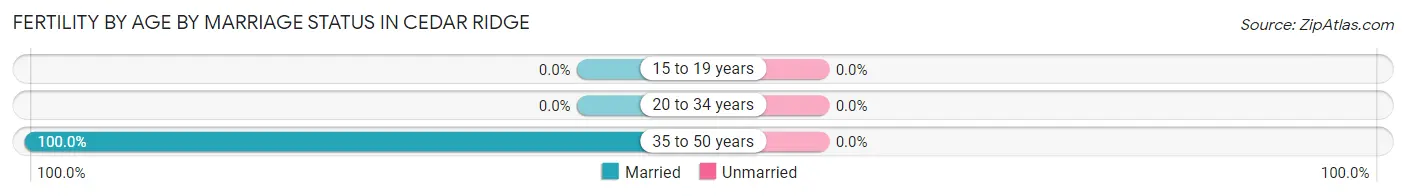
| Age Bracket | Married | Unmarried |
| 15 to 19 years | 0 (0.0%) | 0 (0.0%) |
| 20 to 34 years | 0 (0.0%) | 0 (0.0%) |
| 35 to 50 years | 37 (100.0%) | 0 (0.0%) |
| Total | 37 (100.0%) | 0 (0.0%) |
Fertility by Education in Cedar Ridge
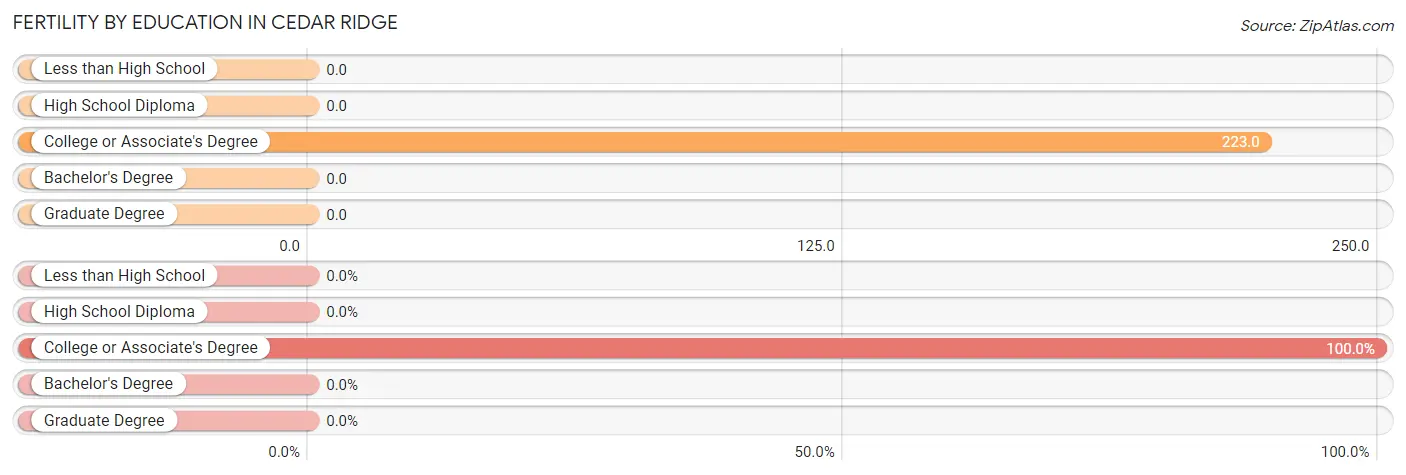
| Educational Attainment | Women with Births | Births / 1,000 Women |
| Less than High School | 0 (0.0%) | 0.0 |
| High School Diploma | 0 (0.0%) | 0.0 |
| College or Associate's Degree | 37 (100.0%) | 223.0 |
| Bachelor's Degree | 0 (0.0%) | 0.0 |
| Graduate Degree | 0 (0.0%) | 0.0 |
| Total | 37 (100.0%) | 111.0 |
Fertility by Education by Marriage Status in Cedar Ridge
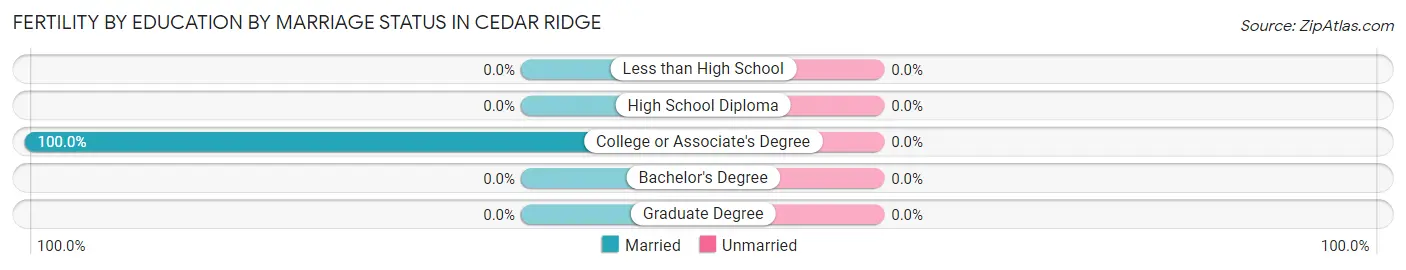
| Educational Attainment | Married | Unmarried |
| Less than High School | 0 (0.0%) | 0 (0.0%) |
| High School Diploma | 0 (0.0%) | 0 (0.0%) |
| College or Associate's Degree | 37 (100.0%) | 0 (0.0%) |
| Bachelor's Degree | 0 (0.0%) | 0 (0.0%) |
| Graduate Degree | 0 (0.0%) | 0 (0.0%) |
| Total | 37 (100.0%) | 0 (0.0%) |
Employment Characteristics in Cedar Ridge
Employment by Class of Employer in Cedar Ridge
Among the 630 employed individuals in Cedar Ridge, private company employees (237 | 37.6%), not-for-profit organizations (93 | 14.8%), and local government employees (89 | 14.1%) make up the most common classes of employment.
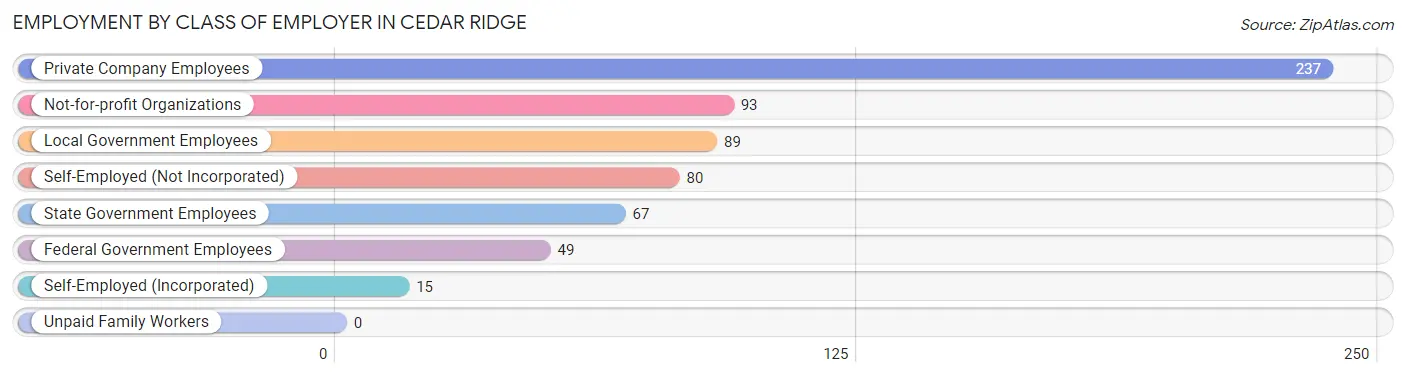
| Employer Class | # Employees | % Employees |
| Private Company Employees | 237 | 37.6% |
| Self-Employed (Incorporated) | 15 | 2.4% |
| Self-Employed (Not Incorporated) | 80 | 12.7% |
| Not-for-profit Organizations | 93 | 14.8% |
| Local Government Employees | 89 | 14.1% |
| State Government Employees | 67 | 10.6% |
| Federal Government Employees | 49 | 7.8% |
| Unpaid Family Workers | 0 | 0.0% |
| Total | 630 | 100.0% |
Employment Status by Age in Cedar Ridge
According to the labor force statistics for Cedar Ridge, out of the total population over 16 years of age (1,301), 57.0% or 742 individuals are in the labor force, with 6.4% or 47 of them unemployed. The age group with the highest labor force participation rate is 25 to 29 years, with 100.0% or 8 individuals in the labor force. Within the labor force, the 16 to 19 years age range has the highest percentage of unemployed individuals, with 100.0% or 5 of them being unemployed.
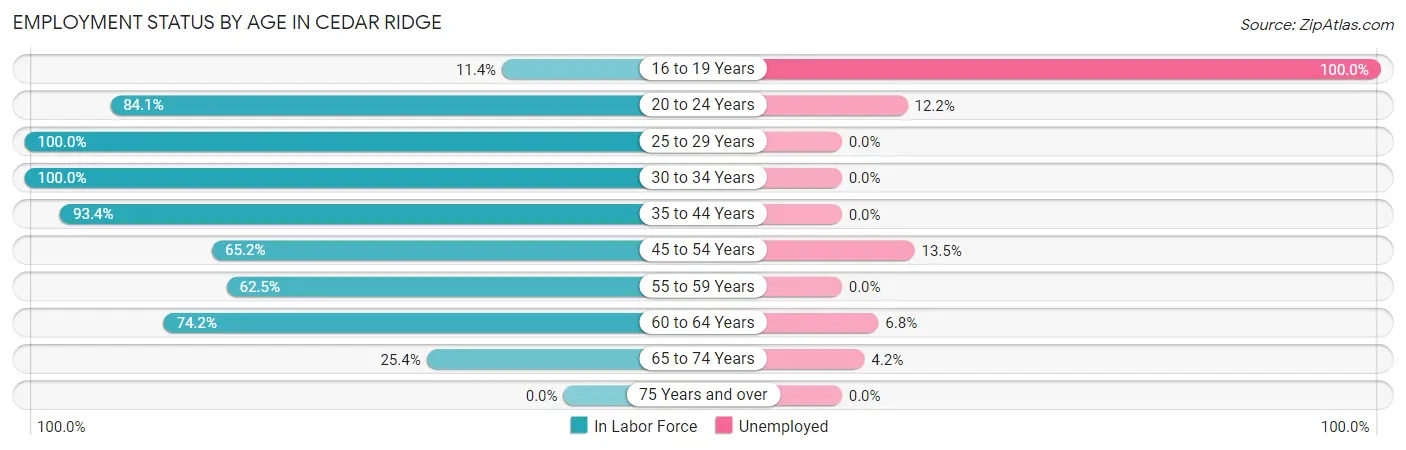
| Age Bracket | In Labor Force | Unemployed |
| 16 to 19 Years | 5 (11.4%) | 5 (100.0%) |
| 20 to 24 Years | 74 (84.1%) | 9 (12.2%) |
| 25 to 29 Years | 8 (100.0%) | 0 (0.0%) |
| 30 to 34 Years | 43 (100.0%) | 0 (0.0%) |
| 35 to 44 Years | 184 (93.4%) | 0 (0.0%) |
| 45 to 54 Years | 148 (65.2%) | 20 (13.5%) |
| 55 to 59 Years | 60 (62.5%) | 0 (0.0%) |
| 60 to 64 Years | 147 (74.2%) | 10 (6.8%) |
| 65 to 74 Years | 72 (25.4%) | 3 (4.2%) |
| 75 Years and over | 0 (0.0%) | 0 (0.0%) |
| Total | 742 (57.0%) | 47 (6.4%) |
Employment Status by Educational Attainment in Cedar Ridge
According to labor force statistics for Cedar Ridge, 76.7% of individuals (590) out of the total population between 25 and 64 years of age (769) are in the labor force, with 5.1% or 30 of them being unemployed. The group with the highest labor force participation rate are those with the educational attainment of bachelor's degree or higher, with 88.7% or 133 individuals in the labor force. Within the labor force, individuals with college / associate degree education have the highest percentage of unemployment, with 9.2% or 30 of them being unemployed.
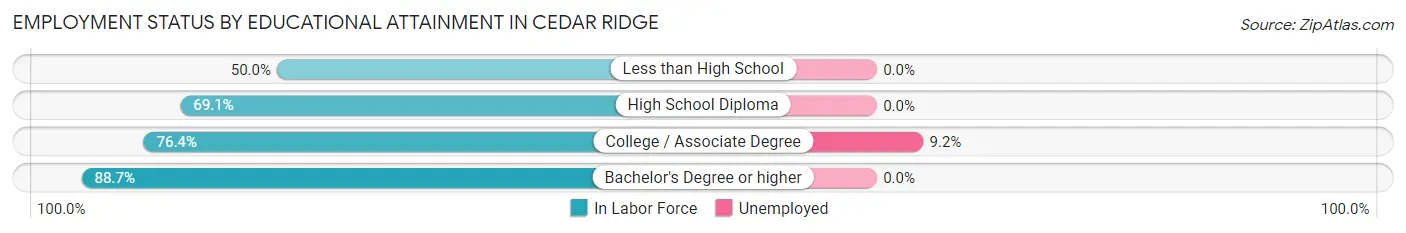
| Educational Attainment | In Labor Force | Unemployed |
| Less than High School | 6 (50.0%) | 0 (0.0%) |
| High School Diploma | 121 (69.1%) | 0 (0.0%) |
| College / Associate Degree | 330 (76.4%) | 40 (9.2%) |
| Bachelor's Degree or higher | 133 (88.7%) | 0 (0.0%) |
| Total | 590 (76.7%) | 39 (5.1%) |
Employment Occupations by Sex in Cedar Ridge
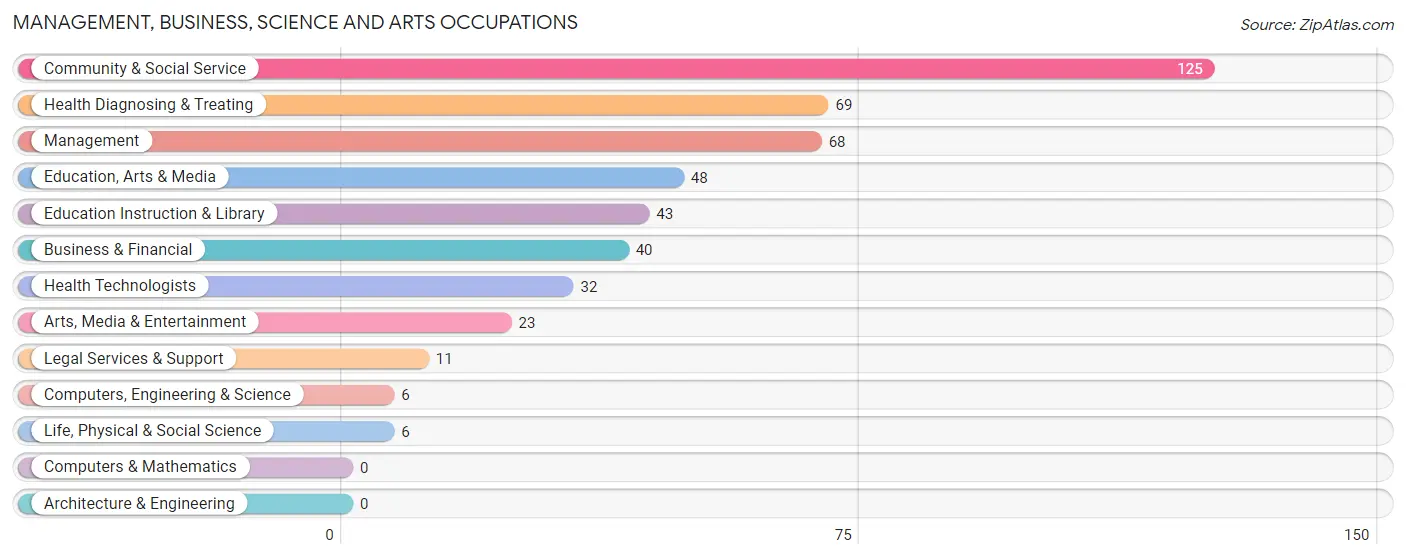
Management, Business, Science and Arts Occupations
The most common Management, Business, Science and Arts occupations in Cedar Ridge are Community & Social Service (125 | 18.1%), Health Diagnosing & Treating (69 | 10.0%), Management (68 | 9.8%), Education, Arts & Media (48 | 7.0%), and Education Instruction & Library (43 | 6.2%).
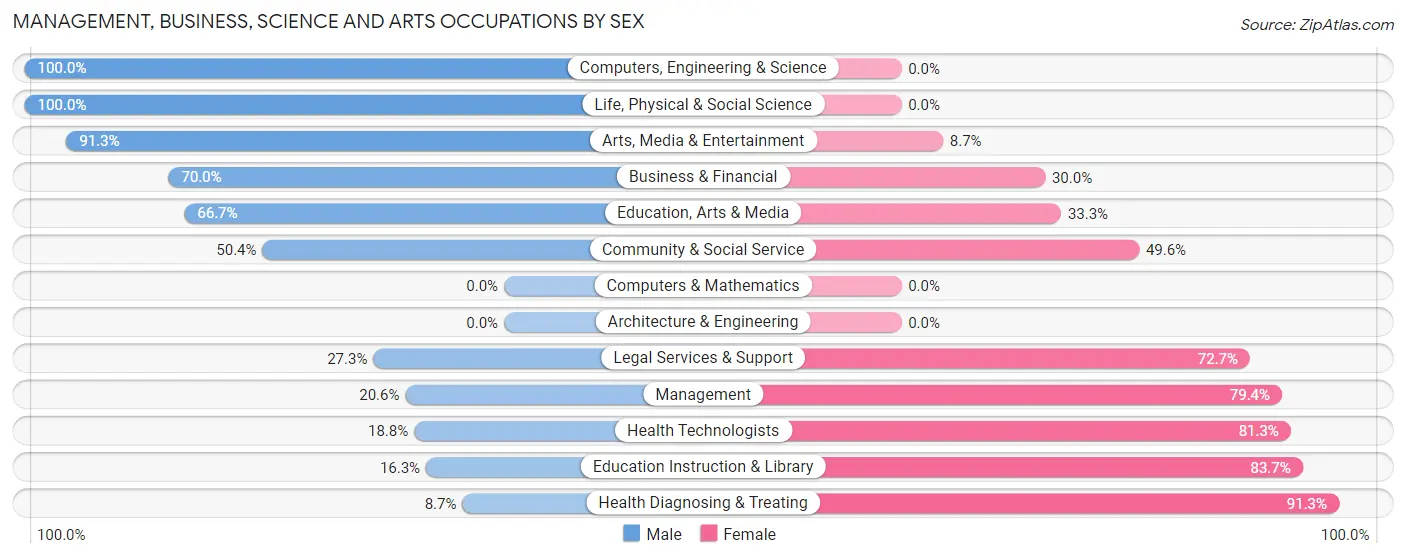
Management, Business, Science and Arts Occupations by Sex
Within the Management, Business, Science and Arts occupations in Cedar Ridge, the most male-oriented occupations are Computers, Engineering & Science (100.0%), Life, Physical & Social Science (100.0%), and Arts, Media & Entertainment (91.3%), while the most female-oriented occupations are Health Diagnosing & Treating (91.3%), Education Instruction & Library (83.7%), and Health Technologists (81.2%).
| Occupation | Male | Female |
| Management | 14 (20.6%) | 54 (79.4%) |
| Business & Financial | 28 (70.0%) | 12 (30.0%) |
| Computers, Engineering & Science | 6 (100.0%) | 0 (0.0%) |
| Computers & Mathematics | 0 (0.0%) | 0 (0.0%) |
| Architecture & Engineering | 0 (0.0%) | 0 (0.0%) |
| Life, Physical & Social Science | 6 (100.0%) | 0 (0.0%) |
| Community & Social Service | 63 (50.4%) | 62 (49.6%) |
| Education, Arts & Media | 32 (66.7%) | 16 (33.3%) |
| Legal Services & Support | 3 (27.3%) | 8 (72.7%) |
| Education Instruction & Library | 7 (16.3%) | 36 (83.7%) |
| Arts, Media & Entertainment | 21 (91.3%) | 2 (8.7%) |
| Health Diagnosing & Treating | 6 (8.7%) | 63 (91.3%) |
| Health Technologists | 6 (18.8%) | 26 (81.2%) |
| Total (Category) | 117 (38.0%) | 191 (62.0%) |
| Total (Overall) | 363 (52.5%) | 328 (47.5%) |
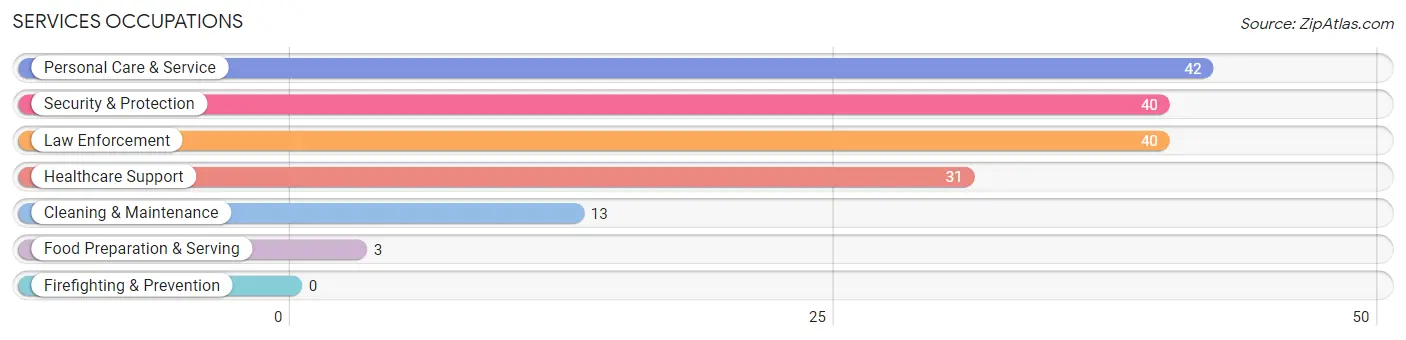
Services Occupations
The most common Services occupations in Cedar Ridge are Personal Care & Service (42 | 6.1%), Security & Protection (40 | 5.8%), Law Enforcement (40 | 5.8%), Healthcare Support (31 | 4.5%), and Cleaning & Maintenance (13 | 1.9%).
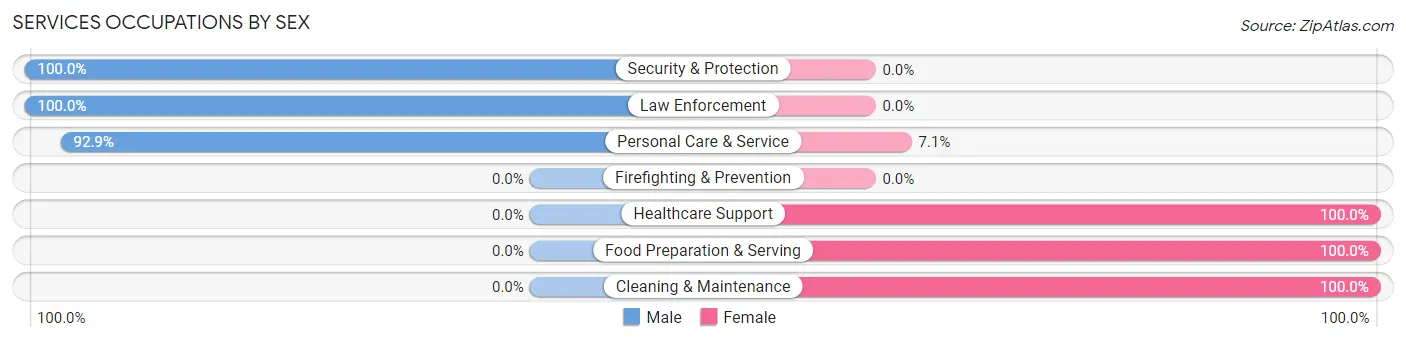
Services Occupations by Sex
Within the Services occupations in Cedar Ridge, the most male-oriented occupations are Security & Protection (100.0%), Law Enforcement (100.0%), and Personal Care & Service (92.9%), while the most female-oriented occupations are Healthcare Support (100.0%), Food Preparation & Serving (100.0%), and Cleaning & Maintenance (100.0%).
| Occupation | Male | Female |
| Healthcare Support | 0 (0.0%) | 31 (100.0%) |
| Security & Protection | 40 (100.0%) | 0 (0.0%) |
| Firefighting & Prevention | 0 (0.0%) | 0 (0.0%) |
| Law Enforcement | 40 (100.0%) | 0 (0.0%) |
| Food Preparation & Serving | 0 (0.0%) | 3 (100.0%) |
| Cleaning & Maintenance | 0 (0.0%) | 13 (100.0%) |
| Personal Care & Service | 39 (92.9%) | 3 (7.1%) |
| Total (Category) | 79 (61.2%) | 50 (38.8%) |
| Total (Overall) | 363 (52.5%) | 328 (47.5%) |
Sales and Office Occupations
The most common Sales and Office occupations in Cedar Ridge are Sales & Related (75 | 10.8%), and Office & Administration (71 | 10.3%).

Sales and Office Occupations by Sex

| Occupation | Male | Female |
| Sales & Related | 58 (77.3%) | 17 (22.7%) |
| Office & Administration | 3 (4.2%) | 68 (95.8%) |
| Total (Category) | 61 (41.8%) | 85 (58.2%) |
| Total (Overall) | 363 (52.5%) | 328 (47.5%) |
Natural Resources, Construction and Maintenance Occupations
The most common Natural Resources, Construction and Maintenance occupations in Cedar Ridge are Construction & Extraction (33 | 4.8%), and Installation, Maintenance & Repair (12 | 1.7%).

Natural Resources, Construction and Maintenance Occupations by Sex
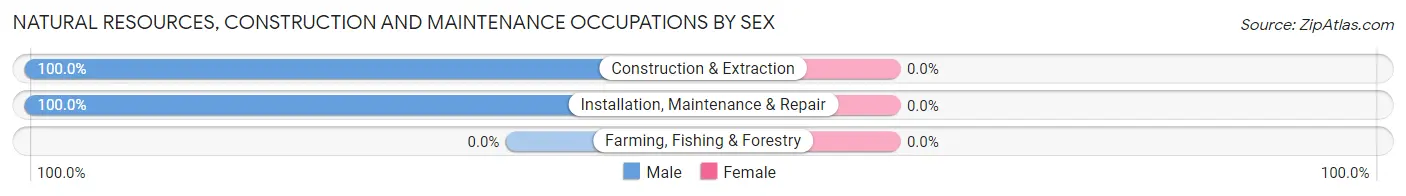
| Occupation | Male | Female |
| Farming, Fishing & Forestry | 0 (0.0%) | 0 (0.0%) |
| Construction & Extraction | 33 (100.0%) | 0 (0.0%) |
| Installation, Maintenance & Repair | 12 (100.0%) | 0 (0.0%) |
| Total (Category) | 45 (100.0%) | 0 (0.0%) |
| Total (Overall) | 363 (52.5%) | 328 (47.5%) |
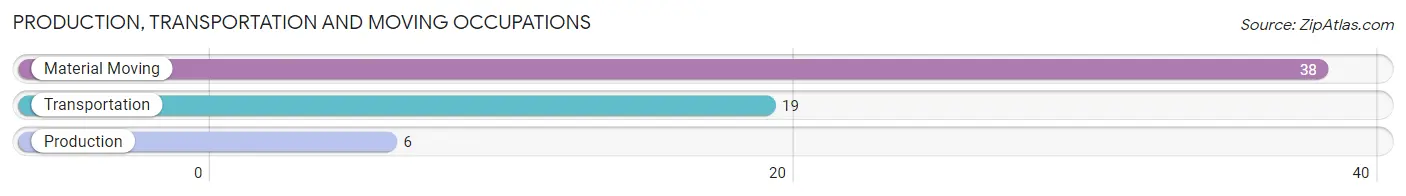
Production, Transportation and Moving Occupations
The most common Production, Transportation and Moving occupations in Cedar Ridge are Material Moving (38 | 5.5%), Transportation (19 | 2.8%), and Production (6 | 0.9%).
Production, Transportation and Moving Occupations by Sex
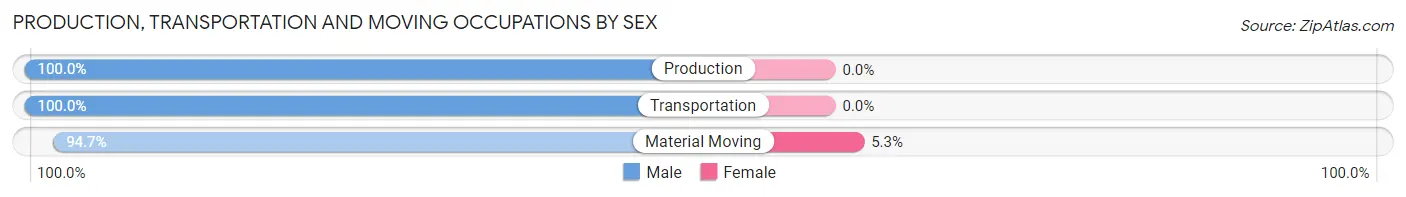
| Occupation | Male | Female |
| Production | 6 (100.0%) | 0 (0.0%) |
| Transportation | 19 (100.0%) | 0 (0.0%) |
| Material Moving | 36 (94.7%) | 2 (5.3%) |
| Total (Category) | 61 (96.8%) | 2 (3.2%) |
| Total (Overall) | 363 (52.5%) | 328 (47.5%) |
Employment Industries by Sex in Cedar Ridge
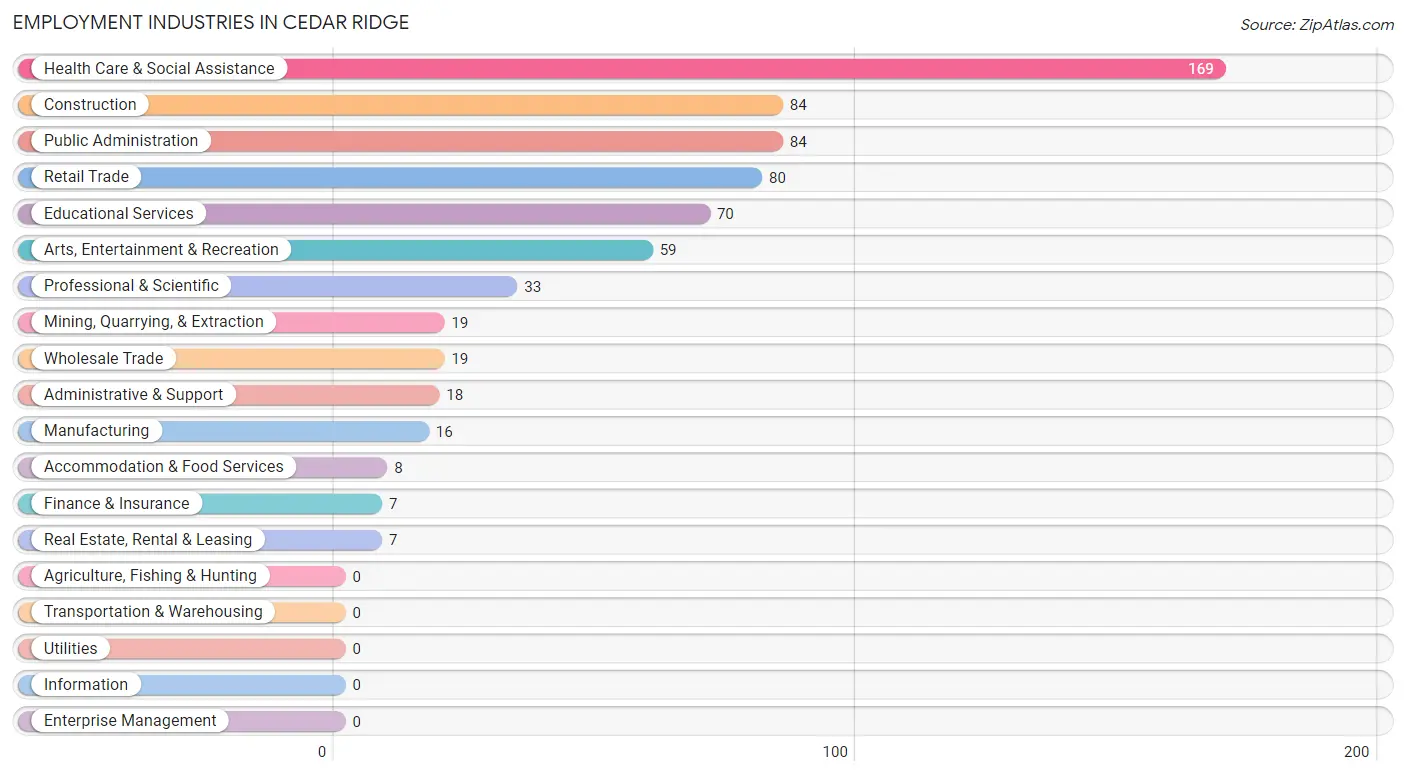
Employment Industries in Cedar Ridge
The major employment industries in Cedar Ridge include Health Care & Social Assistance (169 | 24.5%), Construction (84 | 12.2%), Public Administration (84 | 12.2%), Retail Trade (80 | 11.6%), and Educational Services (70 | 10.1%).
Employment Industries by Sex in Cedar Ridge
The Cedar Ridge industries that see more men than women are Mining, Quarrying, & Extraction (100.0%), Construction (100.0%), and Manufacturing (100.0%), whereas the industries that tend to have a higher number of women are Finance & Insurance (100.0%), Real Estate, Rental & Leasing (100.0%), and Administrative & Support (100.0%).
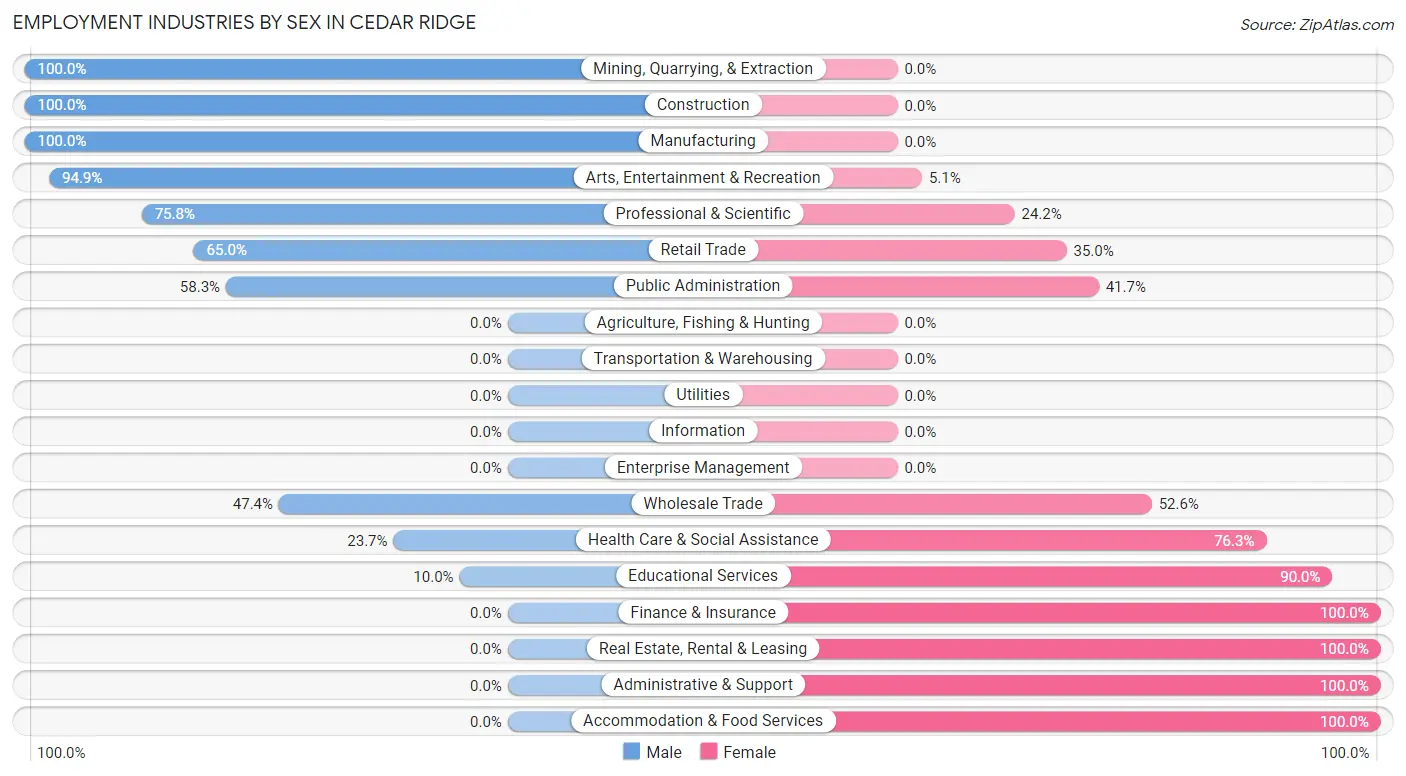
| Industry | Male | Female |
| Agriculture, Fishing & Hunting | 0 (0.0%) | 0 (0.0%) |
| Mining, Quarrying, & Extraction | 19 (100.0%) | 0 (0.0%) |
| Construction | 84 (100.0%) | 0 (0.0%) |
| Manufacturing | 16 (100.0%) | 0 (0.0%) |
| Wholesale Trade | 9 (47.4%) | 10 (52.6%) |
| Retail Trade | 52 (65.0%) | 28 (35.0%) |
| Transportation & Warehousing | 0 (0.0%) | 0 (0.0%) |
| Utilities | 0 (0.0%) | 0 (0.0%) |
| Information | 0 (0.0%) | 0 (0.0%) |
| Finance & Insurance | 0 (0.0%) | 7 (100.0%) |
| Real Estate, Rental & Leasing | 0 (0.0%) | 7 (100.0%) |
| Professional & Scientific | 25 (75.8%) | 8 (24.2%) |
| Enterprise Management | 0 (0.0%) | 0 (0.0%) |
| Administrative & Support | 0 (0.0%) | 18 (100.0%) |
| Educational Services | 7 (10.0%) | 63 (90.0%) |
| Health Care & Social Assistance | 40 (23.7%) | 129 (76.3%) |
| Arts, Entertainment & Recreation | 56 (94.9%) | 3 (5.1%) |
| Accommodation & Food Services | 0 (0.0%) | 8 (100.0%) |
| Public Administration | 49 (58.3%) | 35 (41.7%) |
| Total | 363 (52.5%) | 328 (47.5%) |
Education in Cedar Ridge
School Enrollment in Cedar Ridge
The most common levels of schooling among the 383 students in Cedar Ridge are elementary school (136 | 35.5%), high school (125 | 32.6%), and middle school (45 | 11.7%).
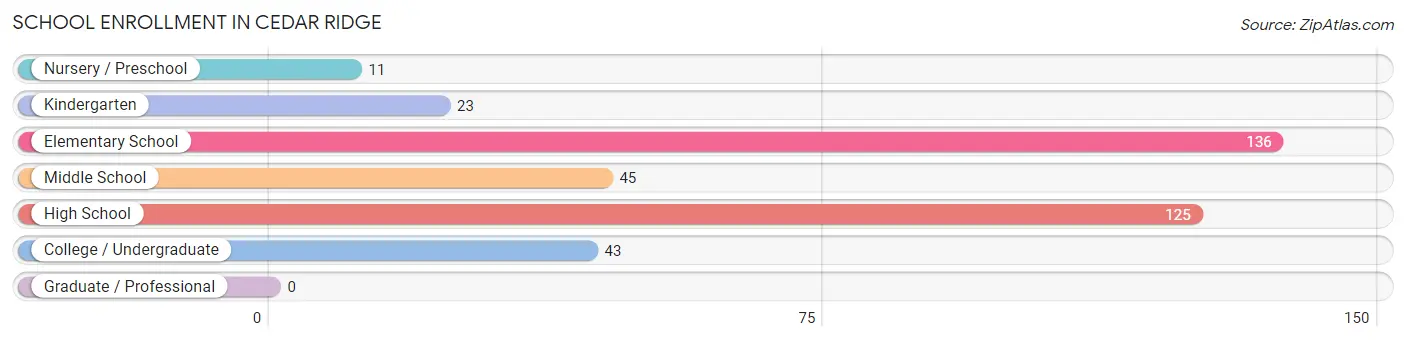
| School Level | # Students | % Students |
| Nursery / Preschool | 11 | 2.9% |
| Kindergarten | 23 | 6.0% |
| Elementary School | 136 | 35.5% |
| Middle School | 45 | 11.7% |
| High School | 125 | 32.6% |
| College / Undergraduate | 43 | 11.2% |
| Graduate / Professional | 0 | 0.0% |
| Total | 383 | 100.0% |
School Enrollment by Age by Funding Source in Cedar Ridge
Out of a total of 383 students who are enrolled in schools in Cedar Ridge, 105 (27.4%) attend a private institution, while the remaining 278 (72.6%) are enrolled in public schools. The age group of 35 years and over has the highest likelihood of being enrolled in private schools, with 31 (86.1% in the age bracket) enrolled. Conversely, the age group of 15 to 17 year olds has the lowest likelihood of being enrolled in a private school, with 76 (100.0% in the age bracket) attending a public institution.
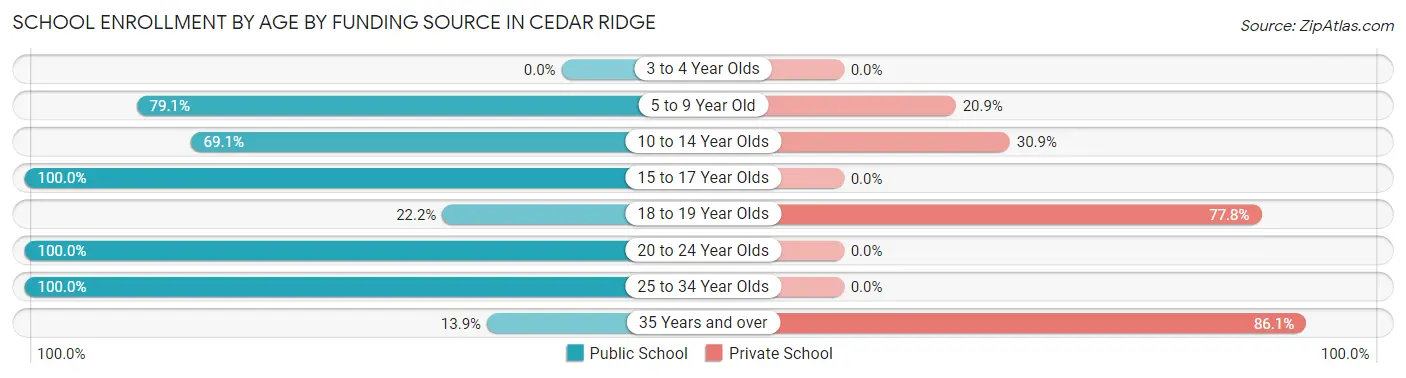
| Age Bracket | Public School | Private School |
| 3 to 4 Year Olds | 0 (0.0%) | 0 (0.0%) |
| 5 to 9 Year Old | 91 (79.1%) | 24 (20.9%) |
| 10 to 14 Year Olds | 96 (69.1%) | 43 (30.9%) |
| 15 to 17 Year Olds | 76 (100.0%) | 0 (0.0%) |
| 18 to 19 Year Olds | 2 (22.2%) | 7 (77.8%) |
| 20 to 24 Year Olds | 2 (100.0%) | 0 (0.0%) |
| 25 to 34 Year Olds | 6 (100.0%) | 0 (0.0%) |
| 35 Years and over | 5 (13.9%) | 31 (86.1%) |
| Total | 278 (72.6%) | 105 (27.4%) |
Educational Attainment by Field of Study in Cedar Ridge
Business (76 | 25.3%), arts & humanities (35 | 11.7%), social sciences (28 | 9.3%), science & technology (28 | 9.3%), and bio, nature & agricultural (24 | 8.0%) are the most common fields of study among 300 individuals in Cedar Ridge who have obtained a bachelor's degree or higher.
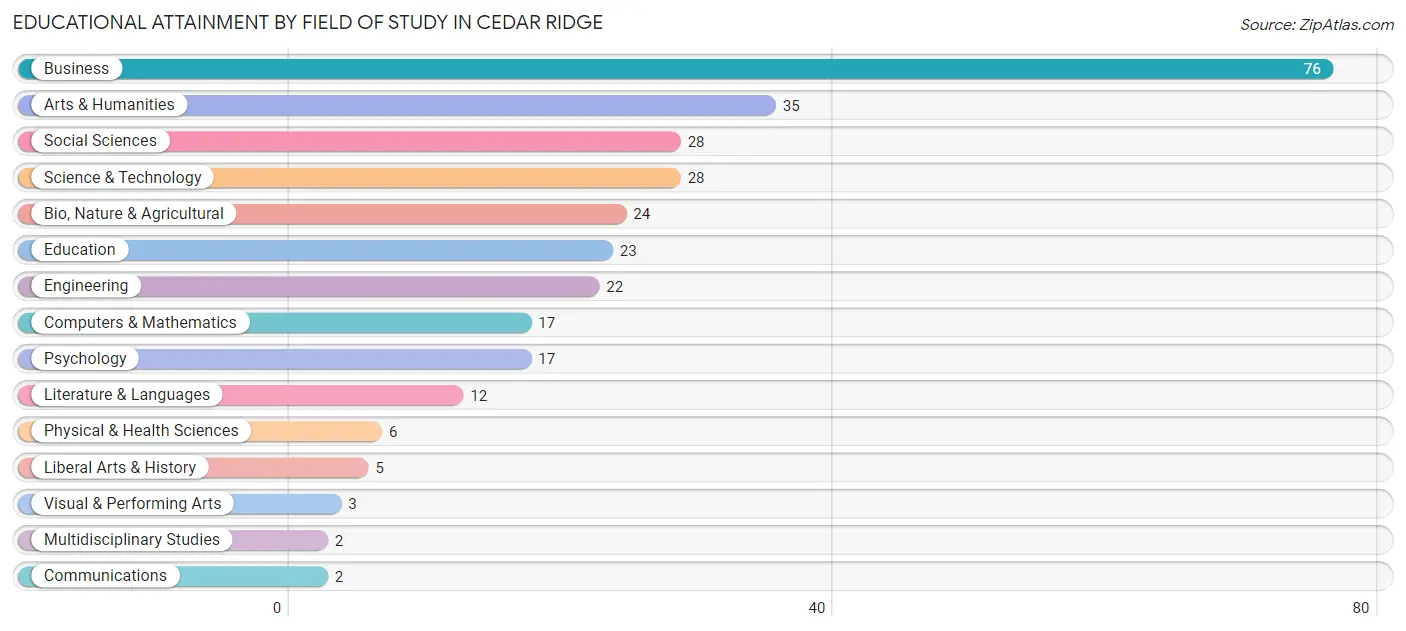
| Field of Study | # Graduates | % Graduates |
| Computers & Mathematics | 17 | 5.7% |
| Bio, Nature & Agricultural | 24 | 8.0% |
| Physical & Health Sciences | 6 | 2.0% |
| Psychology | 17 | 5.7% |
| Social Sciences | 28 | 9.3% |
| Engineering | 22 | 7.3% |
| Multidisciplinary Studies | 2 | 0.7% |
| Science & Technology | 28 | 9.3% |
| Business | 76 | 25.3% |
| Education | 23 | 7.7% |
| Literature & Languages | 12 | 4.0% |
| Liberal Arts & History | 5 | 1.7% |
| Visual & Performing Arts | 3 | 1.0% |
| Communications | 2 | 0.7% |
| Arts & Humanities | 35 | 11.7% |
| Total | 300 | 100.0% |
Transportation & Commute in Cedar Ridge
Vehicle Availability by Sex in Cedar Ridge
The most prevalent vehicle ownership categories in Cedar Ridge are males with 2 vehicles (122, accounting for 38.9%) and females with 2 vehicles (147, making up 38.6%).
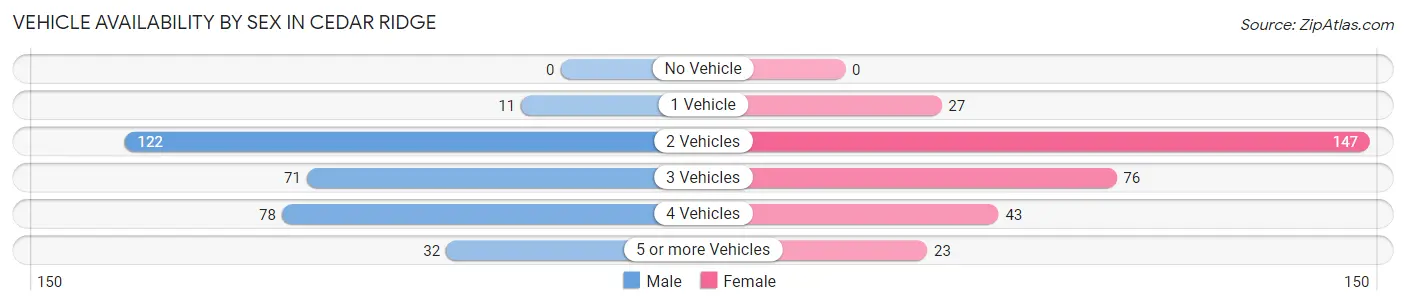
| Vehicles Available | Male | Female |
| No Vehicle | 0 (0.0%) | 0 (0.0%) |
| 1 Vehicle | 11 (3.5%) | 27 (8.5%) |
| 2 Vehicles | 122 (38.9%) | 147 (46.5%) |
| 3 Vehicles | 71 (22.6%) | 76 (24.0%) |
| 4 Vehicles | 78 (24.8%) | 43 (13.6%) |
| 5 or more Vehicles | 32 (10.2%) | 23 (7.3%) |
| Total | 314 (100.0%) | 316 (100.0%) |
Commute Time in Cedar Ridge
The most frequently occuring commute durations in Cedar Ridge are 25 to 29 minutes (152 commuters, 27.2%), 20 to 24 minutes (151 commuters, 27.1%), and 30 to 34 minutes (79 commuters, 14.2%).
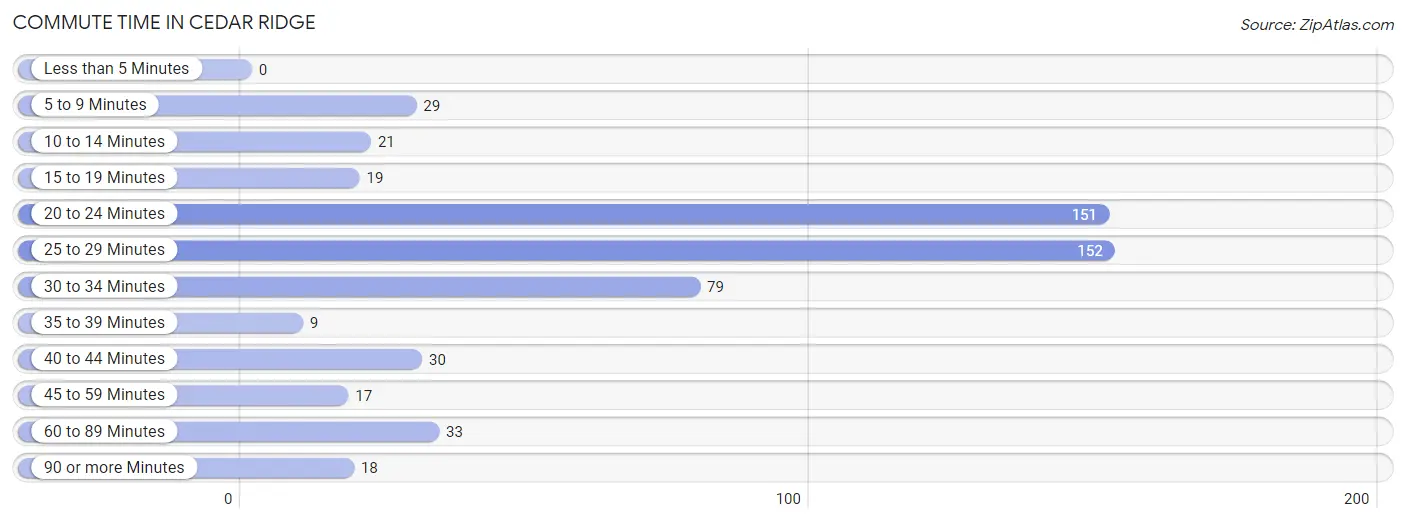
| Commute Time | # Commuters | % Commuters |
| Less than 5 Minutes | 0 | 0.0% |
| 5 to 9 Minutes | 29 | 5.2% |
| 10 to 14 Minutes | 21 | 3.8% |
| 15 to 19 Minutes | 19 | 3.4% |
| 20 to 24 Minutes | 151 | 27.1% |
| 25 to 29 Minutes | 152 | 27.2% |
| 30 to 34 Minutes | 79 | 14.2% |
| 35 to 39 Minutes | 9 | 1.6% |
| 40 to 44 Minutes | 30 | 5.4% |
| 45 to 59 Minutes | 17 | 3.0% |
| 60 to 89 Minutes | 33 | 5.9% |
| 90 or more Minutes | 18 | 3.2% |
Commute Time by Sex in Cedar Ridge
The most common commute times in Cedar Ridge are 25 to 29 minutes (84 commuters, 30.0%) for males and 20 to 24 minutes (98 commuters, 35.2%) for females.
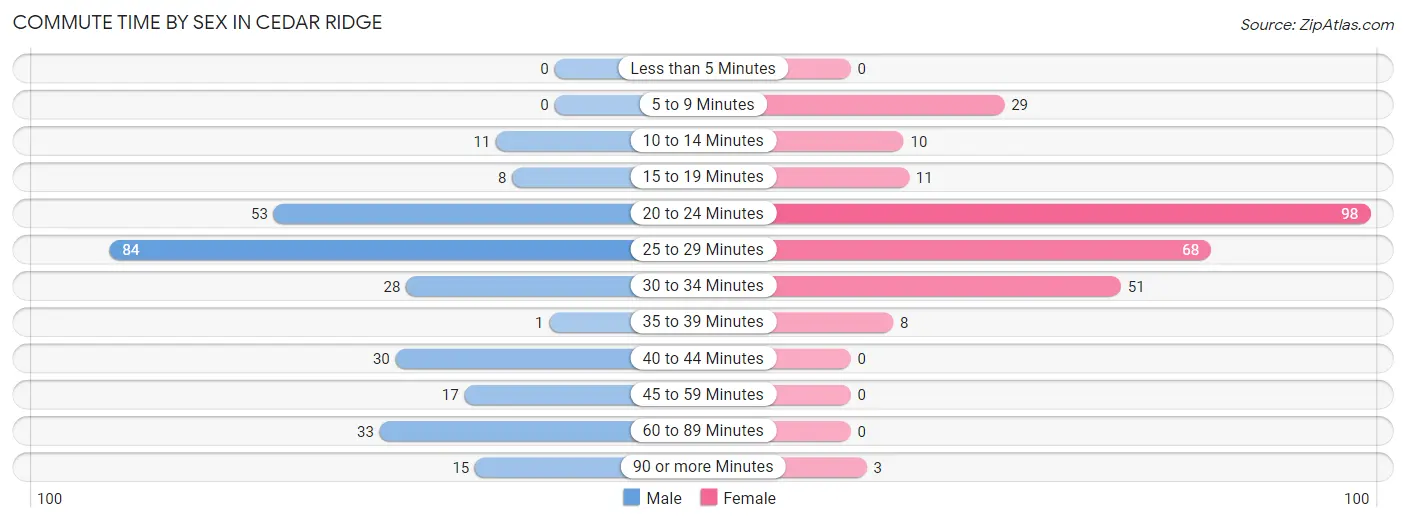
| Commute Time | Male | Female |
| Less than 5 Minutes | 0 (0.0%) | 0 (0.0%) |
| 5 to 9 Minutes | 0 (0.0%) | 29 (10.4%) |
| 10 to 14 Minutes | 11 (3.9%) | 10 (3.6%) |
| 15 to 19 Minutes | 8 (2.9%) | 11 (4.0%) |
| 20 to 24 Minutes | 53 (18.9%) | 98 (35.2%) |
| 25 to 29 Minutes | 84 (30.0%) | 68 (24.5%) |
| 30 to 34 Minutes | 28 (10.0%) | 51 (18.3%) |
| 35 to 39 Minutes | 1 (0.4%) | 8 (2.9%) |
| 40 to 44 Minutes | 30 (10.7%) | 0 (0.0%) |
| 45 to 59 Minutes | 17 (6.1%) | 0 (0.0%) |
| 60 to 89 Minutes | 33 (11.8%) | 0 (0.0%) |
| 90 or more Minutes | 15 (5.4%) | 3 (1.1%) |
Time of Departure to Work by Sex in Cedar Ridge
The most frequent times of departure to work in Cedar Ridge are 6:00 AM to 6:29 AM (75, 26.8%) for males and 7:30 AM to 7:59 AM (99, 35.6%) for females.
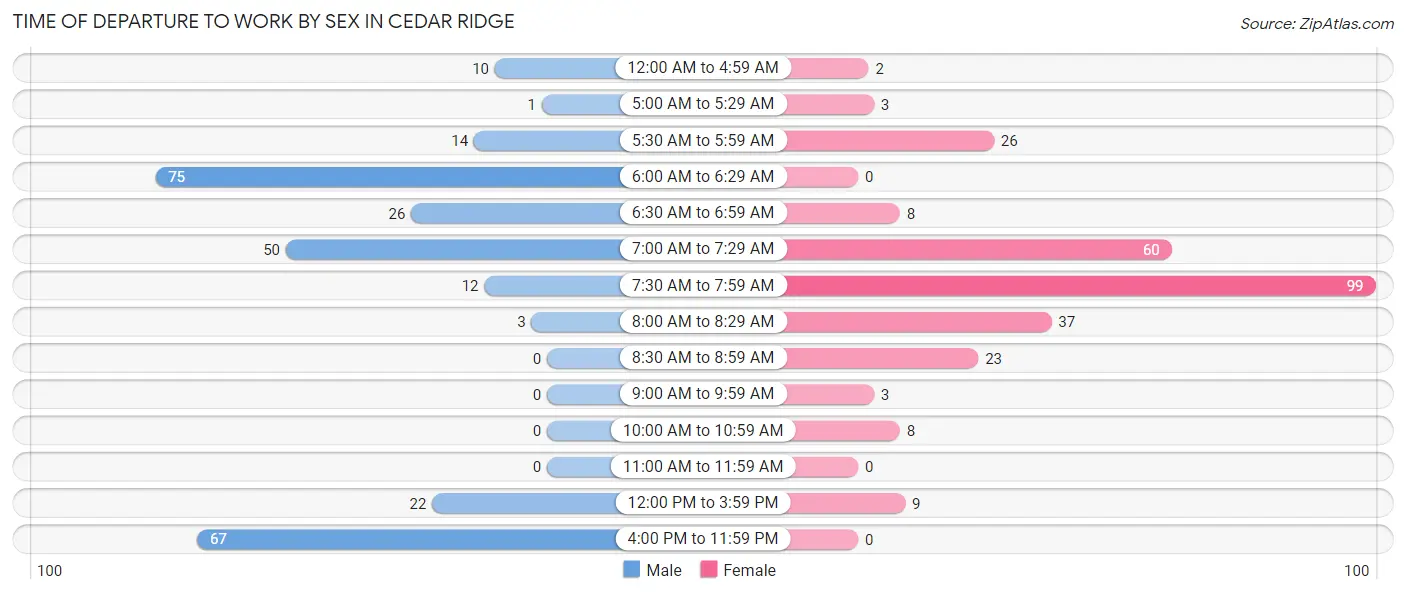
| Time of Departure | Male | Female |
| 12:00 AM to 4:59 AM | 10 (3.6%) | 2 (0.7%) |
| 5:00 AM to 5:29 AM | 1 (0.4%) | 3 (1.1%) |
| 5:30 AM to 5:59 AM | 14 (5.0%) | 26 (9.3%) |
| 6:00 AM to 6:29 AM | 75 (26.8%) | 0 (0.0%) |
| 6:30 AM to 6:59 AM | 26 (9.3%) | 8 (2.9%) |
| 7:00 AM to 7:29 AM | 50 (17.9%) | 60 (21.6%) |
| 7:30 AM to 7:59 AM | 12 (4.3%) | 99 (35.6%) |
| 8:00 AM to 8:29 AM | 3 (1.1%) | 37 (13.3%) |
| 8:30 AM to 8:59 AM | 0 (0.0%) | 23 (8.3%) |
| 9:00 AM to 9:59 AM | 0 (0.0%) | 3 (1.1%) |
| 10:00 AM to 10:59 AM | 0 (0.0%) | 8 (2.9%) |
| 11:00 AM to 11:59 AM | 0 (0.0%) | 0 (0.0%) |
| 12:00 PM to 3:59 PM | 22 (7.9%) | 9 (3.2%) |
| 4:00 PM to 11:59 PM | 67 (23.9%) | 0 (0.0%) |
| Total | 280 (100.0%) | 278 (100.0%) |
Housing Occupancy in Cedar Ridge
Occupancy by Ownership in Cedar Ridge
Of the total 672 dwellings in Cedar Ridge, owner-occupied units account for 586 (87.2%), while renter-occupied units make up 86 (12.8%).
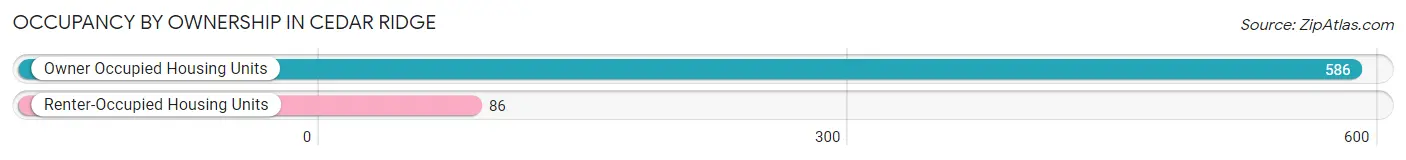
| Occupancy | # Housing Units | % Housing Units |
| Owner Occupied Housing Units | 586 | 87.2% |
| Renter-Occupied Housing Units | 86 | 12.8% |
| Total Occupied Housing Units | 672 | 100.0% |
Occupancy by Household Size in Cedar Ridge
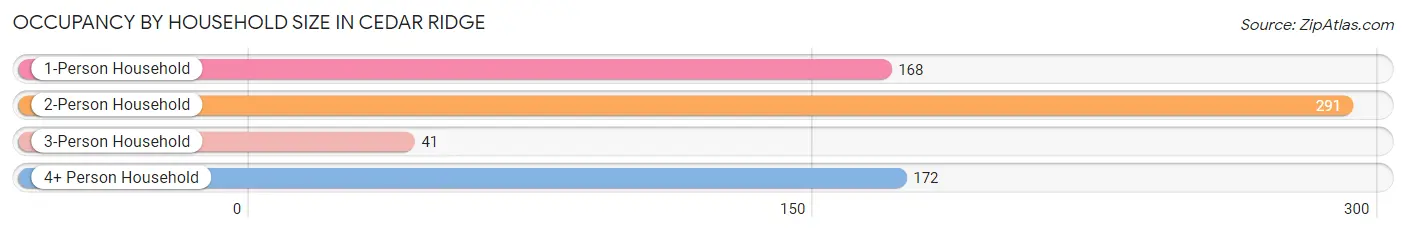
| Household Size | # Housing Units | % Housing Units |
| 1-Person Household | 168 | 25.0% |
| 2-Person Household | 291 | 43.3% |
| 3-Person Household | 41 | 6.1% |
| 4+ Person Household | 172 | 25.6% |
| Total Housing Units | 672 | 100.0% |
Occupancy by Ownership by Household Size in Cedar Ridge
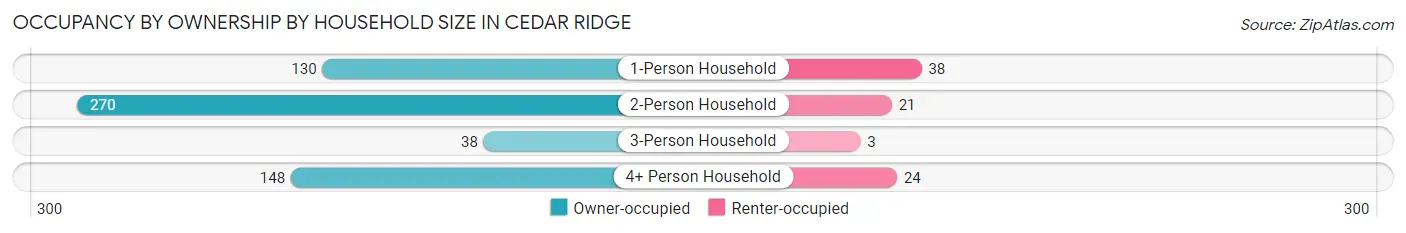
| Household Size | Owner-occupied | Renter-occupied |
| 1-Person Household | 130 (77.4%) | 38 (22.6%) |
| 2-Person Household | 270 (92.8%) | 21 (7.2%) |
| 3-Person Household | 38 (92.7%) | 3 (7.3%) |
| 4+ Person Household | 148 (86.1%) | 24 (14.0%) |
| Total Housing Units | 586 (87.2%) | 86 (12.8%) |
Occupancy by Educational Attainment in Cedar Ridge
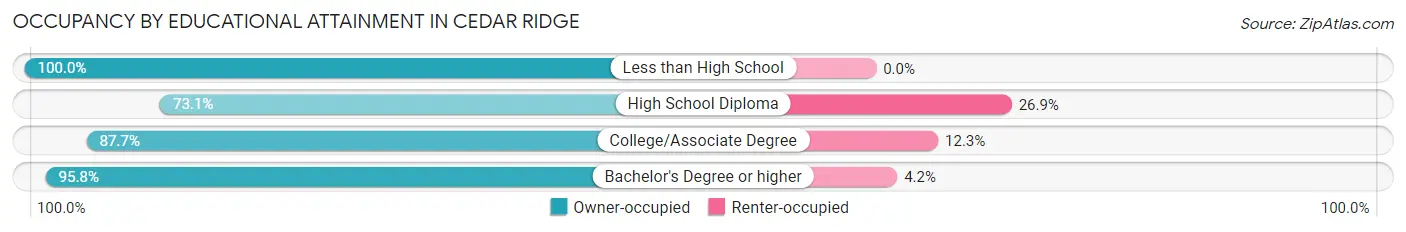
| Household Size | Owner-occupied | Renter-occupied |
| Less than High School | 4 (100.0%) | 0 (0.0%) |
| High School Diploma | 98 (73.1%) | 36 (26.9%) |
| College/Associate Degree | 300 (87.7%) | 42 (12.3%) |
| Bachelor's Degree or higher | 184 (95.8%) | 8 (4.2%) |
Occupancy by Age of Householder in Cedar Ridge
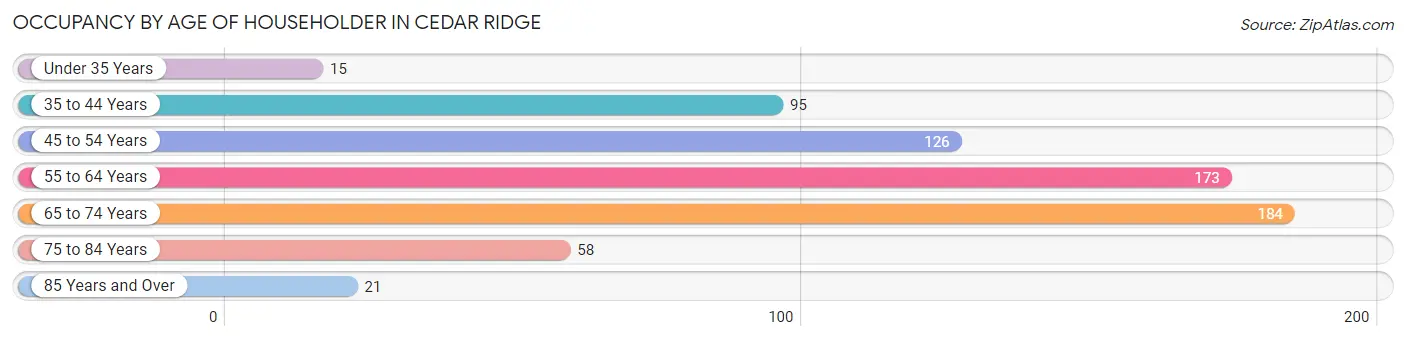
| Age Bracket | # Households | % Households |
| Under 35 Years | 15 | 2.2% |
| 35 to 44 Years | 95 | 14.1% |
| 45 to 54 Years | 126 | 18.8% |
| 55 to 64 Years | 173 | 25.7% |
| 65 to 74 Years | 184 | 27.4% |
| 75 to 84 Years | 58 | 8.6% |
| 85 Years and Over | 21 | 3.1% |
| Total | 672 | 100.0% |
Housing Finances in Cedar Ridge
Median Income by Occupancy in Cedar Ridge
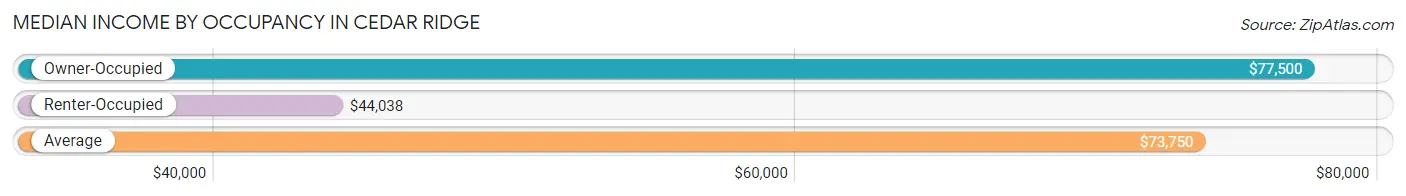
| Occupancy Type | # Households | Median Income |
| Owner-Occupied | 586 (87.2%) | $77,500 |
| Renter-Occupied | 86 (12.8%) | $44,038 |
| Average | 672 (100.0%) | $73,750 |
Occupancy by Householder Income Bracket in Cedar Ridge
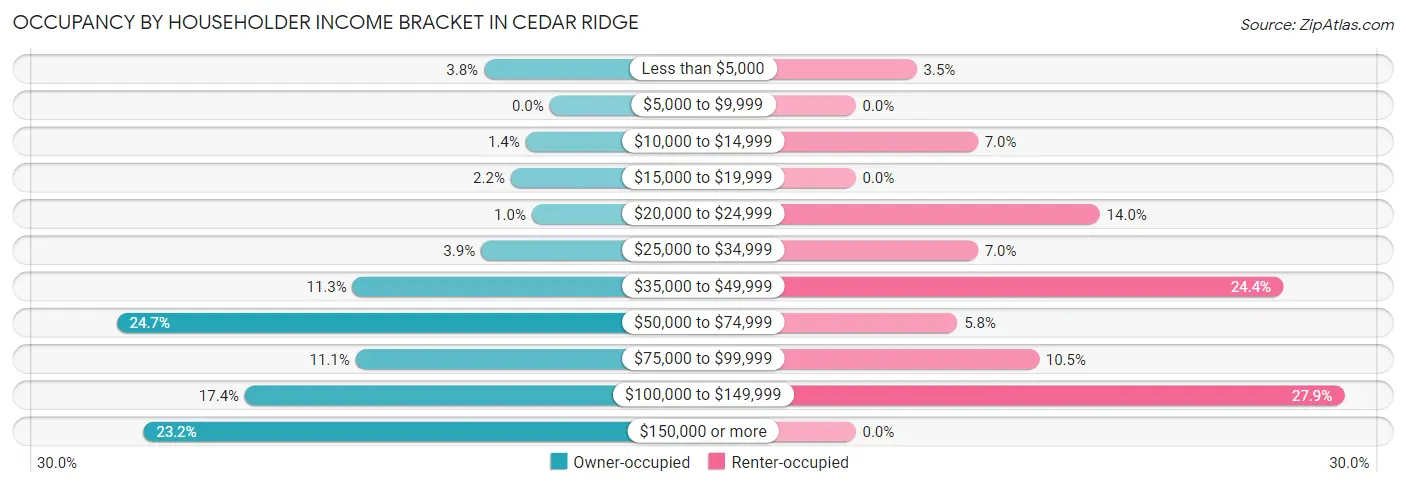
| Income Bracket | Owner-occupied | Renter-occupied |
| Less than $5,000 | 22 (3.7%) | 3 (3.5%) |
| $5,000 to $9,999 | 0 (0.0%) | 0 (0.0%) |
| $10,000 to $14,999 | 8 (1.4%) | 6 (7.0%) |
| $15,000 to $19,999 | 13 (2.2%) | 0 (0.0%) |
| $20,000 to $24,999 | 6 (1.0%) | 12 (14.0%) |
| $25,000 to $34,999 | 23 (3.9%) | 6 (7.0%) |
| $35,000 to $49,999 | 66 (11.3%) | 21 (24.4%) |
| $50,000 to $74,999 | 145 (24.7%) | 5 (5.8%) |
| $75,000 to $99,999 | 65 (11.1%) | 9 (10.5%) |
| $100,000 to $149,999 | 102 (17.4%) | 24 (27.9%) |
| $150,000 or more | 136 (23.2%) | 0 (0.0%) |
| Total | 586 (100.0%) | 86 (100.0%) |
Monthly Housing Cost Tiers in Cedar Ridge
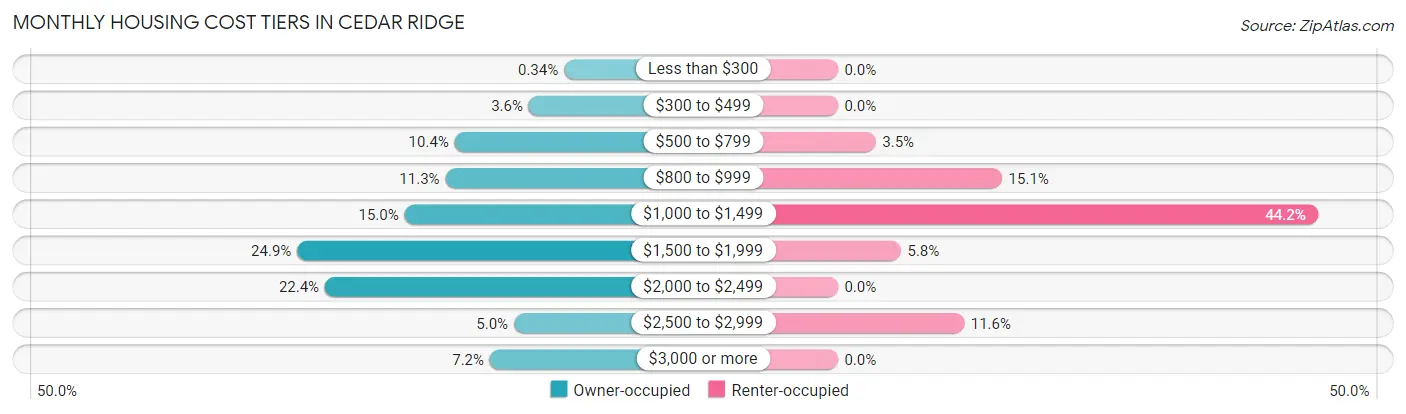
| Monthly Cost | Owner-occupied | Renter-occupied |
| Less than $300 | 2 (0.3%) | 0 (0.0%) |
| $300 to $499 | 21 (3.6%) | 0 (0.0%) |
| $500 to $799 | 61 (10.4%) | 3 (3.5%) |
| $800 to $999 | 66 (11.3%) | 13 (15.1%) |
| $1,000 to $1,499 | 88 (15.0%) | 38 (44.2%) |
| $1,500 to $1,999 | 146 (24.9%) | 5 (5.8%) |
| $2,000 to $2,499 | 131 (22.4%) | 0 (0.0%) |
| $2,500 to $2,999 | 29 (5.0%) | 10 (11.6%) |
| $3,000 or more | 42 (7.2%) | 0 (0.0%) |
| Total | 586 (100.0%) | 86 (100.0%) |
Physical Housing Characteristics in Cedar Ridge
Housing Structures in Cedar Ridge
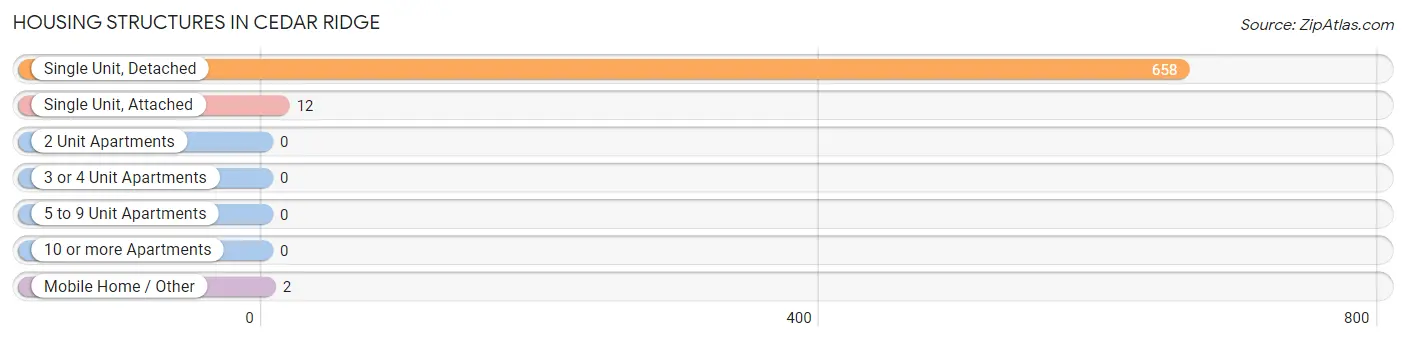
| Structure Type | # Housing Units | % Housing Units |
| Single Unit, Detached | 658 | 97.9% |
| Single Unit, Attached | 12 | 1.8% |
| 2 Unit Apartments | 0 | 0.0% |
| 3 or 4 Unit Apartments | 0 | 0.0% |
| 5 to 9 Unit Apartments | 0 | 0.0% |
| 10 or more Apartments | 0 | 0.0% |
| Mobile Home / Other | 2 | 0.3% |
| Total | 672 | 100.0% |
Housing Structures by Occupancy in Cedar Ridge
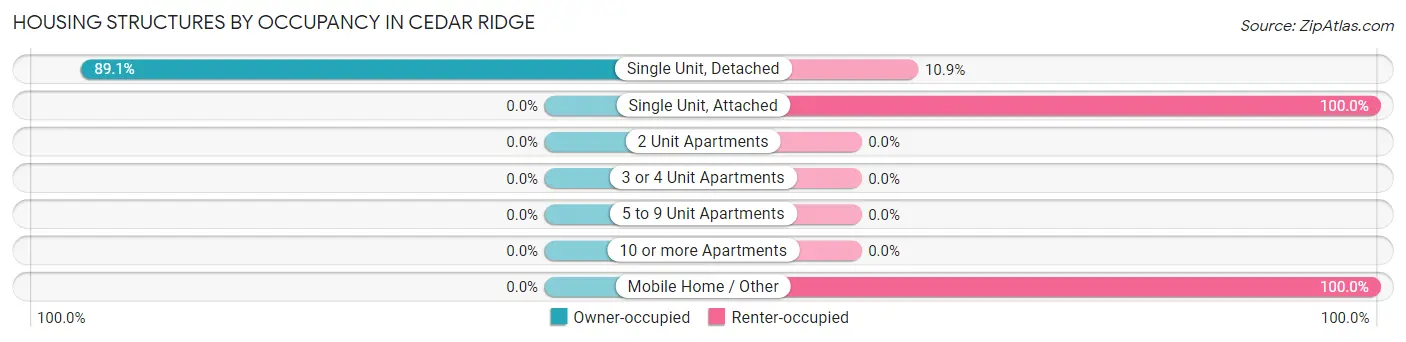
| Structure Type | Owner-occupied | Renter-occupied |
| Single Unit, Detached | 586 (89.1%) | 72 (10.9%) |
| Single Unit, Attached | 0 (0.0%) | 12 (100.0%) |
| 2 Unit Apartments | 0 (0.0%) | 0 (0.0%) |
| 3 or 4 Unit Apartments | 0 (0.0%) | 0 (0.0%) |
| 5 to 9 Unit Apartments | 0 (0.0%) | 0 (0.0%) |
| 10 or more Apartments | 0 (0.0%) | 0 (0.0%) |
| Mobile Home / Other | 0 (0.0%) | 2 (100.0%) |
| Total | 586 (87.2%) | 86 (12.8%) |
Housing Structures by Number of Rooms in Cedar Ridge
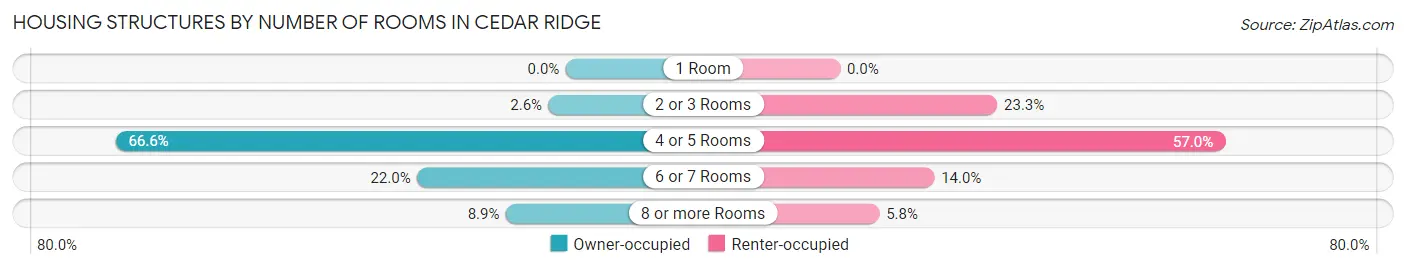
| Number of Rooms | Owner-occupied | Renter-occupied |
| 1 Room | 0 (0.0%) | 0 (0.0%) |
| 2 or 3 Rooms | 15 (2.6%) | 20 (23.3%) |
| 4 or 5 Rooms | 390 (66.5%) | 49 (57.0%) |
| 6 or 7 Rooms | 129 (22.0%) | 12 (14.0%) |
| 8 or more Rooms | 52 (8.9%) | 5 (5.8%) |
| Total | 586 (100.0%) | 86 (100.0%) |
Housing Structure by Heating Type in Cedar Ridge
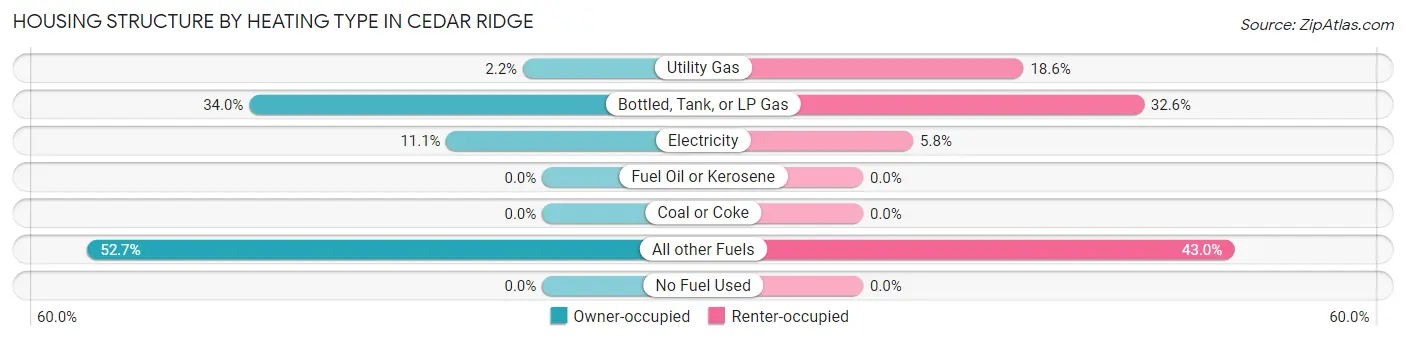
| Heating Type | Owner-occupied | Renter-occupied |
| Utility Gas | 13 (2.2%) | 16 (18.6%) |
| Bottled, Tank, or LP Gas | 199 (34.0%) | 28 (32.6%) |
| Electricity | 65 (11.1%) | 5 (5.8%) |
| Fuel Oil or Kerosene | 0 (0.0%) | 0 (0.0%) |
| Coal or Coke | 0 (0.0%) | 0 (0.0%) |
| All other Fuels | 309 (52.7%) | 37 (43.0%) |
| No Fuel Used | 0 (0.0%) | 0 (0.0%) |
| Total | 586 (100.0%) | 86 (100.0%) |
Household Vehicle Usage in Cedar Ridge
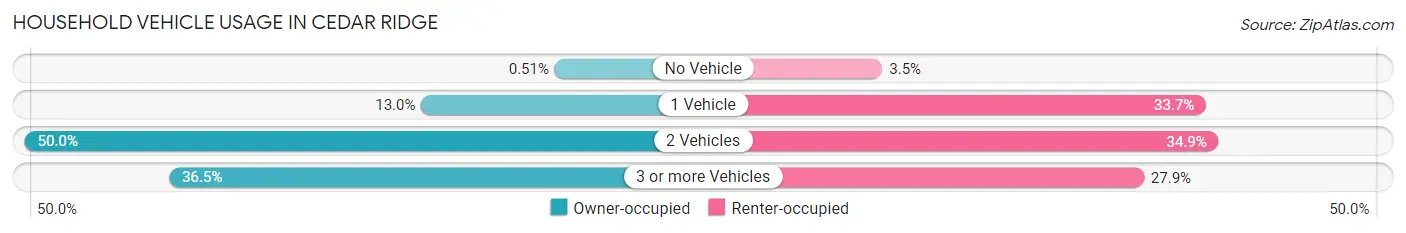
| Vehicles per Household | Owner-occupied | Renter-occupied |
| No Vehicle | 3 (0.5%) | 3 (3.5%) |
| 1 Vehicle | 76 (13.0%) | 29 (33.7%) |
| 2 Vehicles | 293 (50.0%) | 30 (34.9%) |
| 3 or more Vehicles | 214 (36.5%) | 24 (27.9%) |
| Total | 586 (100.0%) | 86 (100.0%) |
Real Estate & Mortgages in Cedar Ridge
Real Estate and Mortgage Overview in Cedar Ridge
| Characteristic | Without Mortgage | With Mortgage |
| Housing Units | 170 | 416 |
| Median Property Value | $368,400 | $343,400 |
| Median Household Income | $84,444 | $84 |
| Monthly Housing Costs | $839 | $42 |
| Real Estate Taxes | $2,667 | $0 |
Property Value by Mortgage Status in Cedar Ridge
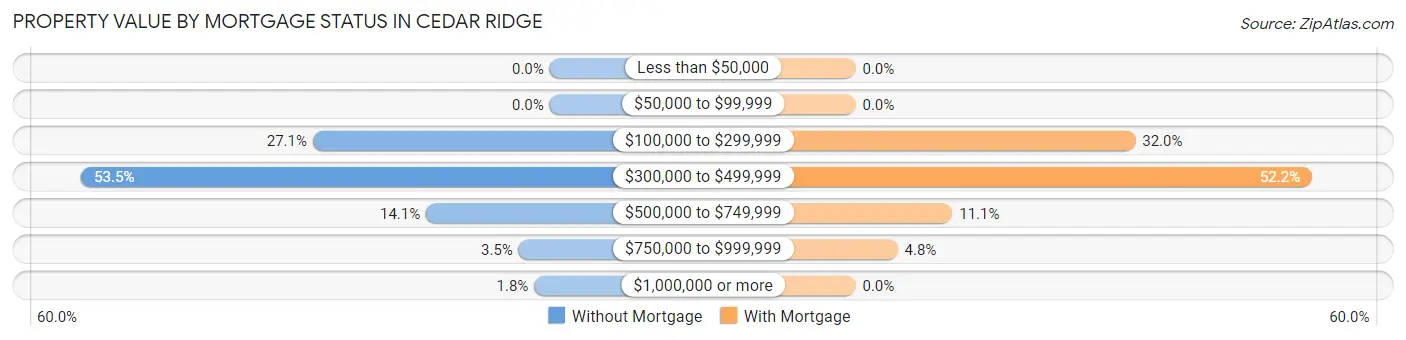
| Property Value | Without Mortgage | With Mortgage |
| Less than $50,000 | 0 (0.0%) | 0 (0.0%) |
| $50,000 to $99,999 | 0 (0.0%) | 0 (0.0%) |
| $100,000 to $299,999 | 46 (27.1%) | 133 (32.0%) |
| $300,000 to $499,999 | 91 (53.5%) | 217 (52.2%) |
| $500,000 to $749,999 | 24 (14.1%) | 46 (11.1%) |
| $750,000 to $999,999 | 6 (3.5%) | 20 (4.8%) |
| $1,000,000 or more | 3 (1.8%) | 0 (0.0%) |
| Total | 170 (100.0%) | 416 (100.0%) |
Household Income by Mortgage Status in Cedar Ridge
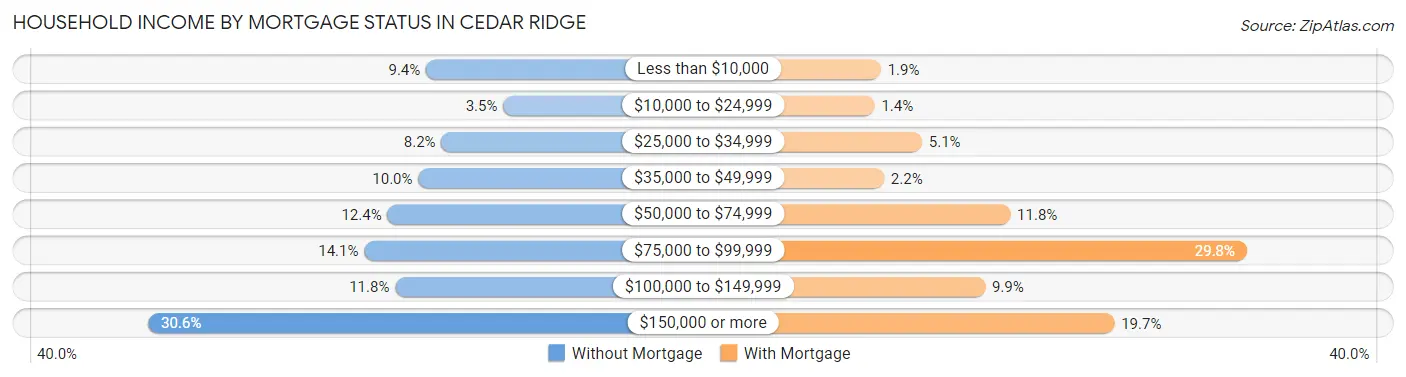
| Household Income | Without Mortgage | With Mortgage |
| Less than $10,000 | 16 (9.4%) | 8 (1.9%) |
| $10,000 to $24,999 | 6 (3.5%) | 6 (1.4%) |
| $25,000 to $34,999 | 14 (8.2%) | 21 (5.1%) |
| $35,000 to $49,999 | 17 (10.0%) | 9 (2.2%) |
| $50,000 to $74,999 | 21 (12.3%) | 49 (11.8%) |
| $75,000 to $99,999 | 24 (14.1%) | 124 (29.8%) |
| $100,000 to $149,999 | 20 (11.8%) | 41 (9.9%) |
| $150,000 or more | 52 (30.6%) | 82 (19.7%) |
| Total | 170 (100.0%) | 416 (100.0%) |
Property Value to Household Income Ratio in Cedar Ridge
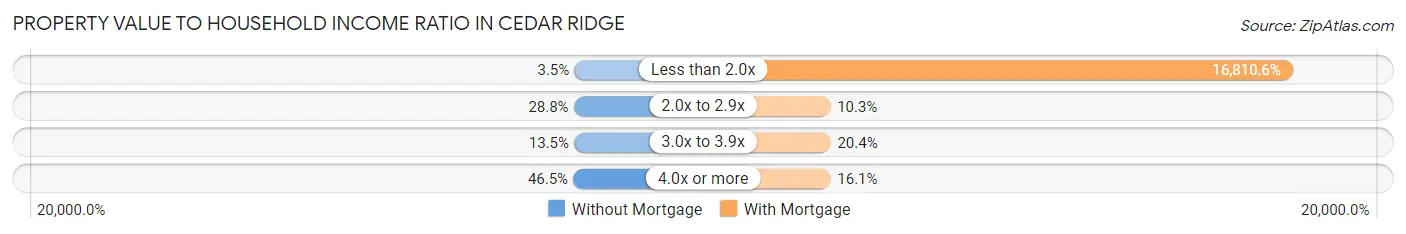
| Value-to-Income Ratio | Without Mortgage | With Mortgage |
| Less than 2.0x | 6 (3.5%) | 69,932 (16,810.6%) |
| 2.0x to 2.9x | 49 (28.8%) | 43 (10.3%) |
| 3.0x to 3.9x | 23 (13.5%) | 85 (20.4%) |
| 4.0x or more | 79 (46.5%) | 67 (16.1%) |
| Total | 170 (100.0%) | 416 (100.0%) |
Real Estate Taxes by Mortgage Status in Cedar Ridge
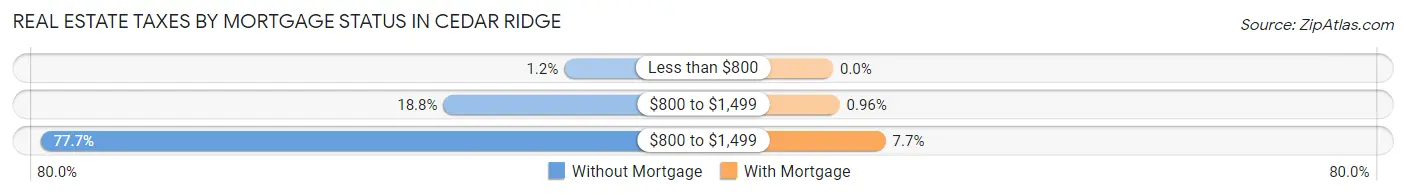
| Property Taxes | Without Mortgage | With Mortgage |
| Less than $800 | 2 (1.2%) | 0 (0.0%) |
| $800 to $1,499 | 32 (18.8%) | 4 (1.0%) |
| $800 to $1,499 | 132 (77.6%) | 32 (7.7%) |
| Total | 170 (100.0%) | 416 (100.0%) |
Health & Disability in Cedar Ridge
Health Insurance Coverage by Age in Cedar Ridge
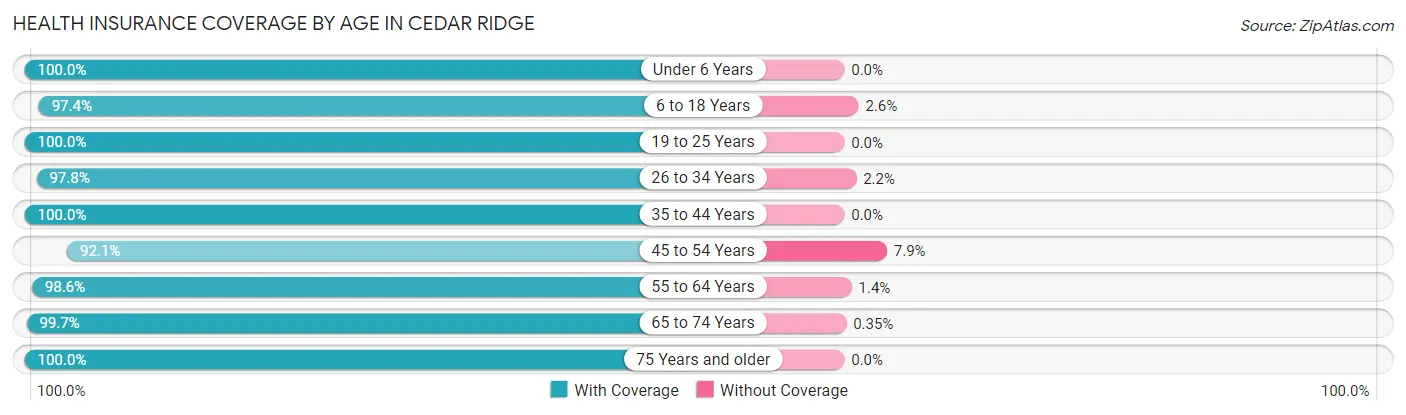
| Age Bracket | With Coverage | Without Coverage |
| Under 6 Years | 88 (100.0%) | 0 (0.0%) |
| 6 to 18 Years | 295 (97.4%) | 8 (2.6%) |
| 19 to 25 Years | 96 (100.0%) | 0 (0.0%) |
| 26 to 34 Years | 44 (97.8%) | 1 (2.2%) |
| 35 to 44 Years | 194 (100.0%) | 0 (0.0%) |
| 45 to 54 Years | 209 (92.1%) | 18 (7.9%) |
| 55 to 64 Years | 290 (98.6%) | 4 (1.4%) |
| 65 to 74 Years | 283 (99.7%) | 1 (0.4%) |
| 75 Years and older | 116 (100.0%) | 0 (0.0%) |
| Total | 1,615 (98.1%) | 32 (1.9%) |
Health Insurance Coverage by Citizenship Status in Cedar Ridge
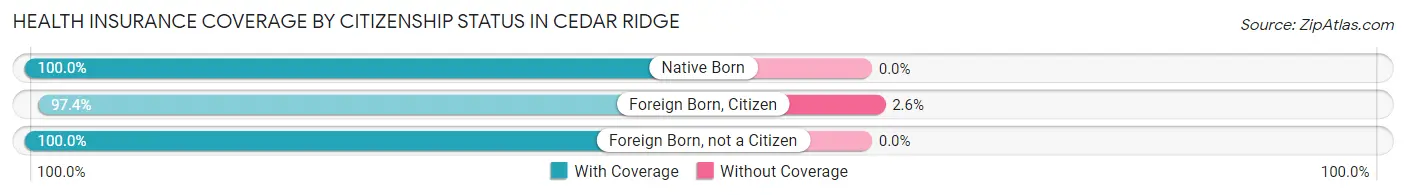
| Citizenship Status | With Coverage | Without Coverage |
| Native Born | 88 (100.0%) | 0 (0.0%) |
| Foreign Born, Citizen | 295 (97.4%) | 8 (2.6%) |
| Foreign Born, not a Citizen | 96 (100.0%) | 0 (0.0%) |
Health Insurance Coverage by Household Income in Cedar Ridge
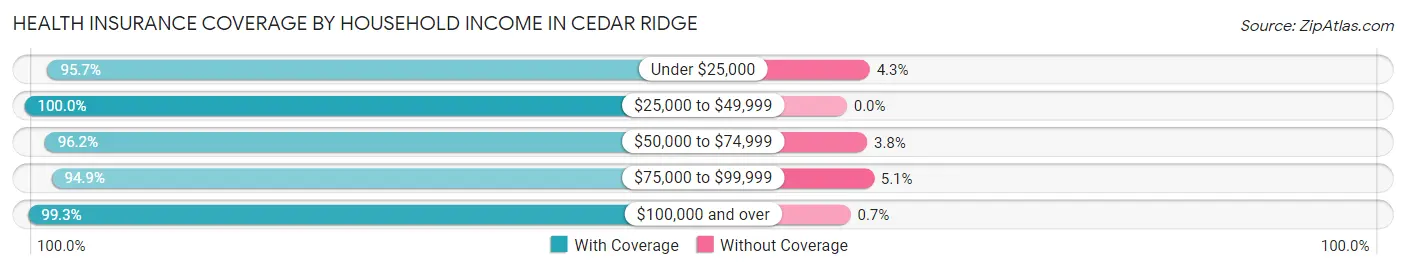
| Household Income | With Coverage | Without Coverage |
| Under $25,000 | 89 (95.7%) | 4 (4.3%) |
| $25,000 to $49,999 | 174 (100.0%) | 0 (0.0%) |
| $50,000 to $74,999 | 355 (96.2%) | 14 (3.8%) |
| $75,000 to $99,999 | 150 (94.9%) | 8 (5.1%) |
| $100,000 and over | 847 (99.3%) | 6 (0.7%) |
Public vs Private Health Insurance Coverage by Age in Cedar Ridge
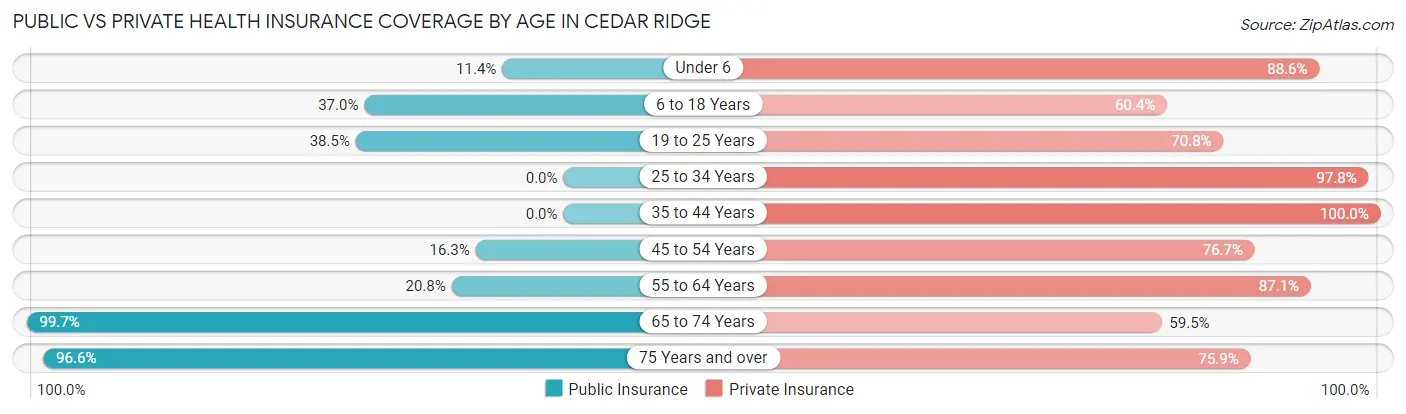
| Age Bracket | Public Insurance | Private Insurance |
| Under 6 | 10 (11.4%) | 78 (88.6%) |
| 6 to 18 Years | 112 (37.0%) | 183 (60.4%) |
| 19 to 25 Years | 37 (38.5%) | 68 (70.8%) |
| 25 to 34 Years | 0 (0.0%) | 44 (97.8%) |
| 35 to 44 Years | 0 (0.0%) | 194 (100.0%) |
| 45 to 54 Years | 37 (16.3%) | 174 (76.6%) |
| 55 to 64 Years | 61 (20.7%) | 256 (87.1%) |
| 65 to 74 Years | 283 (99.7%) | 169 (59.5%) |
| 75 Years and over | 112 (96.6%) | 88 (75.9%) |
| Total | 652 (39.6%) | 1,254 (76.1%) |
Disability Status by Sex by Age in Cedar Ridge
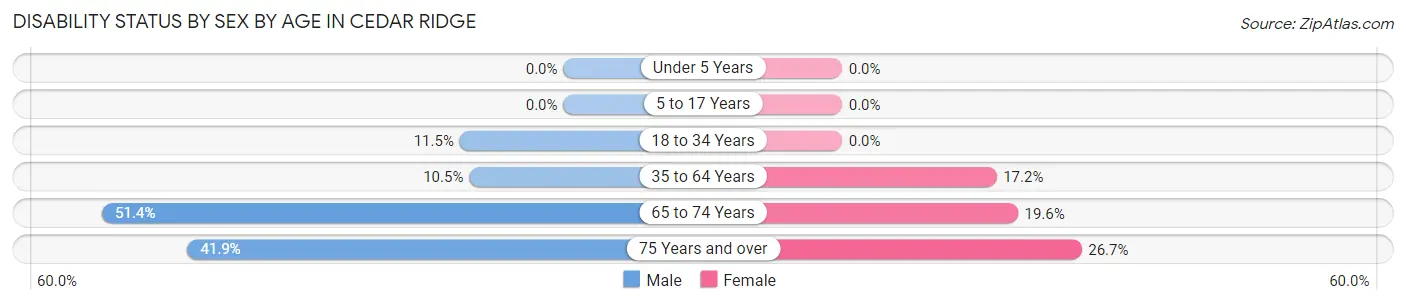
| Age Bracket | Male | Female |
| Under 5 Years | 0 (0.0%) | 0 (0.0%) |
| 5 to 17 Years | 0 (0.0%) | 0 (0.0%) |
| 18 to 34 Years | 9 (11.5%) | 0 (0.0%) |
| 35 to 64 Years | 39 (10.5%) | 59 (17.2%) |
| 65 to 74 Years | 75 (51.4%) | 27 (19.6%) |
| 75 Years and over | 36 (41.9%) | 8 (26.7%) |
Disability Class by Sex by Age in Cedar Ridge
Disability Class: Hearing Difficulty
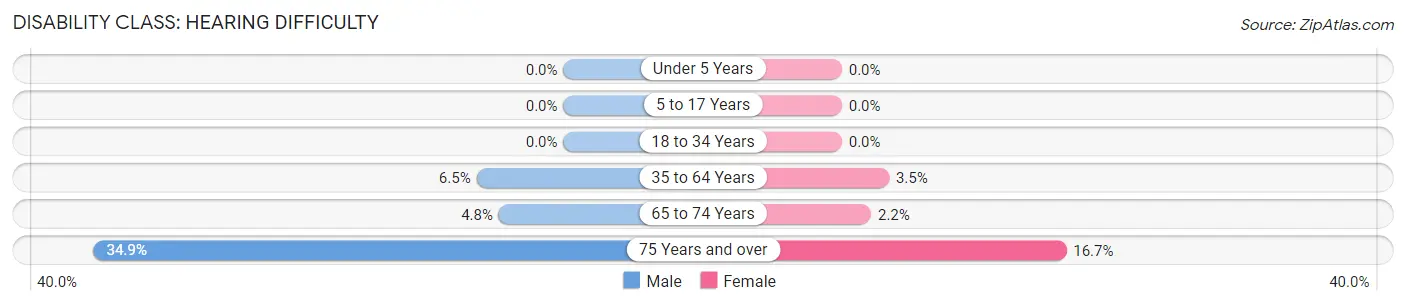
| Age Bracket | Male | Female |
| Under 5 Years | 0 (0.0%) | 0 (0.0%) |
| 5 to 17 Years | 0 (0.0%) | 0 (0.0%) |
| 18 to 34 Years | 0 (0.0%) | 0 (0.0%) |
| 35 to 64 Years | 24 (6.5%) | 12 (3.5%) |
| 65 to 74 Years | 7 (4.8%) | 3 (2.2%) |
| 75 Years and over | 30 (34.9%) | 5 (16.7%) |
Disability Class: Vision Difficulty
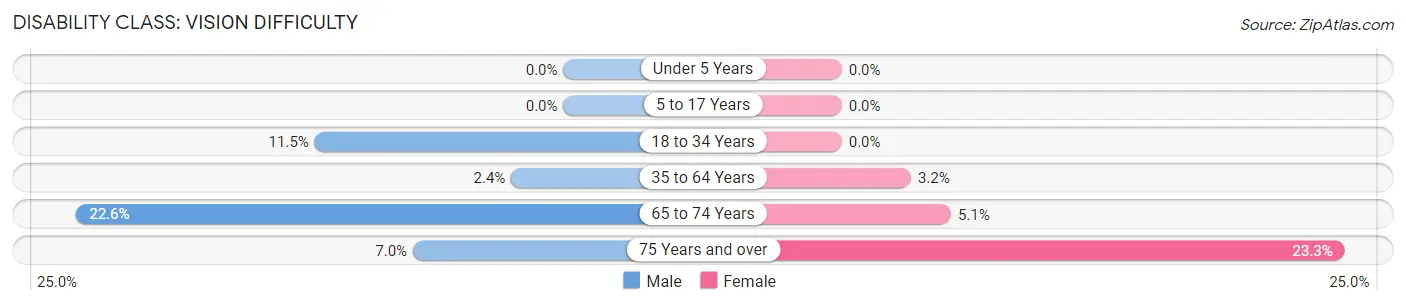
| Age Bracket | Male | Female |
| Under 5 Years | 0 (0.0%) | 0 (0.0%) |
| 5 to 17 Years | 0 (0.0%) | 0 (0.0%) |
| 18 to 34 Years | 9 (11.5%) | 0 (0.0%) |
| 35 to 64 Years | 9 (2.4%) | 11 (3.2%) |
| 65 to 74 Years | 33 (22.6%) | 7 (5.1%) |
| 75 Years and over | 6 (7.0%) | 7 (23.3%) |
Disability Class: Cognitive Difficulty
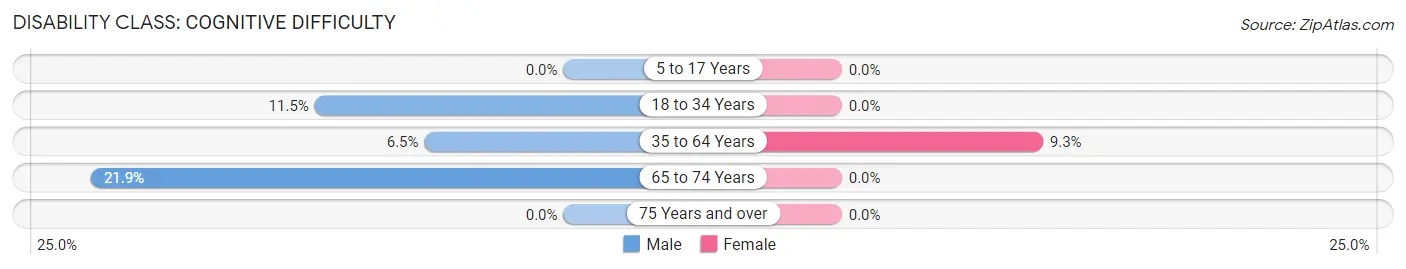
| Age Bracket | Male | Female |
| 5 to 17 Years | 0 (0.0%) | 0 (0.0%) |
| 18 to 34 Years | 9 (11.5%) | 0 (0.0%) |
| 35 to 64 Years | 24 (6.5%) | 32 (9.3%) |
| 65 to 74 Years | 32 (21.9%) | 0 (0.0%) |
| 75 Years and over | 0 (0.0%) | 0 (0.0%) |
Disability Class: Ambulatory Difficulty
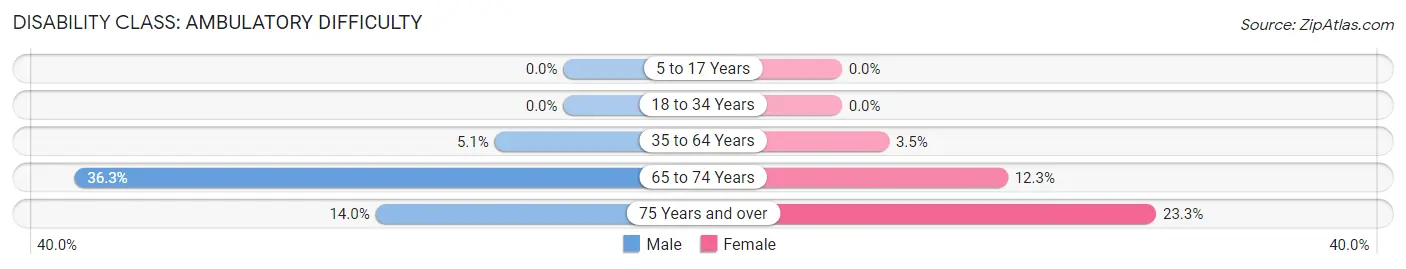
| Age Bracket | Male | Female |
| 5 to 17 Years | 0 (0.0%) | 0 (0.0%) |
| 18 to 34 Years | 0 (0.0%) | 0 (0.0%) |
| 35 to 64 Years | 19 (5.1%) | 12 (3.5%) |
| 65 to 74 Years | 53 (36.3%) | 17 (12.3%) |
| 75 Years and over | 12 (14.0%) | 7 (23.3%) |
Disability Class: Self-Care Difficulty
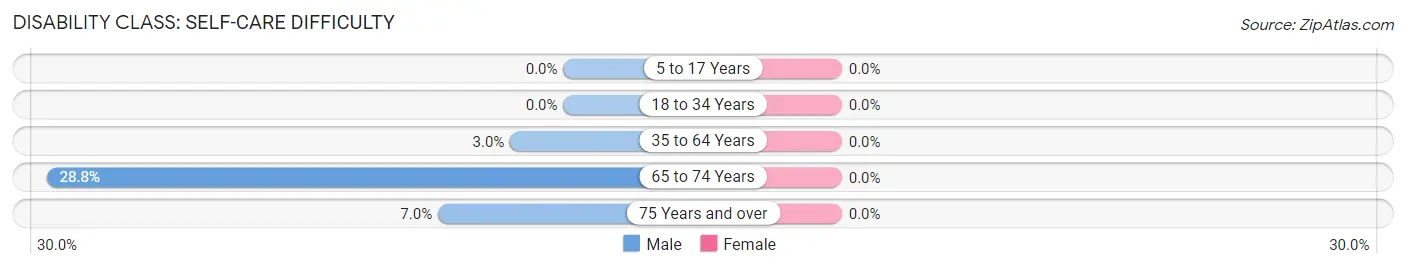
| Age Bracket | Male | Female |
| 5 to 17 Years | 0 (0.0%) | 0 (0.0%) |
| 18 to 34 Years | 0 (0.0%) | 0 (0.0%) |
| 35 to 64 Years | 11 (3.0%) | 0 (0.0%) |
| 65 to 74 Years | 42 (28.8%) | 0 (0.0%) |
| 75 Years and over | 6 (7.0%) | 0 (0.0%) |
Technology Access in Cedar Ridge
Computing Device Access in Cedar Ridge
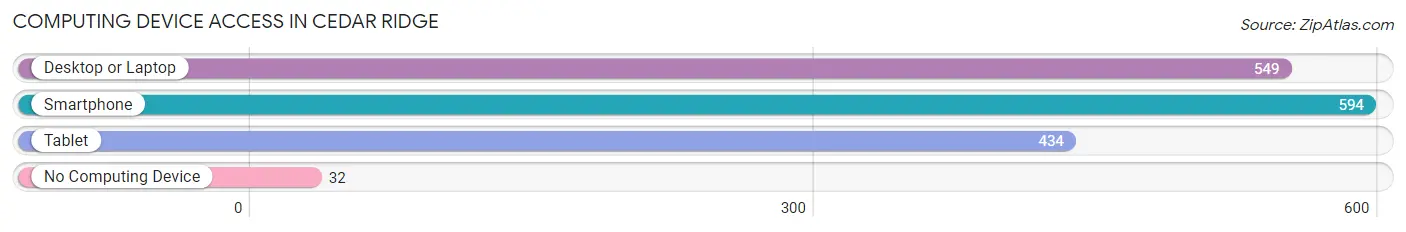
| Device Type | # Households | % Households |
| Desktop or Laptop | 549 | 81.7% |
| Smartphone | 594 | 88.4% |
| Tablet | 434 | 64.6% |
| No Computing Device | 32 | 4.8% |
| Total | 672 | 100.0% |
Internet Access in Cedar Ridge
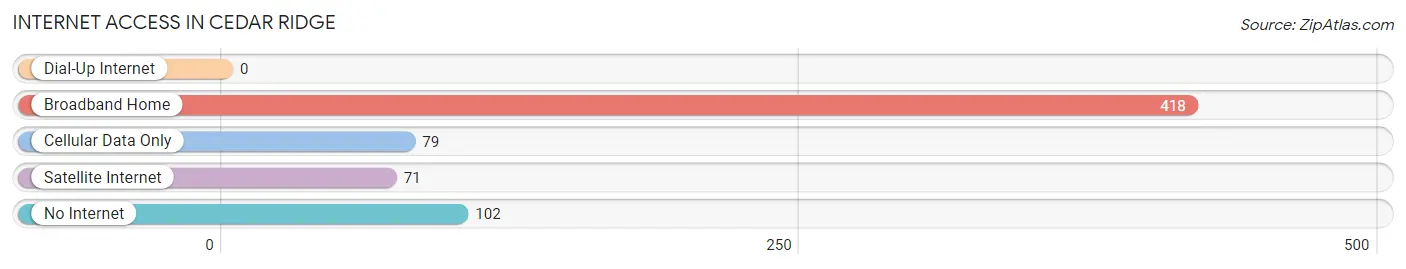
| Internet Type | # Households | % Households |
| Dial-Up Internet | 0 | 0.0% |
| Broadband Home | 418 | 62.2% |
| Cellular Data Only | 79 | 11.8% |
| Satellite Internet | 71 | 10.6% |
| No Internet | 102 | 15.2% |
| Total | 672 | 100.0% |
Cedar Ridge Summary
Cedar Ridge is a small unincorporated community located in the Sierra Nevada foothills of El Dorado County, California. It is situated at an elevation of 2,400 feet (732 m) and is located approximately 25 miles (40 km) east of Placerville and 40 miles (64 km) northeast of Sacramento. The population of Cedar Ridge was estimated to be 1,845 in 2019.
History
The area now known as Cedar Ridge was originally inhabited by the Miwok and Maidu Native American tribes. The first European settlers arrived in the area in the mid-1800s, and the town of Cedar Ridge was established in 1856. The town was named after the abundance of cedar trees in the area.
In the late 1800s, the town became a popular destination for gold miners and loggers. The town was also home to a number of sawmills and lumber mills. In the early 1900s, the town began to decline as the gold rush ended and the logging industry moved elsewhere.
Geography
Cedar Ridge is located in the Sierra Nevada foothills of El Dorado County, California. It is situated at an elevation of 2,400 feet (732 m) and is located approximately 25 miles (40 km) east of Placerville and 40 miles (64 km) northeast of Sacramento.
The town is surrounded by the Eldorado National Forest and is located near the South Fork of the American River. The area is known for its rolling hills, oak woodlands, and pine forests.
Economy
Cedar Ridge is a small, rural community with a limited economy. The town is home to a few small businesses, including a general store, a gas station, and a few restaurants.
The town is also home to a number of wineries and vineyards, as well as a number of apple orchards. The area is also known for its outdoor recreation opportunities, including hiking, camping, fishing, and hunting.
Demographics
As of 2019, the population of Cedar Ridge was estimated to be 1,845. The town is predominantly white (93.3%), with a small Hispanic population (3.2%). The median household income in Cedar Ridge is $60,000, and the median home value is $400,000.
The town is served by the El Dorado County School District, which includes two elementary schools, one middle school, and one high school. The town is also home to a number of churches, including the Cedar Ridge Community Church.
Common Questions
What is Per Capita Income in Cedar Ridge?
Per Capita income in Cedar Ridge is $39,037.
What is the Median Family Income in Cedar Ridge?
Median Family Income in Cedar Ridge is $99,643.
What is the Median Household income in Cedar Ridge?
Median Household Income in Cedar Ridge is $73,750.
What is Income or Wage Gap in Cedar Ridge?
Income or Wage Gap in Cedar Ridge is 23.0%.
Women in Cedar Ridge earn 77.0 cents for every dollar earned by a man.
What is Inequality or Gini Index in Cedar Ridge?
Inequality or Gini Index in Cedar Ridge is 0.41.
What is the Total Population of Cedar Ridge?
Total Population of Cedar Ridge is 1,650.
What is the Total Male Population of Cedar Ridge?
Total Male Population of Cedar Ridge is 855.
What is the Total Female Population of Cedar Ridge?
Total Female Population of Cedar Ridge is 795.
What is the Ratio of Males per 100 Females in Cedar Ridge?
There are 107.55 Males per 100 Females in Cedar Ridge.
What is the Ratio of Females per 100 Males in Cedar Ridge?
There are 92.98 Females per 100 Males in Cedar Ridge.
What is the Median Population Age in Cedar Ridge?
Median Population Age in Cedar Ridge is 47.6 Years.
What is the Average Family Size in Cedar Ridge
Average Family Size in Cedar Ridge is 2.9 People.
What is the Average Household Size in Cedar Ridge
Average Household Size in Cedar Ridge is 2.5 People.
How Large is the Labor Force in Cedar Ridge?
There are 742 People in the Labor Forcein in Cedar Ridge.
What is the Percentage of People in the Labor Force in Cedar Ridge?
57.0% of People are in the Labor Force in Cedar Ridge.
What is the Unemployment Rate in Cedar Ridge?
Unemployment Rate in Cedar Ridge is 6.4%.