Orcutt, CA Map & Demographics
Orcutt Map
Orcutt Overview
$46,586
PER CAPITA INCOME
$121,215
AVG FAMILY INCOME
$108,225
AVG HOUSEHOLD INCOME
41.5%
WAGE / INCOME GAP [ % ]
58.5¢/ $1
WAGE / INCOME GAP [ $ ]
0.41
INEQUALITY / GINI INDEX
31,137
TOTAL POPULATION
15,869
MALE POPULATION
15,268
FEMALE POPULATION
103.94
MALES / 100 FEMALES
96.21
FEMALES / 100 MALES
40.0
MEDIAN AGE
3.2
AVG FAMILY SIZE
2.8
AVG HOUSEHOLD SIZE
15,143
LABOR FORCE [ PEOPLE ]
60.4%
PERCENT IN LABOR FORCE
4.2%
UNEMPLOYMENT RATE
Orcutt Area Codes
Income in Orcutt
Income Overview in Orcutt
Per Capita Income in Orcutt is $46,586, while median incomes of families and households are $121,215 and $108,225 respectively.
| Characteristic | Number | Measure |
| Per Capita Income | 31,137 | $46,586 |
| Median Family Income | 8,467 | $121,215 |
| Mean Family Income | 8,467 | $143,286 |
| Median Household Income | 11,180 | $108,225 |
| Mean Household Income | 11,180 | $128,706 |
| Income Deficit | 8,467 | $0 |
| Wage / Income Gap (%) | 31,137 | 41.48% |
| Wage / Income Gap ($) | 31,137 | 58.52¢ per $1 |
| Gini / Inequality Index | 31,137 | 0.41 |
Earnings by Sex in Orcutt
Average Earnings in Orcutt are $52,880, $67,616 for men and $39,570 for women, a difference of 41.5%.
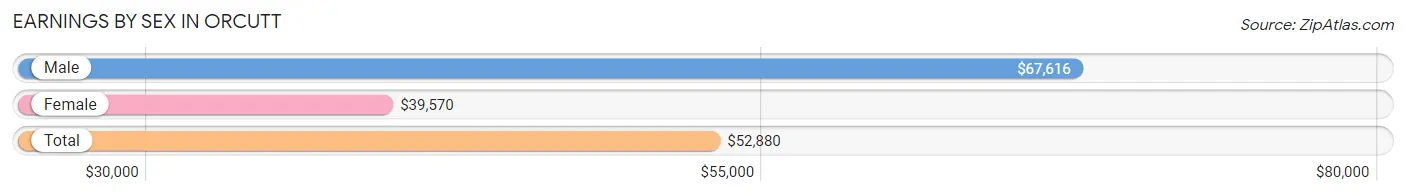
| Sex | Number | Average Earnings |
| Male | 8,705 (55.0%) | $67,616 |
| Female | 7,114 (45.0%) | $39,570 |
| Total | 15,819 (100.0%) | $52,880 |
Earnings by Sex by Income Bracket in Orcutt
The most common earnings brackets in Orcutt are $100,000+ for men (2,605 | 29.9%) and $100,000+ for women (1,004 | 14.1%).
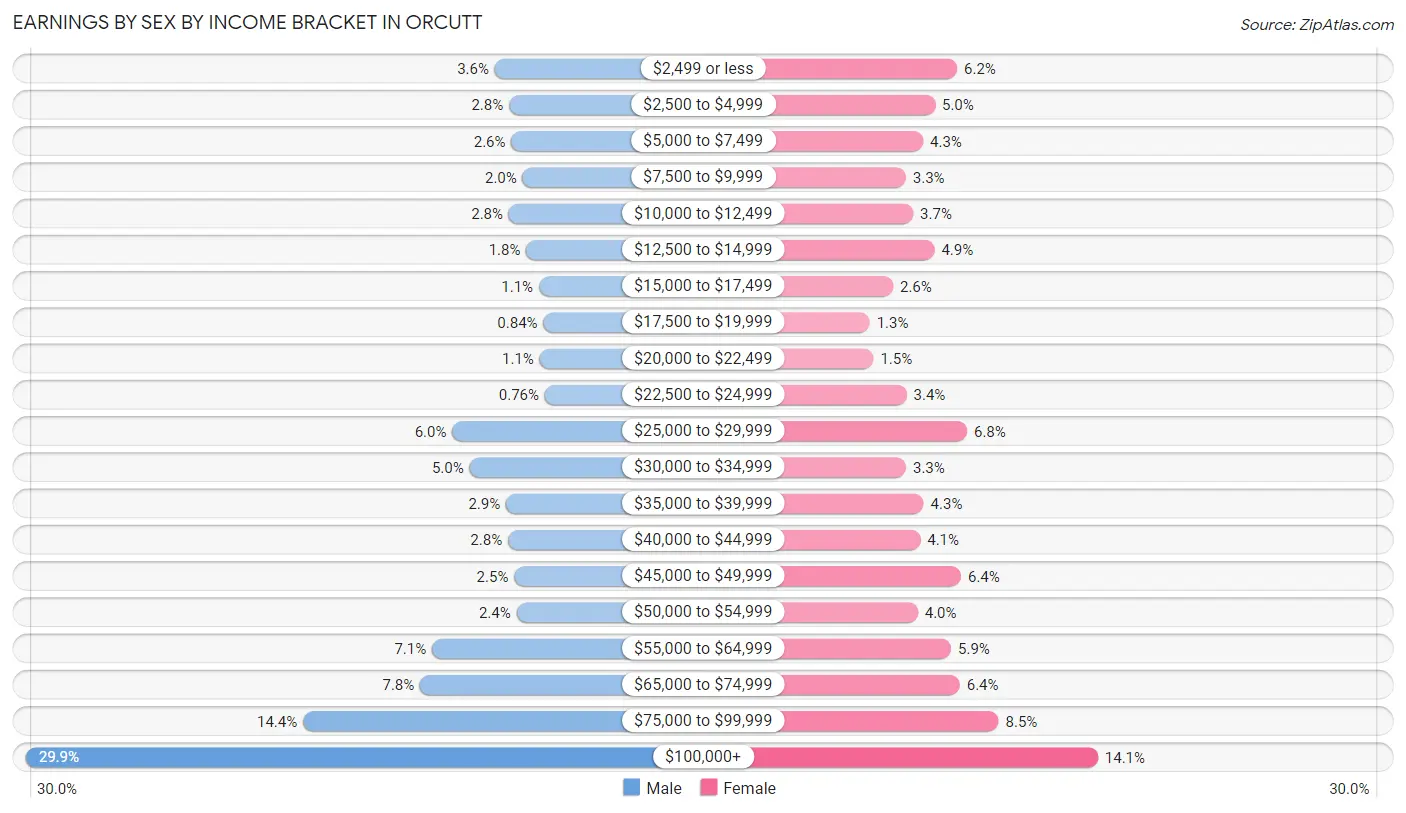
| Income | Male | Female |
| $2,499 or less | 311 (3.6%) | 441 (6.2%) |
| $2,500 to $4,999 | 241 (2.8%) | 353 (5.0%) |
| $5,000 to $7,499 | 230 (2.6%) | 305 (4.3%) |
| $7,500 to $9,999 | 175 (2.0%) | 236 (3.3%) |
| $10,000 to $12,499 | 242 (2.8%) | 265 (3.7%) |
| $12,500 to $14,999 | 157 (1.8%) | 351 (4.9%) |
| $15,000 to $17,499 | 95 (1.1%) | 185 (2.6%) |
| $17,500 to $19,999 | 73 (0.8%) | 92 (1.3%) |
| $20,000 to $22,499 | 91 (1.1%) | 107 (1.5%) |
| $22,500 to $24,999 | 66 (0.8%) | 239 (3.4%) |
| $25,000 to $29,999 | 519 (6.0%) | 481 (6.8%) |
| $30,000 to $34,999 | 434 (5.0%) | 237 (3.3%) |
| $35,000 to $39,999 | 256 (2.9%) | 307 (4.3%) |
| $40,000 to $44,999 | 246 (2.8%) | 294 (4.1%) |
| $45,000 to $49,999 | 216 (2.5%) | 457 (6.4%) |
| $50,000 to $54,999 | 205 (2.4%) | 284 (4.0%) |
| $55,000 to $64,999 | 618 (7.1%) | 417 (5.9%) |
| $65,000 to $74,999 | 676 (7.8%) | 452 (6.4%) |
| $75,000 to $99,999 | 1,249 (14.3%) | 607 (8.5%) |
| $100,000+ | 2,605 (29.9%) | 1,004 (14.1%) |
| Total | 8,705 (100.0%) | 7,114 (100.0%) |
Earnings by Sex by Educational Attainment in Orcutt
Average earnings in Orcutt are $78,660 for men and $45,915 for women, a difference of 41.6%. Men with an educational attainment of graduate degree enjoy the highest average annual earnings of $111,477, while those with high school diploma education earn the least with $60,434. Women with an educational attainment of graduate degree earn the most with the average annual earnings of $77,152, while those with high school diploma education have the smallest earnings of $28,789.
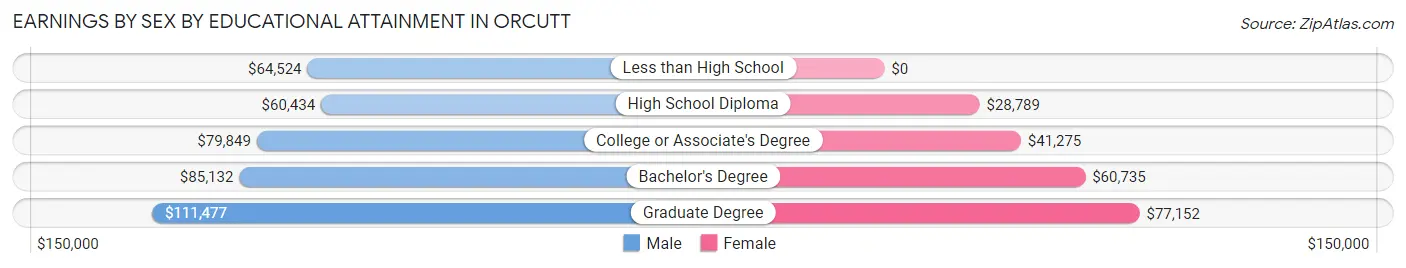
| Educational Attainment | Male Income | Female Income |
| Less than High School | $64,524 | $0 |
| High School Diploma | $60,434 | $28,789 |
| College or Associate's Degree | $79,849 | $41,275 |
| Bachelor's Degree | $85,132 | $60,735 |
| Graduate Degree | $111,477 | $77,152 |
| Total | $78,660 | $45,915 |
Family Income in Orcutt
Family Income Brackets in Orcutt
According to the Orcutt family income data, there are 2,481 families falling into the $100,000 to $149,999 income range, which is the most common income bracket and makes up 29.3% of all families. Conversely, the $10,000 to $14,999 income bracket is the least frequent group with only 34 families (0.4%) belonging to this category.
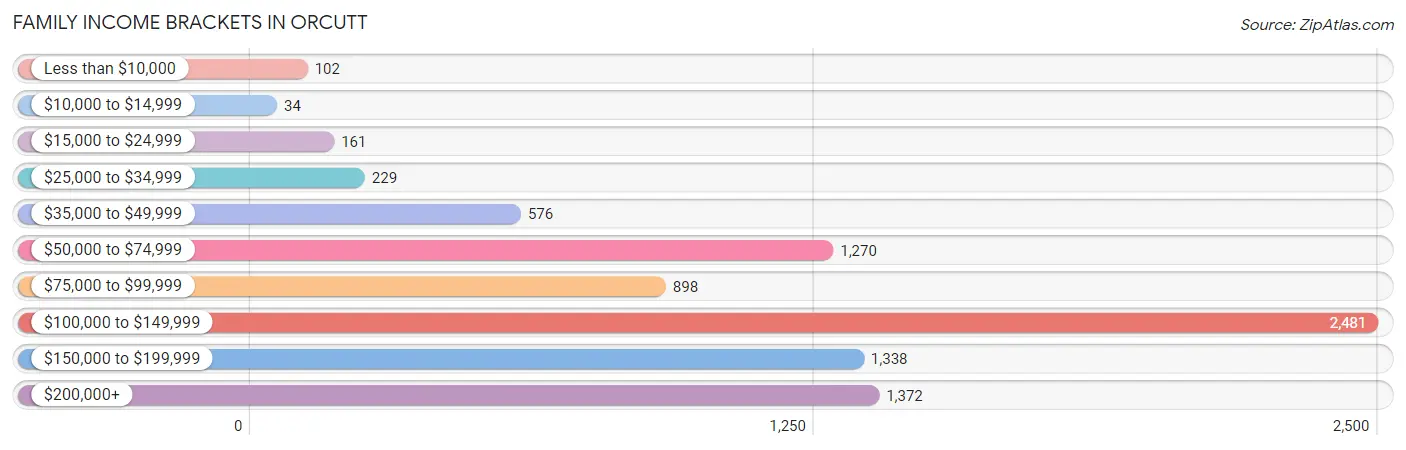
| Income Bracket | # Families | % Families |
| Less than $10,000 | 102 | 1.2% |
| $10,000 to $14,999 | 34 | 0.4% |
| $15,000 to $24,999 | 161 | 1.9% |
| $25,000 to $34,999 | 229 | 2.7% |
| $35,000 to $49,999 | 576 | 6.8% |
| $50,000 to $74,999 | 1,270 | 15.0% |
| $75,000 to $99,999 | 898 | 10.6% |
| $100,000 to $149,999 | 2,481 | 29.3% |
| $150,000 to $199,999 | 1,338 | 15.8% |
| $200,000+ | 1,372 | 16.2% |
Family Income by Famaliy Size in Orcutt
7+ person families (153 | 1.8%) account for the highest median family income in Orcutt with $148,238 per family, while 2-person families (3,781 | 44.7%) have the highest median income of $51,094 per family member.
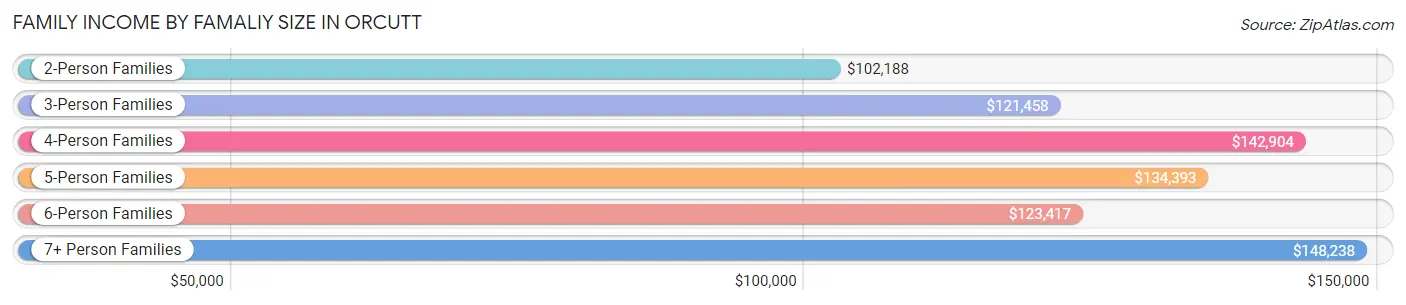
| Income Bracket | # Families | Median Income |
| 2-Person Families | 3,781 (44.7%) | $102,188 |
| 3-Person Families | 1,871 (22.1%) | $121,458 |
| 4-Person Families | 1,629 (19.2%) | $142,904 |
| 5-Person Families | 784 (9.3%) | $134,393 |
| 6-Person Families | 249 (2.9%) | $123,417 |
| 7+ Person Families | 153 (1.8%) | $148,238 |
| Total | 8,467 (100.0%) | $121,215 |
Family Income by Number of Earners in Orcutt
The median family income in Orcutt is $121,215, with families comprising 3+ earners (1,146) having the highest median family income of $161,471, while families with no earners (1,522) have the lowest median family income of $66,775, accounting for 13.5% and 18.0% of families, respectively.
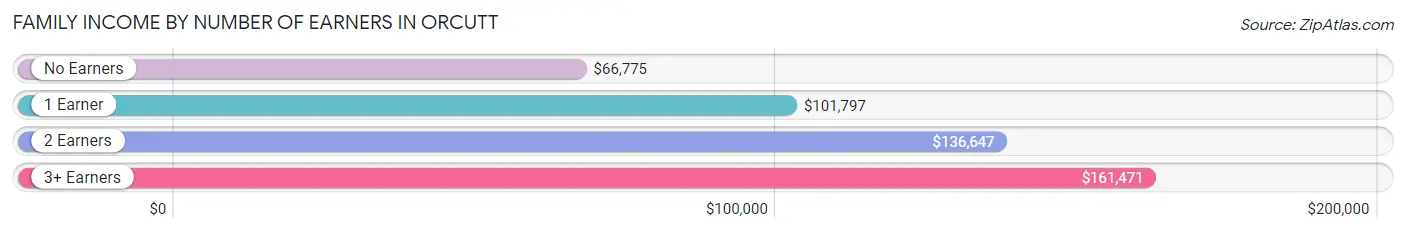
| Number of Earners | # Families | Median Income |
| No Earners | 1,522 (18.0%) | $66,775 |
| 1 Earner | 2,328 (27.5%) | $101,797 |
| 2 Earners | 3,471 (41.0%) | $136,647 |
| 3+ Earners | 1,146 (13.5%) | $161,471 |
| Total | 8,467 (100.0%) | $121,215 |
Household Income in Orcutt
Household Income Brackets in Orcutt
With 2,963 households falling in the category, the $100,000 to $149,999 income range is the most frequent in Orcutt, accounting for 26.5% of all households. In contrast, only 168 households (1.5%) fall into the less than $10,000 income bracket, making it the least populous group.
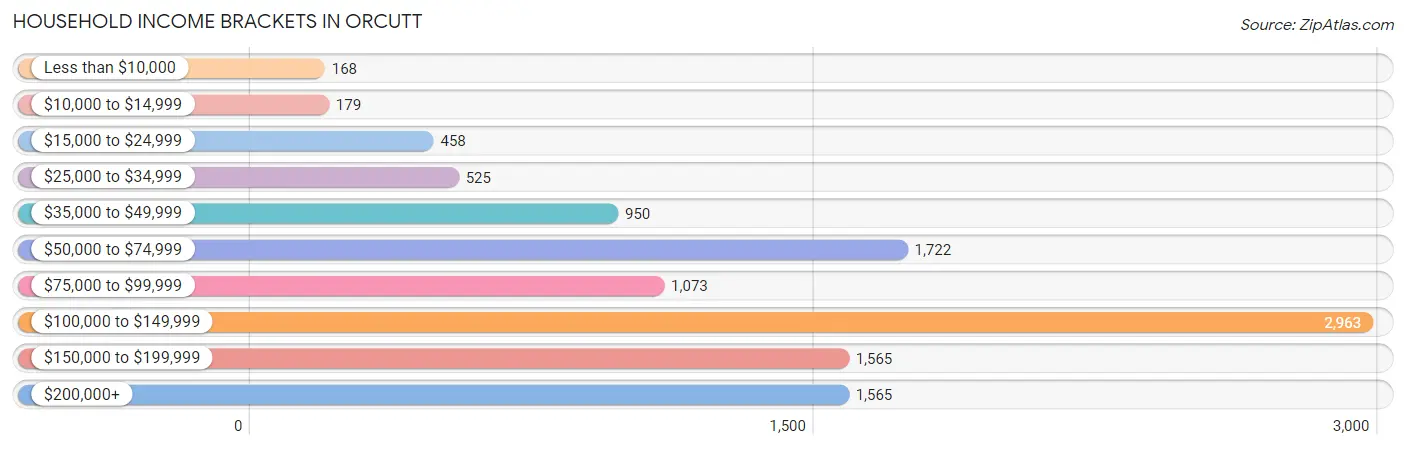
| Income Bracket | # Households | % Households |
| Less than $10,000 | 168 | 1.5% |
| $10,000 to $14,999 | 179 | 1.6% |
| $15,000 to $24,999 | 458 | 4.1% |
| $25,000 to $34,999 | 525 | 4.7% |
| $35,000 to $49,999 | 950 | 8.5% |
| $50,000 to $74,999 | 1,722 | 15.4% |
| $75,000 to $99,999 | 1,073 | 9.6% |
| $100,000 to $149,999 | 2,963 | 26.5% |
| $150,000 to $199,999 | 1,565 | 14.0% |
| $200,000+ | 1,565 | 14.0% |
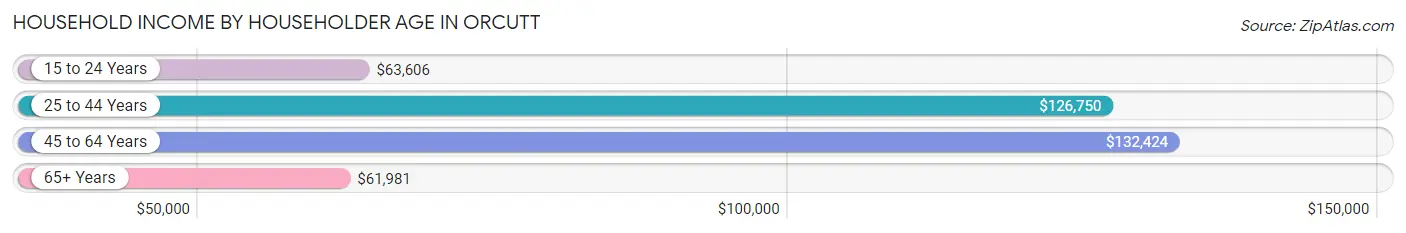
Household Income by Householder Age in Orcutt
The median household income in Orcutt is $108,225, with the highest median household income of $132,424 found in the 45 to 64 years age bracket for the primary householder. A total of 4,150 households (37.1%) fall into this category. Meanwhile, the 65+ years age bracket for the primary householder has the lowest median household income of $61,981, with 3,760 households (33.6%) in this group.
| Income Bracket | # Households | Median Income |
| 15 to 24 Years | 143 (1.3%) | $63,606 |
| 25 to 44 Years | 3,127 (28.0%) | $126,750 |
| 45 to 64 Years | 4,150 (37.1%) | $132,424 |
| 65+ Years | 3,760 (33.6%) | $61,981 |
| Total | 11,180 (100.0%) | $108,225 |
Poverty in Orcutt
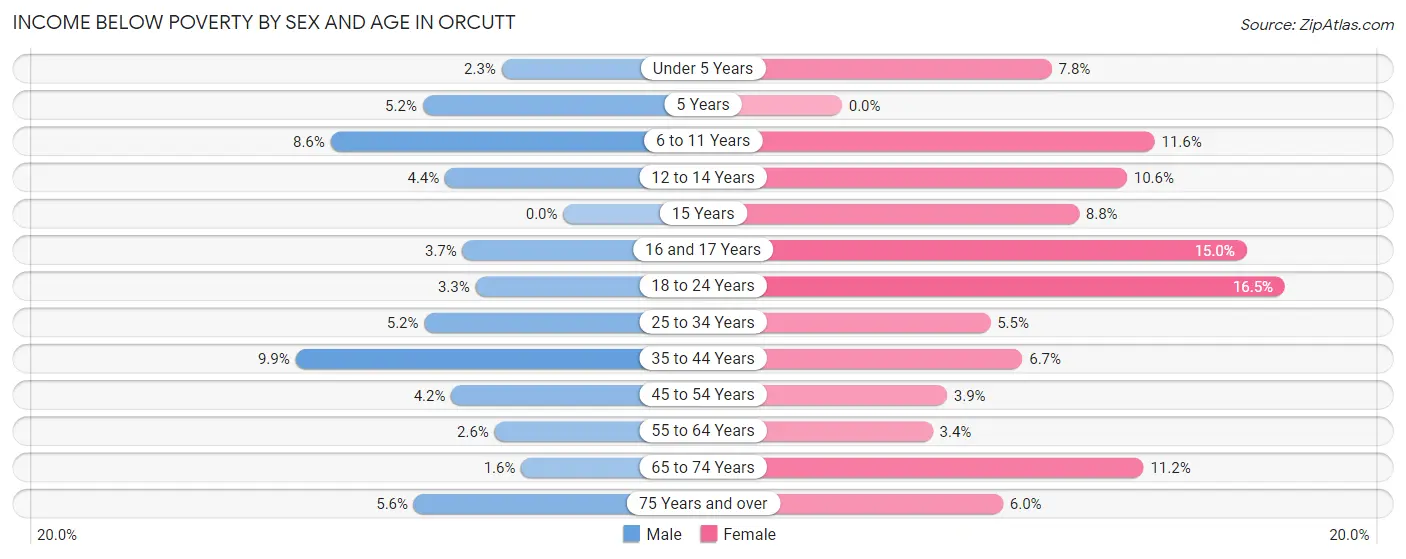
Income Below Poverty by Sex and Age in Orcutt
With 4.8% poverty level for males and 7.8% for females among the residents of Orcutt, 35 to 44 year old males and 18 to 24 year old females are the most vulnerable to poverty, with 213 males (9.9%) and 202 females (16.5%) in their respective age groups living below the poverty level.
| Age Bracket | Male | Female |
| Under 5 Years | 20 (2.3%) | 60 (7.8%) |
| 5 Years | 13 (5.2%) | 0 (0.0%) |
| 6 to 11 Years | 118 (8.6%) | 127 (11.6%) |
| 12 to 14 Years | 22 (4.4%) | 55 (10.6%) |
| 15 Years | 0 (0.0%) | 19 (8.8%) |
| 16 and 17 Years | 18 (3.7%) | 86 (15.0%) |
| 18 to 24 Years | 52 (3.3%) | 202 (16.5%) |
| 25 to 34 Years | 88 (5.2%) | 96 (5.5%) |
| 35 to 44 Years | 213 (9.9%) | 109 (6.7%) |
| 45 to 54 Years | 77 (4.2%) | 73 (3.9%) |
| 55 to 64 Years | 52 (2.5%) | 72 (3.4%) |
| 65 to 74 Years | 26 (1.6%) | 181 (11.2%) |
| 75 Years and over | 59 (5.6%) | 102 (6.0%) |
| Total | 758 (4.8%) | 1,182 (7.8%) |
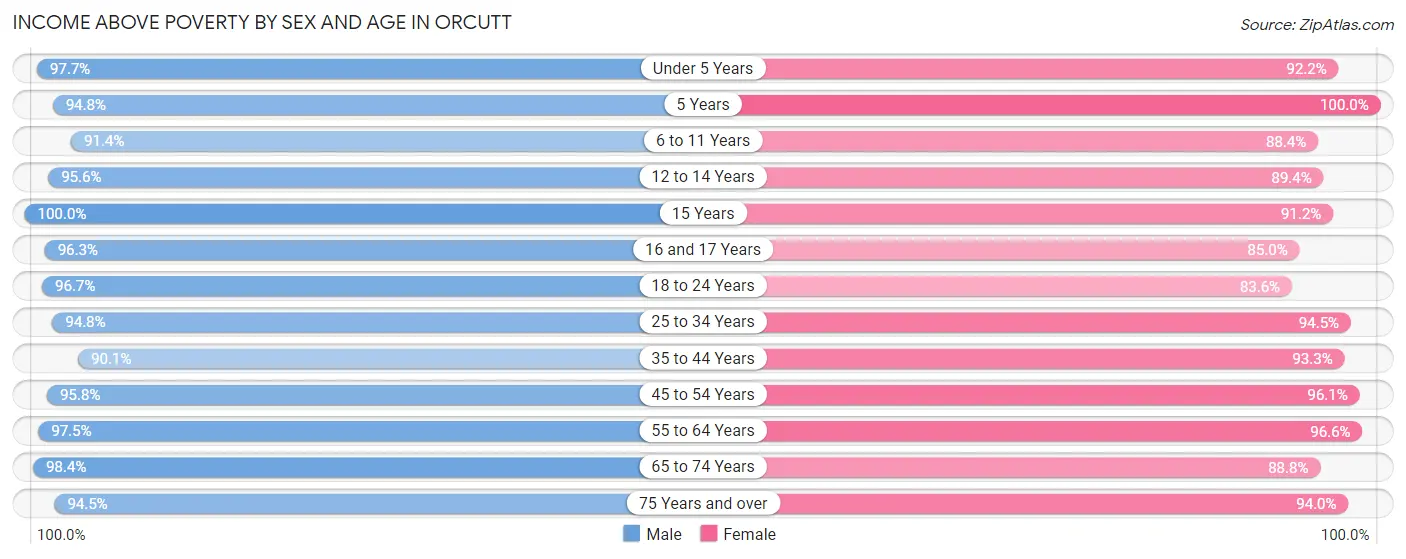
Income Above Poverty by Sex and Age in Orcutt
According to the poverty statistics in Orcutt, males aged 15 years and females aged 5 years are the age groups that are most secure financially, with 100.0% of males and 100.0% of females in these age groups living above the poverty line.
| Age Bracket | Male | Female |
| Under 5 Years | 852 (97.7%) | 710 (92.2%) |
| 5 Years | 236 (94.8%) | 104 (100.0%) |
| 6 to 11 Years | 1,247 (91.4%) | 967 (88.4%) |
| 12 to 14 Years | 479 (95.6%) | 465 (89.4%) |
| 15 Years | 310 (100.0%) | 197 (91.2%) |
| 16 and 17 Years | 463 (96.3%) | 486 (85.0%) |
| 18 to 24 Years | 1,543 (96.7%) | 1,026 (83.6%) |
| 25 to 34 Years | 1,619 (94.8%) | 1,647 (94.5%) |
| 35 to 44 Years | 1,929 (90.1%) | 1,519 (93.3%) |
| 45 to 54 Years | 1,772 (95.8%) | 1,799 (96.1%) |
| 55 to 64 Years | 1,984 (97.5%) | 2,062 (96.6%) |
| 65 to 74 Years | 1,643 (98.4%) | 1,435 (88.8%) |
| 75 Years and over | 1,005 (94.5%) | 1,605 (94.0%) |
| Total | 15,082 (95.2%) | 14,022 (92.2%) |
Income Below Poverty Among Married-Couple Families in Orcutt
The poverty statistics for married-couple families in Orcutt show that 2.1% or 141 of the total 6,795 families live below the poverty line. Families with 3 or 4 children have the highest poverty rate of 13.7%, comprising of 80 families. On the other hand, families with 5 or more children have the lowest poverty rate of 0.0%, which includes 0 families.

| Children | Above Poverty | Below Poverty |
| No Children | 3,880 (99.1%) | 35 (0.9%) |
| 1 or 2 Children | 2,246 (98.9%) | 26 (1.1%) |
| 3 or 4 Children | 505 (86.3%) | 80 (13.7%) |
| 5 or more Children | 23 (100.0%) | 0 (0.0%) |
| Total | 6,654 (97.9%) | 141 (2.1%) |
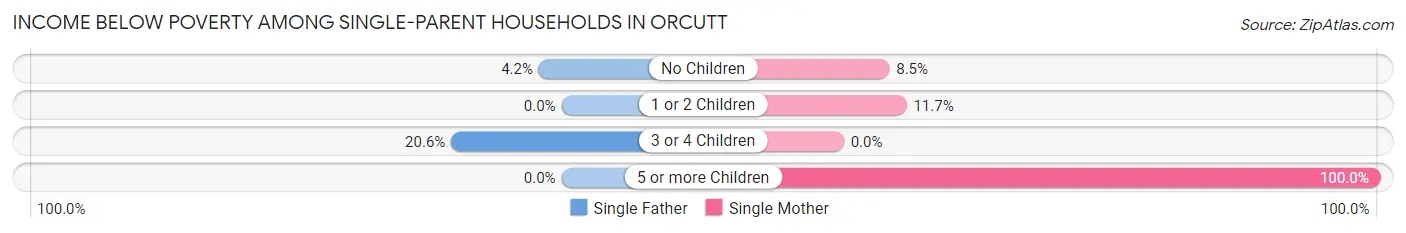
Income Below Poverty Among Single-Parent Households in Orcutt
According to the poverty data in Orcutt, 4.0% or 28 single-father households and 11.6% or 112 single-mother households are living below the poverty line. Among single-father households, those with 3 or 4 children have the highest poverty rate, with 15 households (20.5%) experiencing poverty. Likewise, among single-mother households, those with 5 or more children have the highest poverty rate, with 20 households (100.0%) falling below the poverty line.
| Children | Single Father | Single Mother |
| No Children | 13 (4.2%) | 48 (8.5%) |
| 1 or 2 Children | 0 (0.0%) | 44 (11.7%) |
| 3 or 4 Children | 15 (20.5%) | 0 (0.0%) |
| 5 or more Children | 0 (0.0%) | 20 (100.0%) |
| Total | 28 (4.0%) | 112 (11.6%) |
Income Below Poverty Among Married-Couple vs Single-Parent Households in Orcutt
The poverty data for Orcutt shows that 141 of the married-couple family households (2.1%) and 140 of the single-parent households (8.4%) are living below the poverty level. Within the married-couple family households, those with 3 or 4 children have the highest poverty rate, with 80 households (13.7%) falling below the poverty line. Among the single-parent households, those with 5 or more children have the highest poverty rate, with 20 household (100.0%) living below poverty.
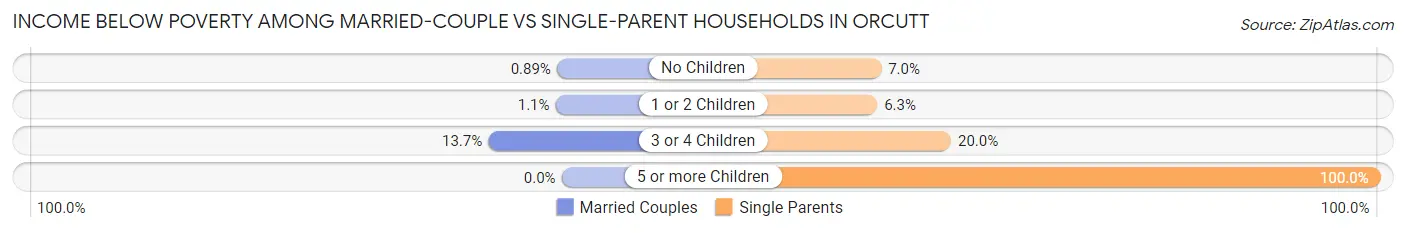
| Children | Married-Couple Families | Single-Parent Households |
| No Children | 35 (0.9%) | 61 (7.0%) |
| 1 or 2 Children | 26 (1.1%) | 44 (6.2%) |
| 3 or 4 Children | 80 (13.7%) | 15 (20.0%) |
| 5 or more Children | 0 (0.0%) | 20 (100.0%) |
| Total | 141 (2.1%) | 140 (8.4%) |
Race in Orcutt
The most populous races in Orcutt are White / Caucasian (21,612 | 69.4%), Hispanic or Latino (9,505 | 30.5%), and Two or more Races (6,035 | 19.4%).
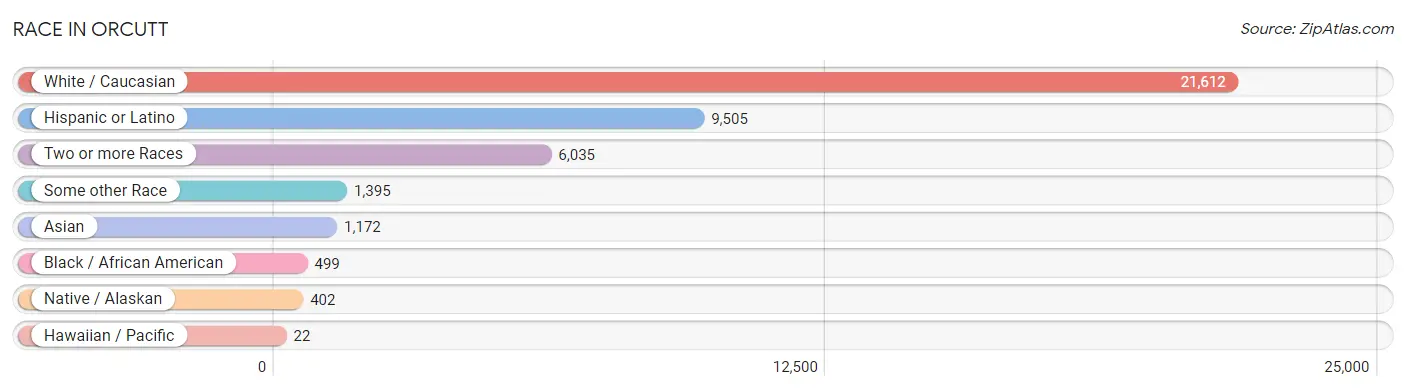
| Race | # Population | % Population |
| Asian | 1,172 | 3.8% |
| Black / African American | 499 | 1.6% |
| Hawaiian / Pacific | 22 | 0.1% |
| Hispanic or Latino | 9,505 | 30.5% |
| Native / Alaskan | 402 | 1.3% |
| White / Caucasian | 21,612 | 69.4% |
| Two or more Races | 6,035 | 19.4% |
| Some other Race | 1,395 | 4.5% |
| Total | 31,137 | 100.0% |
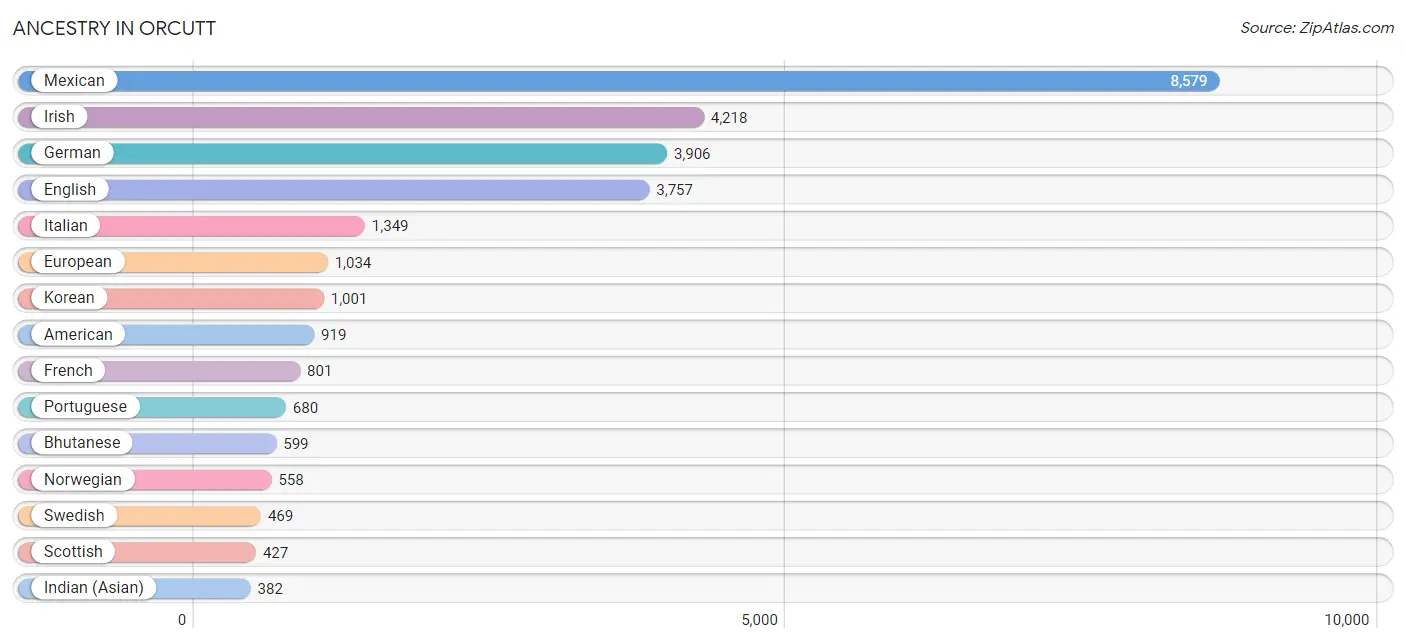
Ancestry in Orcutt
The most populous ancestries reported in Orcutt are Mexican (8,579 | 27.6%), Irish (4,218 | 13.6%), German (3,906 | 12.5%), English (3,757 | 12.1%), and Italian (1,349 | 4.3%), together accounting for 70.0% of all Orcutt residents.
| Ancestry | # Population | % Population |
| African | 38 | 0.1% |
| American | 919 | 2.9% |
| Apache | 85 | 0.3% |
| Arab | 146 | 0.5% |
| Argentinean | 45 | 0.1% |
| Armenian | 40 | 0.1% |
| Austrian | 30 | 0.1% |
| Basque | 26 | 0.1% |
| Belgian | 7 | 0.0% |
| Bhutanese | 599 | 1.9% |
| Blackfeet | 13 | 0.0% |
| British | 271 | 0.9% |
| Bulgarian | 5 | 0.0% |
| Burmese | 96 | 0.3% |
| Cajun | 9 | 0.0% |
| Canadian | 79 | 0.3% |
| Celtic | 37 | 0.1% |
| Central American | 94 | 0.3% |
| Central American Indian | 21 | 0.1% |
| Cherokee | 186 | 0.6% |
| Chickasaw | 45 | 0.1% |
| Chippewa | 59 | 0.2% |
| Choctaw | 84 | 0.3% |
| Colombian | 208 | 0.7% |
| Costa Rican | 9 | 0.0% |
| Croatian | 7 | 0.0% |
| Cuban | 16 | 0.1% |
| Czech | 36 | 0.1% |
| Czechoslovakian | 183 | 0.6% |
| Danish | 293 | 0.9% |
| Dutch | 305 | 1.0% |
| Eastern European | 55 | 0.2% |
| Ecuadorian | 15 | 0.1% |
| Egyptian | 14 | 0.0% |
| English | 3,757 | 12.1% |
| European | 1,034 | 3.3% |
| Filipino | 160 | 0.5% |
| Finnish | 89 | 0.3% |
| French | 801 | 2.6% |
| French Canadian | 109 | 0.4% |
| German | 3,906 | 12.5% |
| Greek | 106 | 0.3% |
| Guamanian / Chamorro | 22 | 0.1% |
| Hopi | 44 | 0.1% |
| Hungarian | 36 | 0.1% |
| Icelander | 15 | 0.1% |
| Indian (Asian) | 382 | 1.2% |
| Inupiat | 28 | 0.1% |
| Iranian | 25 | 0.1% |
| Irish | 4,218 | 13.6% |
| Italian | 1,349 | 4.3% |
| Japanese | 75 | 0.2% |
| Korean | 1,001 | 3.2% |
| Laotian | 45 | 0.1% |
| Lebanese | 93 | 0.3% |
| Lithuanian | 49 | 0.2% |
| Maltese | 19 | 0.1% |
| Mexican | 8,579 | 27.6% |
| Mexican American Indian | 97 | 0.3% |
| Native Hawaiian | 109 | 0.4% |
| Nicaraguan | 31 | 0.1% |
| Northern European | 47 | 0.2% |
| Norwegian | 558 | 1.8% |
| Pakistani | 77 | 0.3% |
| Peruvian | 12 | 0.0% |
| Polish | 262 | 0.8% |
| Portuguese | 680 | 2.2% |
| Puerto Rican | 201 | 0.6% |
| Romanian | 57 | 0.2% |
| Russian | 99 | 0.3% |
| Salvadoran | 54 | 0.2% |
| Scandinavian | 162 | 0.5% |
| Scotch-Irish | 269 | 0.9% |
| Scottish | 427 | 1.4% |
| Seminole | 15 | 0.1% |
| Slovak | 21 | 0.1% |
| South American | 301 | 1.0% |
| Spaniard | 169 | 0.5% |
| Spanish | 59 | 0.2% |
| Sri Lankan | 70 | 0.2% |
| Subsaharan African | 38 | 0.1% |
| Swedish | 469 | 1.5% |
| Swiss | 189 | 0.6% |
| Thai | 245 | 0.8% |
| Turkish | 10 | 0.0% |
| Ukrainian | 87 | 0.3% |
| Venezuelan | 21 | 0.1% |
| Welsh | 187 | 0.6% | View All 88 Rows |
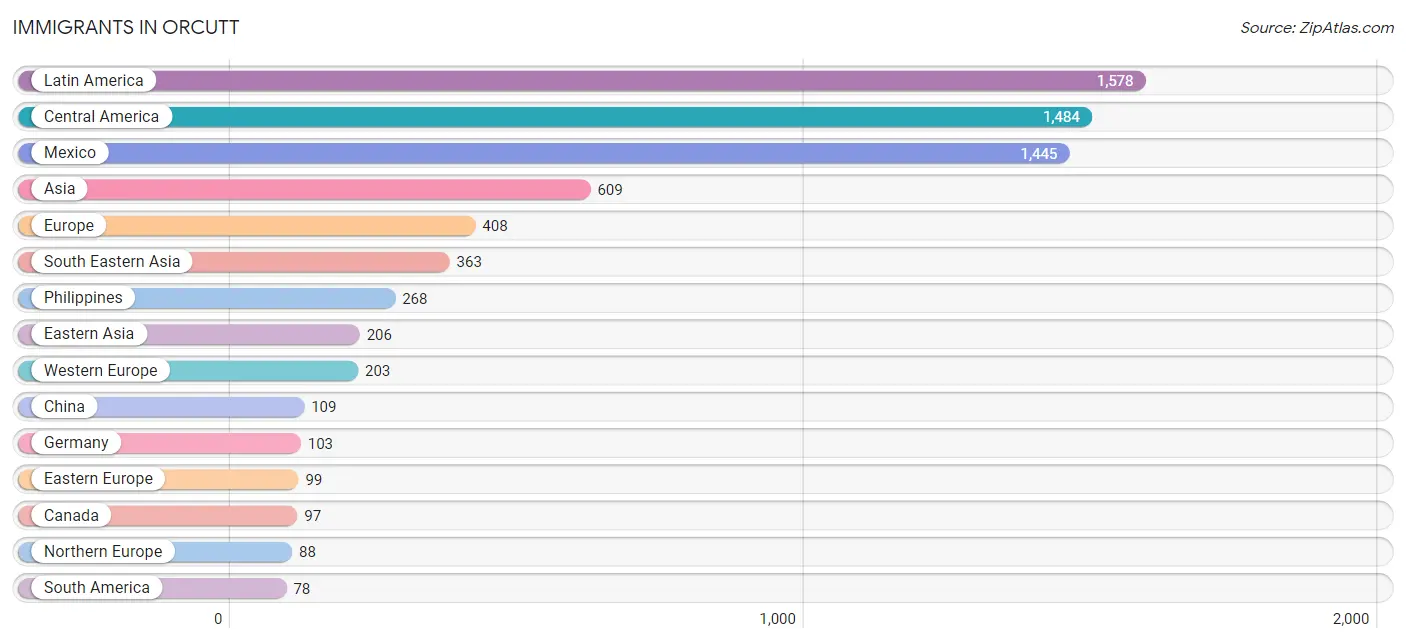
Immigrants in Orcutt
The most numerous immigrant groups reported in Orcutt came from Latin America (1,578 | 5.1%), Central America (1,484 | 4.8%), Mexico (1,445 | 4.6%), Asia (609 | 2.0%), and Europe (408 | 1.3%), together accounting for 17.7% of all Orcutt residents.
| Immigration Origin | # Population | % Population |
| Africa | 20 | 0.1% |
| Argentina | 33 | 0.1% |
| Asia | 609 | 2.0% |
| Belgium | 7 | 0.0% |
| Brazil | 11 | 0.0% |
| Cambodia | 6 | 0.0% |
| Canada | 97 | 0.3% |
| Caribbean | 16 | 0.1% |
| Central America | 1,484 | 4.8% |
| China | 109 | 0.4% |
| Colombia | 7 | 0.0% |
| Costa Rica | 9 | 0.0% |
| Cuba | 16 | 0.1% |
| Eastern Asia | 206 | 0.7% |
| Eastern Europe | 99 | 0.3% |
| Egypt | 13 | 0.0% |
| El Salvador | 30 | 0.1% |
| England | 46 | 0.2% |
| Europe | 408 | 1.3% |
| France | 63 | 0.2% |
| Germany | 103 | 0.3% |
| Hong Kong | 22 | 0.1% |
| India | 30 | 0.1% |
| Indonesia | 22 | 0.1% |
| Ireland | 29 | 0.1% |
| Italy | 18 | 0.1% |
| Japan | 47 | 0.2% |
| Korea | 50 | 0.2% |
| Latin America | 1,578 | 5.1% |
| Malaysia | 6 | 0.0% |
| Mexico | 1,445 | 4.6% |
| Netherlands | 30 | 0.1% |
| Northern Africa | 13 | 0.0% |
| Northern Europe | 88 | 0.3% |
| Pakistan | 10 | 0.0% |
| Philippines | 268 | 0.9% |
| Russia | 50 | 0.2% |
| South Africa | 4 | 0.0% |
| South America | 78 | 0.3% |
| South Central Asia | 40 | 0.1% |
| South Eastern Asia | 363 | 1.2% |
| Southern Europe | 18 | 0.1% |
| Sweden | 13 | 0.0% |
| Taiwan | 51 | 0.2% |
| Thailand | 53 | 0.2% |
| Venezuela | 27 | 0.1% |
| Vietnam | 8 | 0.0% |
| Western Europe | 203 | 0.6% | View All 48 Rows |
Sex and Age in Orcutt
Sex and Age in Orcutt
The most populous age groups in Orcutt are 15 to 19 Years (1,357 | 8.6%) for men and 15 to 19 Years (1,184 | 7.7%) for women.
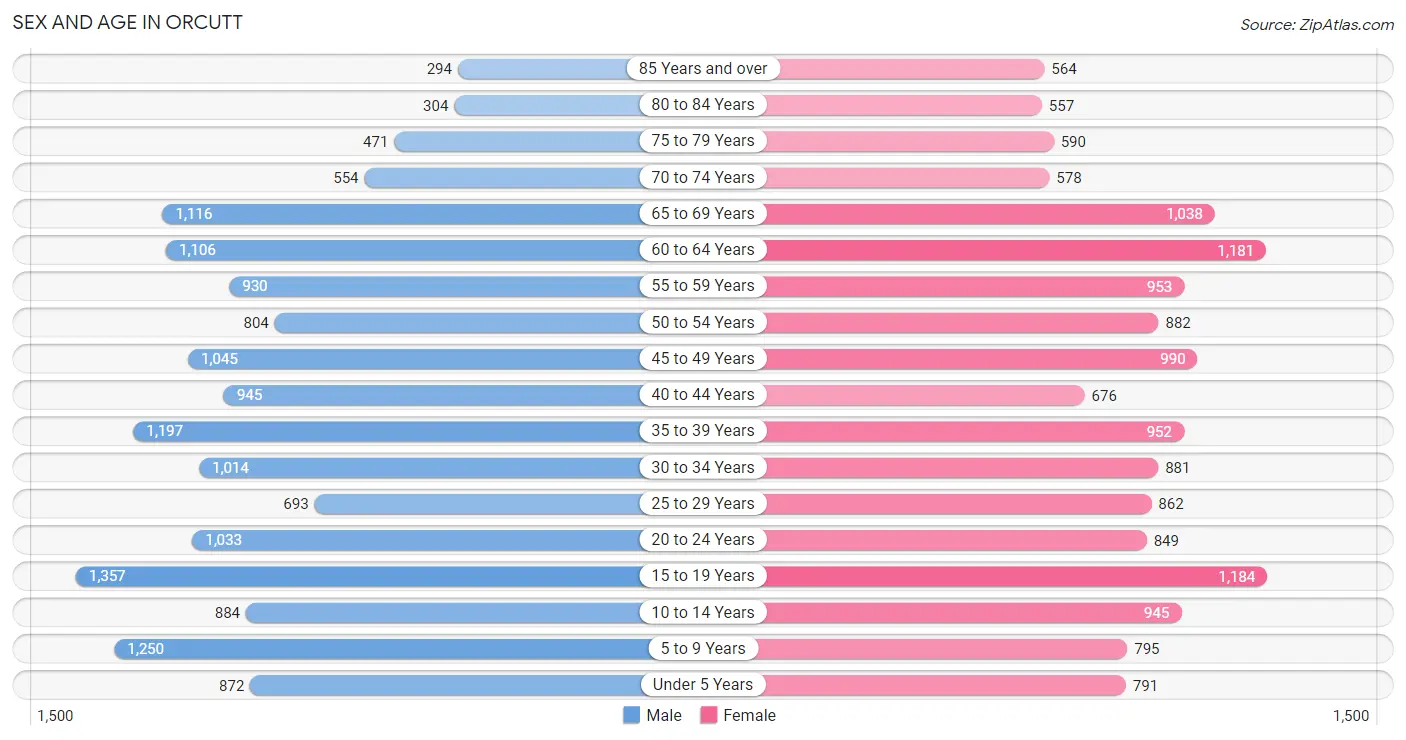
| Age Bracket | Male | Female |
| Under 5 Years | 872 (5.5%) | 791 (5.2%) |
| 5 to 9 Years | 1,250 (7.9%) | 795 (5.2%) |
| 10 to 14 Years | 884 (5.6%) | 945 (6.2%) |
| 15 to 19 Years | 1,357 (8.6%) | 1,184 (7.7%) |
| 20 to 24 Years | 1,033 (6.5%) | 849 (5.6%) |
| 25 to 29 Years | 693 (4.4%) | 862 (5.7%) |
| 30 to 34 Years | 1,014 (6.4%) | 881 (5.8%) |
| 35 to 39 Years | 1,197 (7.5%) | 952 (6.2%) |
| 40 to 44 Years | 945 (6.0%) | 676 (4.4%) |
| 45 to 49 Years | 1,045 (6.6%) | 990 (6.5%) |
| 50 to 54 Years | 804 (5.1%) | 882 (5.8%) |
| 55 to 59 Years | 930 (5.9%) | 953 (6.2%) |
| 60 to 64 Years | 1,106 (7.0%) | 1,181 (7.7%) |
| 65 to 69 Years | 1,116 (7.0%) | 1,038 (6.8%) |
| 70 to 74 Years | 554 (3.5%) | 578 (3.8%) |
| 75 to 79 Years | 471 (3.0%) | 590 (3.9%) |
| 80 to 84 Years | 304 (1.9%) | 557 (3.6%) |
| 85 Years and over | 294 (1.8%) | 564 (3.7%) |
| Total | 15,869 (100.0%) | 15,268 (100.0%) |
Families and Households in Orcutt
Median Family Size in Orcutt
The median family size in Orcutt is 3.18 persons per family, with married-couple families (6,795 | 80.2%) accounting for the largest median family size of 3.25 persons per family. On the other hand, single female/mother families (963 | 11.4%) represent the smallest median family size with 2.82 persons per family.
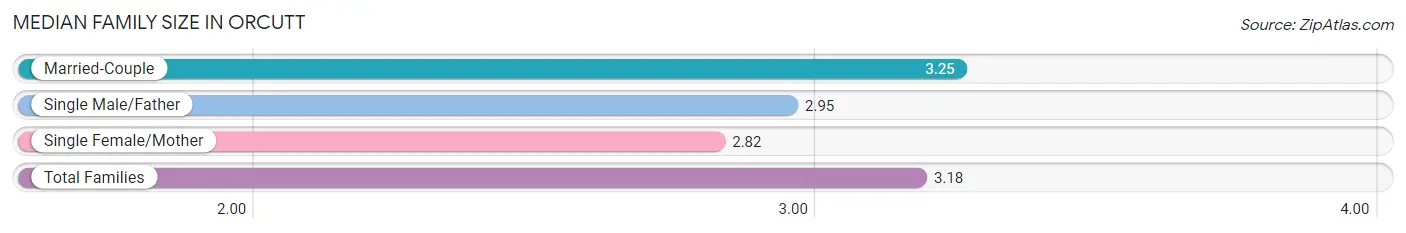
| Family Type | # Families | Family Size |
| Married-Couple | 6,795 (80.2%) | 3.25 |
| Single Male/Father | 709 (8.4%) | 2.95 |
| Single Female/Mother | 963 (11.4%) | 2.82 |
| Total Families | 8,467 (100.0%) | 3.18 |
Median Household Size in Orcutt
The median household size in Orcutt is 2.77 persons per household, with single male/father households (709 | 6.3%) accounting for the largest median household size of 3.42 persons per household. non-family households (2,713 | 24.3%) represent the smallest median household size with 1.19 persons per household.
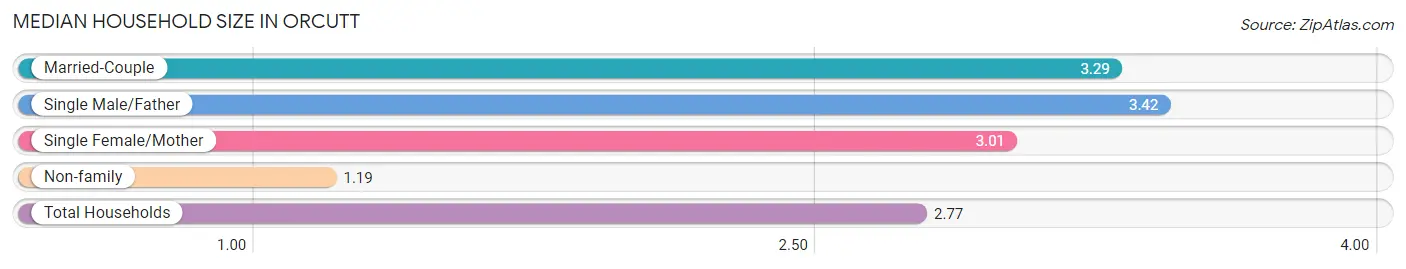
| Household Type | # Households | Household Size |
| Married-Couple | 6,795 (60.8%) | 3.29 |
| Single Male/Father | 709 (6.3%) | 3.42 |
| Single Female/Mother | 963 (8.6%) | 3.01 |
| Non-family | 2,713 (24.3%) | 1.19 |
| Total Households | 11,180 (100.0%) | 2.77 |
Household Size by Marriage Status in Orcutt
Out of a total of 11,180 households in Orcutt, 8,467 (75.7%) are family households, while 2,713 (24.3%) are nonfamily households. The most numerous type of family households are 2-person households, comprising 3,492, and the most common type of nonfamily households are 1-person households, comprising 2,247.
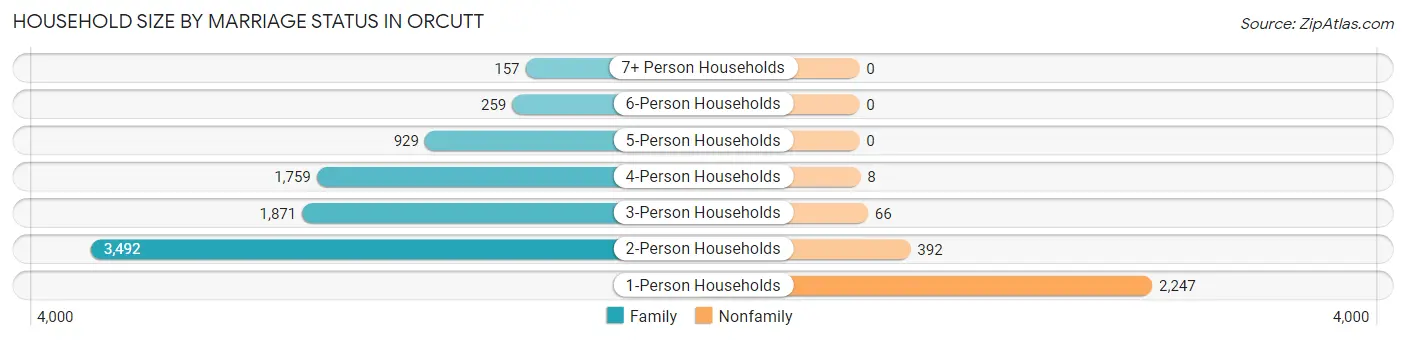
| Household Size | Family Households | Nonfamily Households |
| 1-Person Households | - | 2,247 (20.1%) |
| 2-Person Households | 3,492 (31.2%) | 392 (3.5%) |
| 3-Person Households | 1,871 (16.7%) | 66 (0.6%) |
| 4-Person Households | 1,759 (15.7%) | 8 (0.1%) |
| 5-Person Households | 929 (8.3%) | 0 (0.0%) |
| 6-Person Households | 259 (2.3%) | 0 (0.0%) |
| 7+ Person Households | 157 (1.4%) | 0 (0.0%) |
| Total | 8,467 (75.7%) | 2,713 (24.3%) |
Female Fertility in Orcutt
Fertility by Age in Orcutt
Average fertility rate in Orcutt is 40.0 births per 1,000 women. Women in the age bracket of 35 to 50 years have the highest fertility rate with 54.0 births per 1,000 women. Women in the age bracket of 35 to 50 years acount for 56.4% of all women with births.
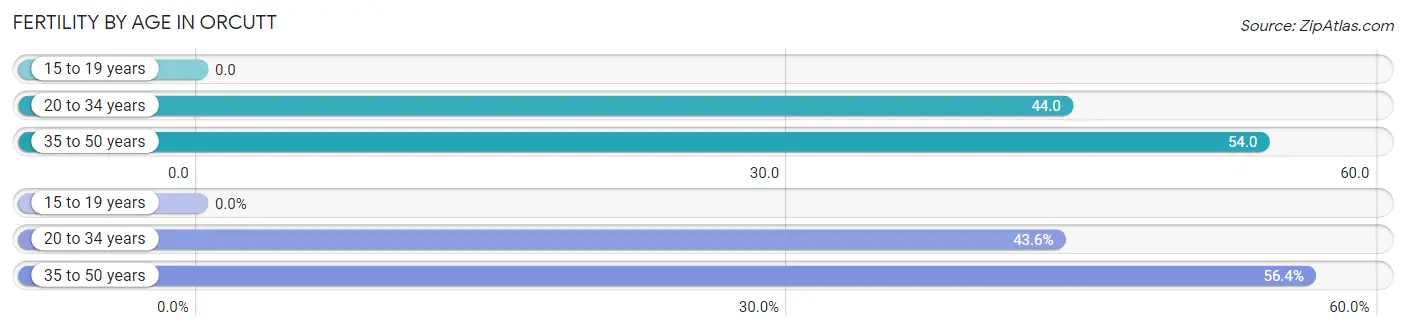
| Age Bracket | Women with Births | Births / 1,000 Women |
| 15 to 19 years | 0 (0.0%) | 0.0 |
| 20 to 34 years | 113 (43.6%) | 44.0 |
| 35 to 50 years | 146 (56.4%) | 54.0 |
| Total | 259 (100.0%) | 40.0 |
Fertility by Age by Marriage Status in Orcutt
83.8% of women with births (259) in Orcutt are married. The highest percentage of unmarried women with births falls into 20 to 34 years age bracket with 16.8% of them unmarried at the time of birth, while the lowest percentage of unmarried women with births belong to 35 to 50 years age bracket with 15.7% of them unmarried.
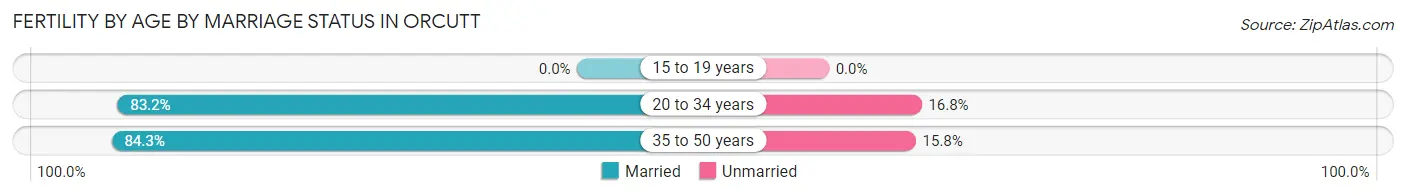
| Age Bracket | Married | Unmarried |
| 15 to 19 years | 0 (0.0%) | 0 (0.0%) |
| 20 to 34 years | 94 (83.2%) | 19 (16.8%) |
| 35 to 50 years | 123 (84.3%) | 23 (15.8%) |
| Total | 217 (83.8%) | 42 (16.2%) |
Fertility by Education in Orcutt
Average fertility rate in Orcutt is 40.0 births per 1,000 women. Women with the education attainment of college or associate's degree have the highest fertility rate of 55.0 births per 1,000 women, while women with the education attainment of less than high school have the lowest fertility at 9.0 births per 1,000 women. Women with the education attainment of college or associate's degree represent 52.9% of all women with births.
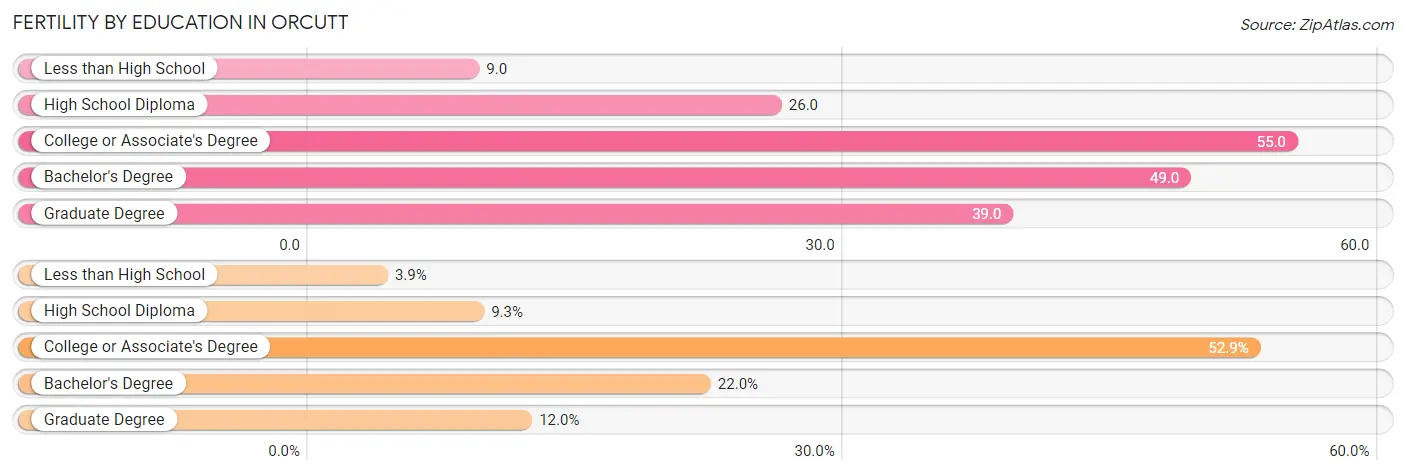
| Educational Attainment | Women with Births | Births / 1,000 Women |
| Less than High School | 10 (3.9%) | 9.0 |
| High School Diploma | 24 (9.3%) | 26.0 |
| College or Associate's Degree | 137 (52.9%) | 55.0 |
| Bachelor's Degree | 57 (22.0%) | 49.0 |
| Graduate Degree | 31 (12.0%) | 39.0 |
| Total | 259 (100.0%) | 40.0 |
Fertility by Education by Marriage Status in Orcutt
16.2% of women with births in Orcutt are unmarried. Women with the educational attainment of graduate degree are most likely to be married with 100.0% of them married at childbirth, while women with the educational attainment of less than high school are least likely to be married with 100.0% of them unmarried at childbirth.
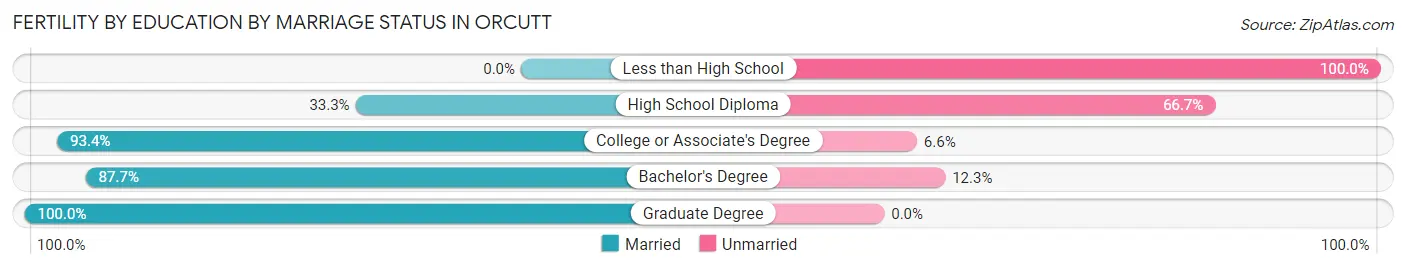
| Educational Attainment | Married | Unmarried |
| Less than High School | 0 (0.0%) | 10 (100.0%) |
| High School Diploma | 8 (33.3%) | 16 (66.7%) |
| College or Associate's Degree | 128 (93.4%) | 9 (6.6%) |
| Bachelor's Degree | 50 (87.7%) | 7 (12.3%) |
| Graduate Degree | 31 (100.0%) | 0 (0.0%) |
| Total | 217 (83.8%) | 42 (16.2%) |
Employment Characteristics in Orcutt
Employment by Class of Employer in Orcutt
Among the 14,299 employed individuals in Orcutt, private company employees (8,198 | 57.3%), local government employees (2,056 | 14.4%), and self-employed (not incorporated) (1,150 | 8.0%) make up the most common classes of employment.
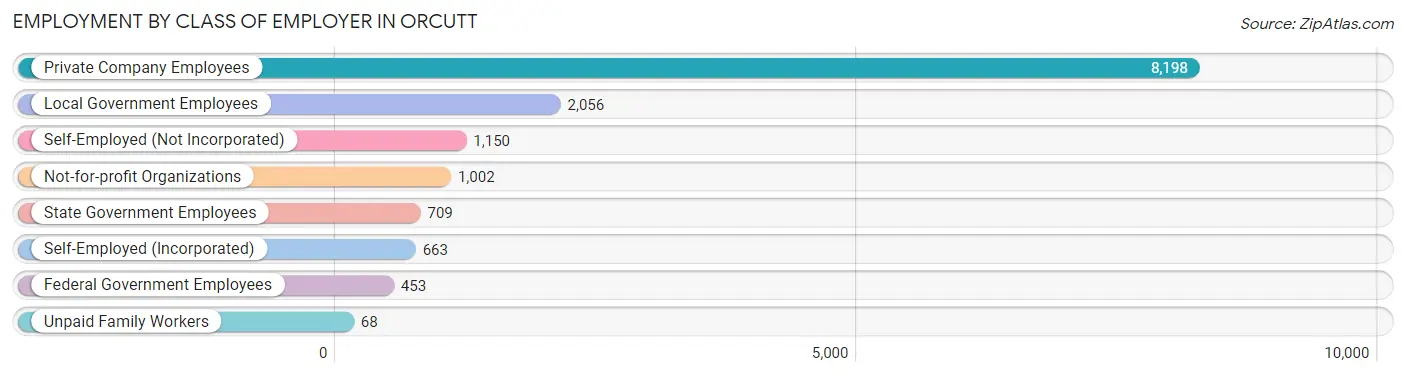
| Employer Class | # Employees | % Employees |
| Private Company Employees | 8,198 | 57.3% |
| Self-Employed (Incorporated) | 663 | 4.6% |
| Self-Employed (Not Incorporated) | 1,150 | 8.0% |
| Not-for-profit Organizations | 1,002 | 7.0% |
| Local Government Employees | 2,056 | 14.4% |
| State Government Employees | 709 | 5.0% |
| Federal Government Employees | 453 | 3.2% |
| Unpaid Family Workers | 68 | 0.5% |
| Total | 14,299 | 100.0% |
Employment Status by Age in Orcutt
According to the labor force statistics for Orcutt, out of the total population over 16 years of age (25,072), 60.4% or 15,143 individuals are in the labor force, with 4.2% or 636 of them unemployed. The age group with the highest labor force participation rate is 30 to 34 years, with 87.4% or 1,656 individuals in the labor force. Within the labor force, the 20 to 24 years age range has the highest percentage of unemployed individuals, with 7.4% or 106 of them being unemployed.
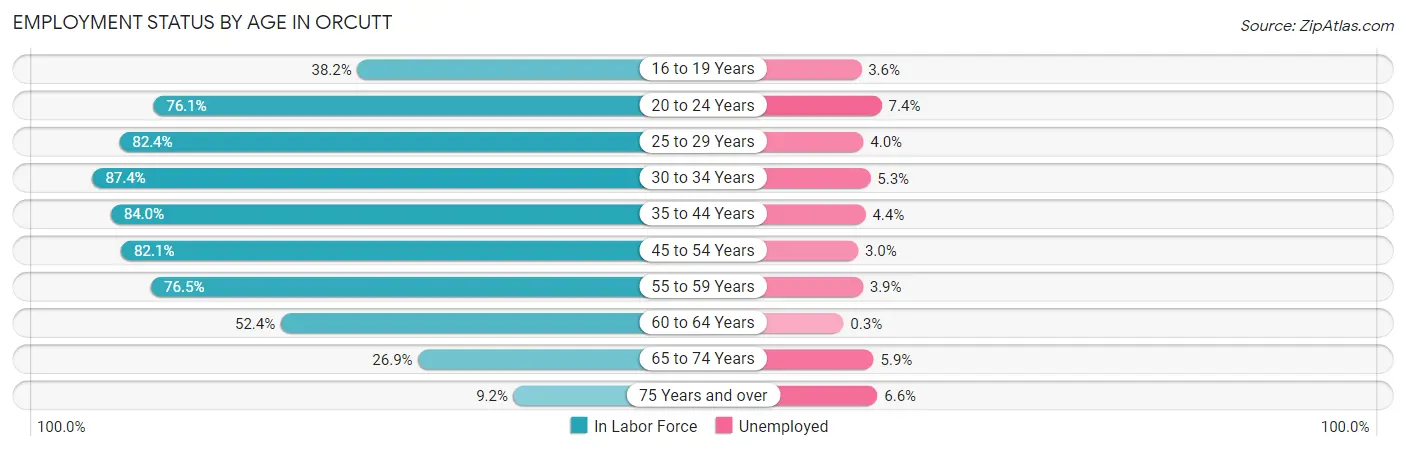
| Age Bracket | In Labor Force | Unemployed |
| 16 to 19 Years | 769 (38.2%) | 28 (3.6%) |
| 20 to 24 Years | 1,432 (76.1%) | 106 (7.4%) |
| 25 to 29 Years | 1,281 (82.4%) | 51 (4.0%) |
| 30 to 34 Years | 1,656 (87.4%) | 88 (5.3%) |
| 35 to 44 Years | 3,167 (84.0%) | 139 (4.4%) |
| 45 to 54 Years | 3,055 (82.1%) | 92 (3.0%) |
| 55 to 59 Years | 1,440 (76.5%) | 56 (3.9%) |
| 60 to 64 Years | 1,198 (52.4%) | 4 (0.3%) |
| 65 to 74 Years | 884 (26.9%) | 52 (5.9%) |
| 75 Years and over | 256 (9.2%) | 17 (6.6%) |
| Total | 15,143 (60.4%) | 636 (4.2%) |
Employment Status by Educational Attainment in Orcutt
According to labor force statistics for Orcutt, 78.1% of individuals (11,802) out of the total population between 25 and 64 years of age (15,111) are in the labor force, with 3.6% or 425 of them being unemployed. The group with the highest labor force participation rate are those with the educational attainment of bachelor's degree or higher, with 81.0% or 3,812 individuals in the labor force. Within the labor force, individuals with less than high school education have the highest percentage of unemployment, with 9.4% or 54 of them being unemployed.
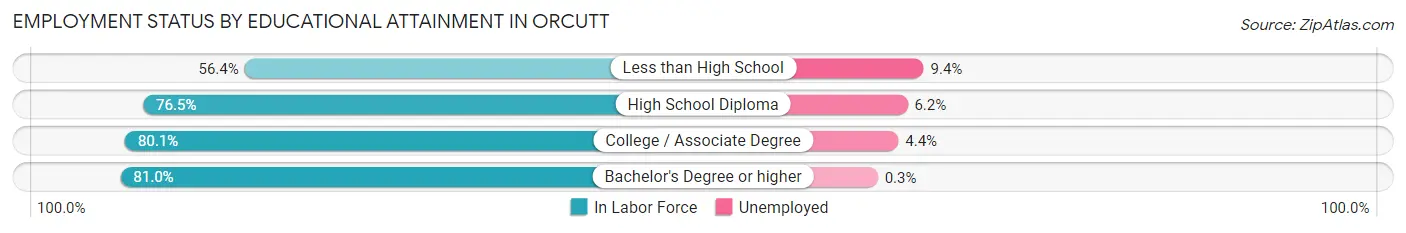
| Educational Attainment | In Labor Force | Unemployed |
| Less than High School | 572 (56.4%) | 95 (9.4%) |
| High School Diploma | 2,209 (76.5%) | 179 (6.2%) |
| College / Associate Degree | 5,209 (80.1%) | 286 (4.4%) |
| Bachelor's Degree or higher | 3,812 (81.0%) | 14 (0.3%) |
| Total | 11,802 (78.1%) | 544 (3.6%) |
Employment Occupations by Sex in Orcutt
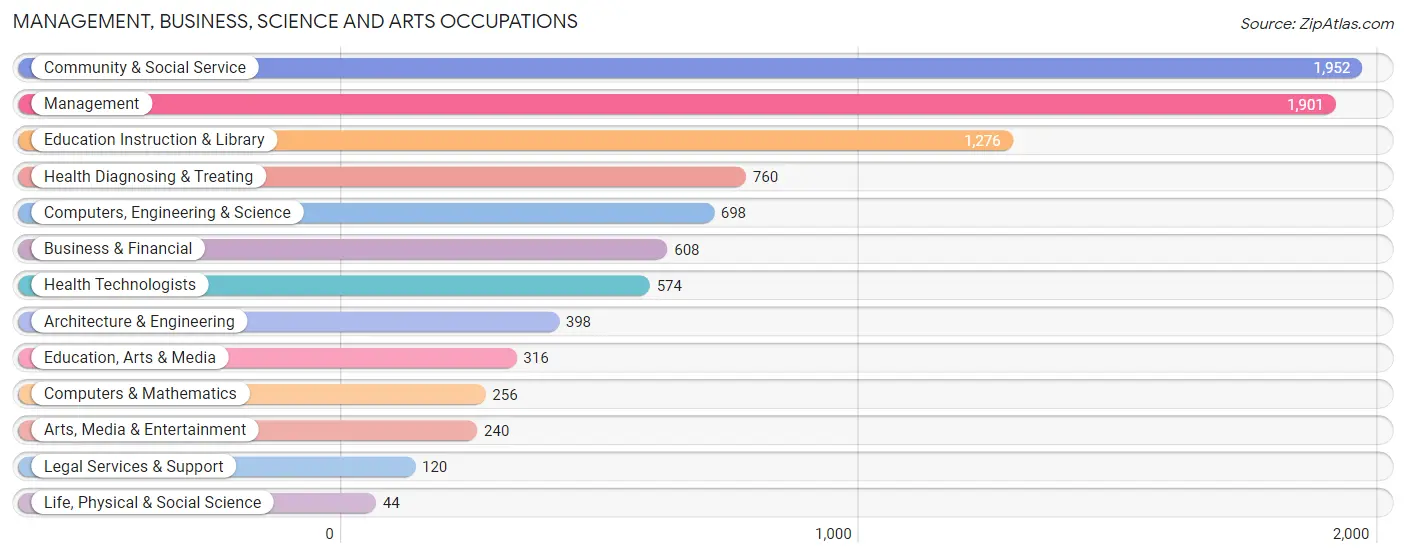
Management, Business, Science and Arts Occupations
The most common Management, Business, Science and Arts occupations in Orcutt are Community & Social Service (1,952 | 13.5%), Management (1,901 | 13.2%), Education Instruction & Library (1,276 | 8.8%), Health Diagnosing & Treating (760 | 5.3%), and Computers, Engineering & Science (698 | 4.8%).
Management, Business, Science and Arts Occupations by Sex
Within the Management, Business, Science and Arts occupations in Orcutt, the most male-oriented occupations are Computers & Mathematics (95.3%), Computers, Engineering & Science (80.7%), and Architecture & Engineering (74.6%), while the most female-oriented occupations are Education, Arts & Media (82.3%), Legal Services & Support (74.2%), and Health Technologists (72.1%).
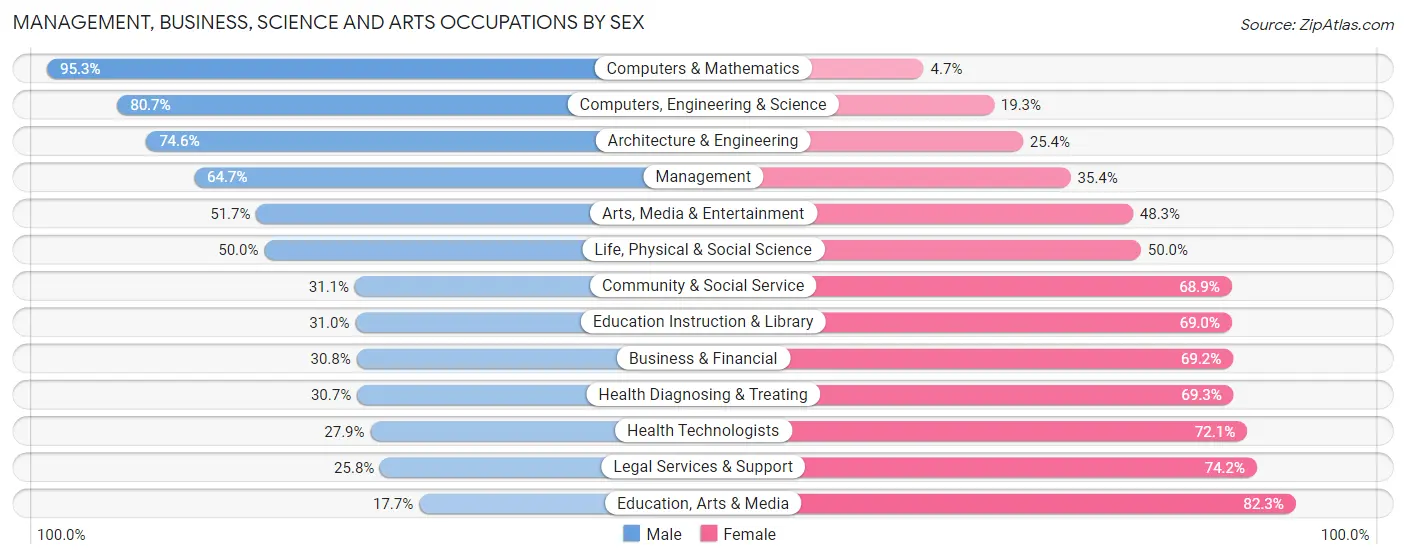
| Occupation | Male | Female |
| Management | 1,229 (64.6%) | 672 (35.3%) |
| Business & Financial | 187 (30.8%) | 421 (69.2%) |
| Computers, Engineering & Science | 563 (80.7%) | 135 (19.3%) |
| Computers & Mathematics | 244 (95.3%) | 12 (4.7%) |
| Architecture & Engineering | 297 (74.6%) | 101 (25.4%) |
| Life, Physical & Social Science | 22 (50.0%) | 22 (50.0%) |
| Community & Social Service | 607 (31.1%) | 1,345 (68.9%) |
| Education, Arts & Media | 56 (17.7%) | 260 (82.3%) |
| Legal Services & Support | 31 (25.8%) | 89 (74.2%) |
| Education Instruction & Library | 396 (31.0%) | 880 (69.0%) |
| Arts, Media & Entertainment | 124 (51.7%) | 116 (48.3%) |
| Health Diagnosing & Treating | 233 (30.7%) | 527 (69.3%) |
| Health Technologists | 160 (27.9%) | 414 (72.1%) |
| Total (Category) | 2,819 (47.6%) | 3,100 (52.4%) |
| Total (Overall) | 7,963 (55.2%) | 6,460 (44.8%) |
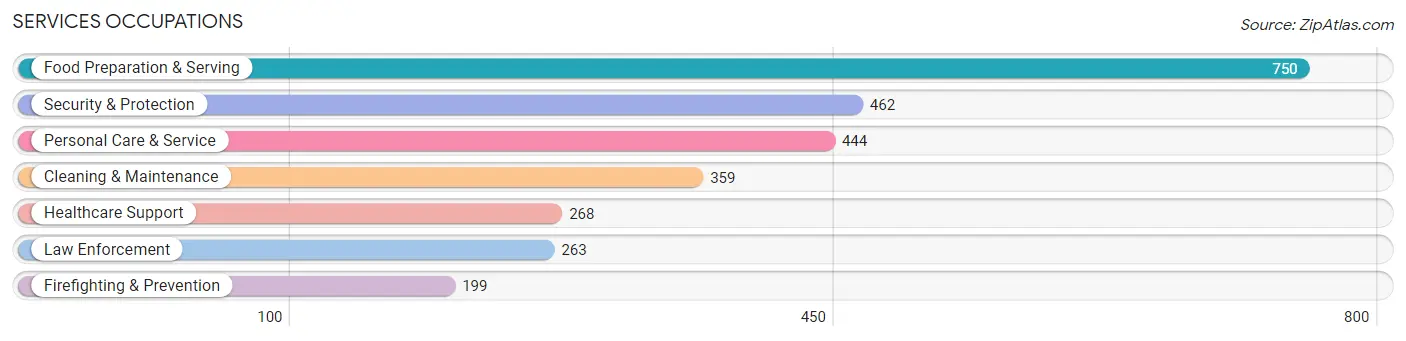
Services Occupations
The most common Services occupations in Orcutt are Food Preparation & Serving (750 | 5.2%), Security & Protection (462 | 3.2%), Personal Care & Service (444 | 3.1%), Cleaning & Maintenance (359 | 2.5%), and Healthcare Support (268 | 1.9%).
Services Occupations by Sex
Within the Services occupations in Orcutt, the most male-oriented occupations are Law Enforcement (98.1%), Cleaning & Maintenance (85.2%), and Security & Protection (84.9%), while the most female-oriented occupations are Healthcare Support (90.7%), Personal Care & Service (66.2%), and Food Preparation & Serving (53.7%).
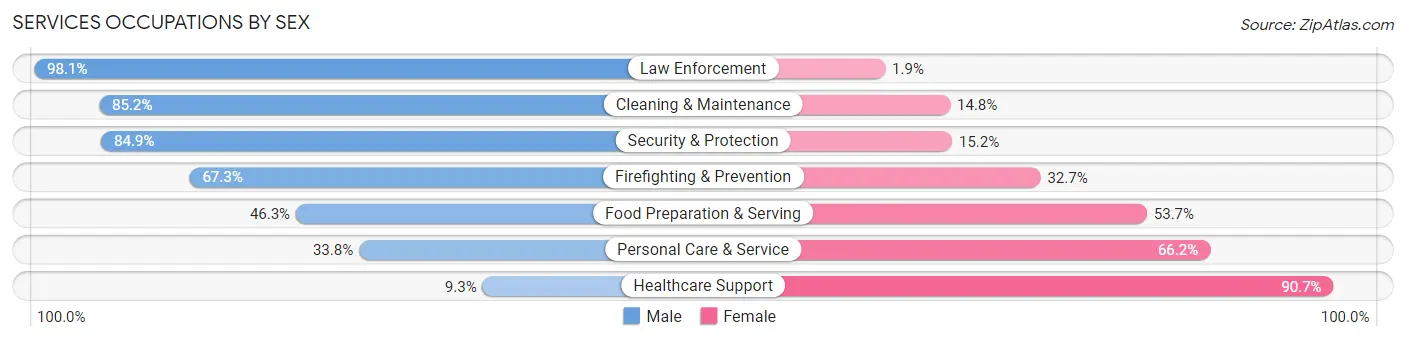
| Occupation | Male | Female |
| Healthcare Support | 25 (9.3%) | 243 (90.7%) |
| Security & Protection | 392 (84.9%) | 70 (15.1%) |
| Firefighting & Prevention | 134 (67.3%) | 65 (32.7%) |
| Law Enforcement | 258 (98.1%) | 5 (1.9%) |
| Food Preparation & Serving | 347 (46.3%) | 403 (53.7%) |
| Cleaning & Maintenance | 306 (85.2%) | 53 (14.8%) |
| Personal Care & Service | 150 (33.8%) | 294 (66.2%) |
| Total (Category) | 1,220 (53.4%) | 1,063 (46.6%) |
| Total (Overall) | 7,963 (55.2%) | 6,460 (44.8%) |
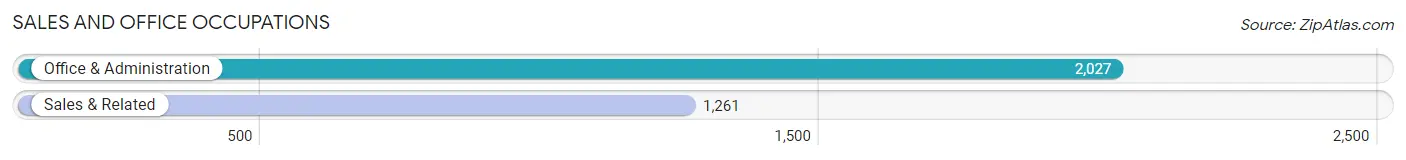
Sales and Office Occupations
The most common Sales and Office occupations in Orcutt are Office & Administration (2,027 | 14.1%), and Sales & Related (1,261 | 8.7%).
Sales and Office Occupations by Sex
| Occupation | Male | Female |
| Sales & Related | 643 (51.0%) | 618 (49.0%) |
| Office & Administration | 563 (27.8%) | 1,464 (72.2%) |
| Total (Category) | 1,206 (36.7%) | 2,082 (63.3%) |
| Total (Overall) | 7,963 (55.2%) | 6,460 (44.8%) |
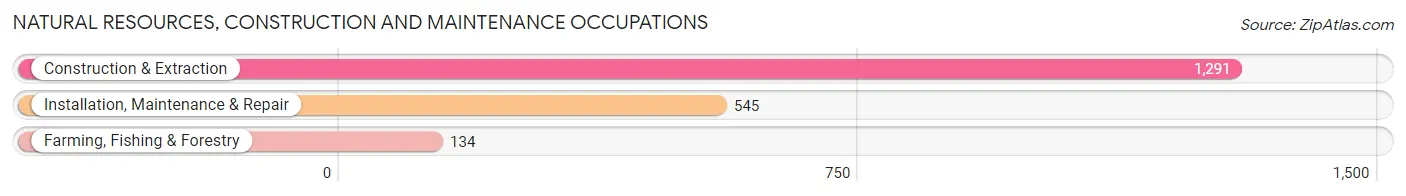
Natural Resources, Construction and Maintenance Occupations
The most common Natural Resources, Construction and Maintenance occupations in Orcutt are Construction & Extraction (1,291 | 8.9%), Installation, Maintenance & Repair (545 | 3.8%), and Farming, Fishing & Forestry (134 | 0.9%).
Natural Resources, Construction and Maintenance Occupations by Sex
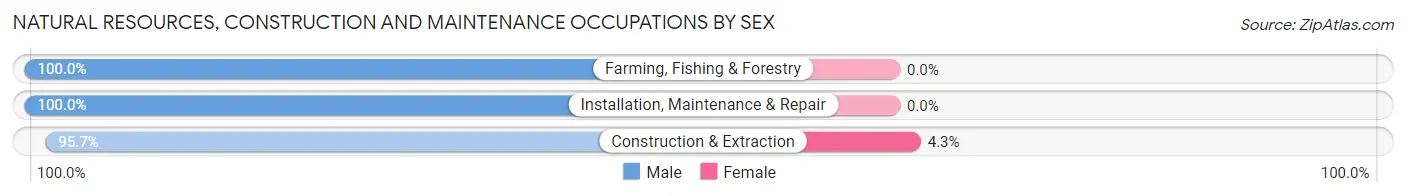
| Occupation | Male | Female |
| Farming, Fishing & Forestry | 134 (100.0%) | 0 (0.0%) |
| Construction & Extraction | 1,235 (95.7%) | 56 (4.3%) |
| Installation, Maintenance & Repair | 545 (100.0%) | 0 (0.0%) |
| Total (Category) | 1,914 (97.2%) | 56 (2.8%) |
| Total (Overall) | 7,963 (55.2%) | 6,460 (44.8%) |
Production, Transportation and Moving Occupations
The most common Production, Transportation and Moving occupations in Orcutt are Production (366 | 2.5%), Transportation (360 | 2.5%), and Material Moving (237 | 1.6%).
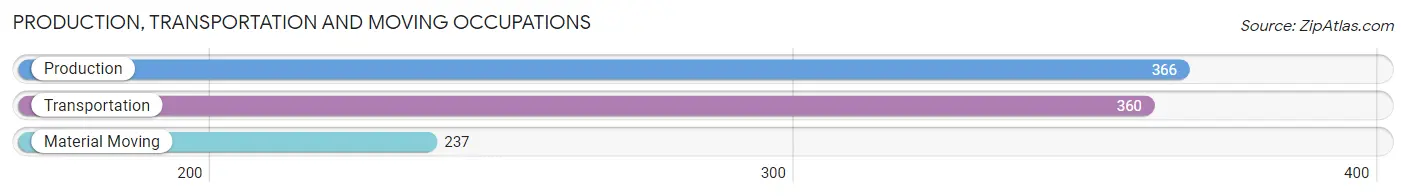
Production, Transportation and Moving Occupations by Sex
| Occupation | Male | Female |
| Production | 331 (90.4%) | 35 (9.6%) |
| Transportation | 298 (82.8%) | 62 (17.2%) |
| Material Moving | 175 (73.8%) | 62 (26.2%) |
| Total (Category) | 804 (83.5%) | 159 (16.5%) |
| Total (Overall) | 7,963 (55.2%) | 6,460 (44.8%) |
Employment Industries by Sex in Orcutt
Employment Industries in Orcutt
The major employment industries in Orcutt include Construction (1,801 | 12.5%), Educational Services (1,800 | 12.5%), Health Care & Social Assistance (1,543 | 10.7%), Retail Trade (1,436 | 10.0%), and Manufacturing (1,149 | 8.0%).
Employment Industries by Sex in Orcutt
The Orcutt industries that see more men than women are Mining, Quarrying, & Extraction (100.0%), Construction (86.9%), and Manufacturing (82.9%), whereas the industries that tend to have a higher number of women are Enterprise Management (100.0%), Finance & Insurance (73.5%), and Health Care & Social Assistance (70.8%).
| Industry | Male | Female |
| Agriculture, Fishing & Hunting | 311 (70.7%) | 129 (29.3%) |
| Mining, Quarrying, & Extraction | 113 (100.0%) | 0 (0.0%) |
| Construction | 1,565 (86.9%) | 236 (13.1%) |
| Manufacturing | 952 (82.9%) | 197 (17.2%) |
| Wholesale Trade | 170 (74.2%) | 59 (25.8%) |
| Retail Trade | 836 (58.2%) | 600 (41.8%) |
| Transportation & Warehousing | 278 (60.7%) | 180 (39.3%) |
| Utilities | 77 (72.0%) | 30 (28.0%) |
| Information | 76 (57.1%) | 57 (42.9%) |
| Finance & Insurance | 131 (26.5%) | 364 (73.5%) |
| Real Estate, Rental & Leasing | 116 (38.0%) | 189 (62.0%) |
| Professional & Scientific | 407 (54.6%) | 338 (45.4%) |
| Enterprise Management | 0 (0.0%) | 52 (100.0%) |
| Administrative & Support | 301 (68.9%) | 136 (31.1%) |
| Educational Services | 585 (32.5%) | 1,215 (67.5%) |
| Health Care & Social Assistance | 450 (29.2%) | 1,093 (70.8%) |
| Arts, Entertainment & Recreation | 282 (62.7%) | 168 (37.3%) |
| Accommodation & Food Services | 522 (52.7%) | 468 (47.3%) |
| Public Administration | 545 (54.6%) | 453 (45.4%) |
| Total | 7,963 (55.2%) | 6,460 (44.8%) |
Education in Orcutt
School Enrollment in Orcutt
The most common levels of schooling among the 8,110 students in Orcutt are high school (1,967 | 24.2%), college / undergraduate (1,876 | 23.1%), and elementary school (1,652 | 20.4%).
| School Level | # Students | % Students |
| Nursery / Preschool | 372 | 4.6% |
| Kindergarten | 443 | 5.5% |
| Elementary School | 1,652 | 20.4% |
| Middle School | 1,495 | 18.4% |
| High School | 1,967 | 24.2% |
| College / Undergraduate | 1,876 | 23.1% |
| Graduate / Professional | 305 | 3.8% |
| Total | 8,110 | 100.0% |
School Enrollment by Age by Funding Source in Orcutt
Out of a total of 8,110 students who are enrolled in schools in Orcutt, 1,460 (18.0%) attend a private institution, while the remaining 6,650 (82.0%) are enrolled in public schools. The age group of 25 to 34 year olds has the highest likelihood of being enrolled in private schools, with 289 (47.8% in the age bracket) enrolled. Conversely, the age group of 20 to 24 year olds has the lowest likelihood of being enrolled in a private school, with 574 (92.7% in the age bracket) attending a public institution.
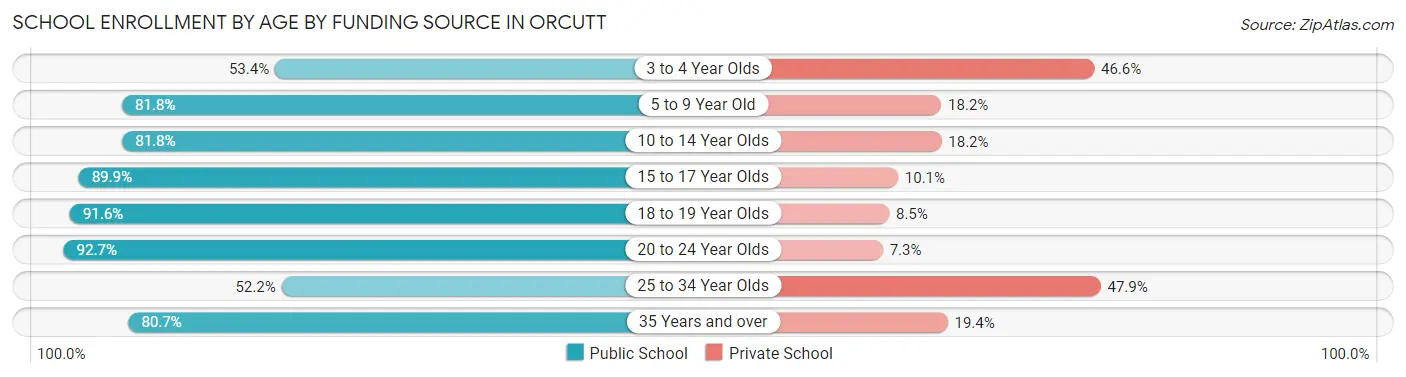
| Age Bracket | Public School | Private School |
| 3 to 4 Year Olds | 135 (53.4%) | 118 (46.6%) |
| 5 to 9 Year Old | 1,668 (81.8%) | 370 (18.2%) |
| 10 to 14 Year Olds | 1,479 (81.8%) | 329 (18.2%) |
| 15 to 17 Year Olds | 1,425 (89.9%) | 160 (10.1%) |
| 18 to 19 Year Olds | 737 (91.5%) | 68 (8.5%) |
| 20 to 24 Year Olds | 574 (92.7%) | 45 (7.3%) |
| 25 to 34 Year Olds | 315 (52.1%) | 289 (47.8%) |
| 35 Years and over | 321 (80.6%) | 77 (19.4%) |
| Total | 6,650 (82.0%) | 1,460 (18.0%) |
Educational Attainment by Field of Study in Orcutt
Business (1,206 | 17.2%), education (747 | 10.7%), bio, nature & agricultural (629 | 9.0%), liberal arts & history (586 | 8.4%), and science & technology (558 | 8.0%) are the most common fields of study among 7,004 individuals in Orcutt who have obtained a bachelor's degree or higher.
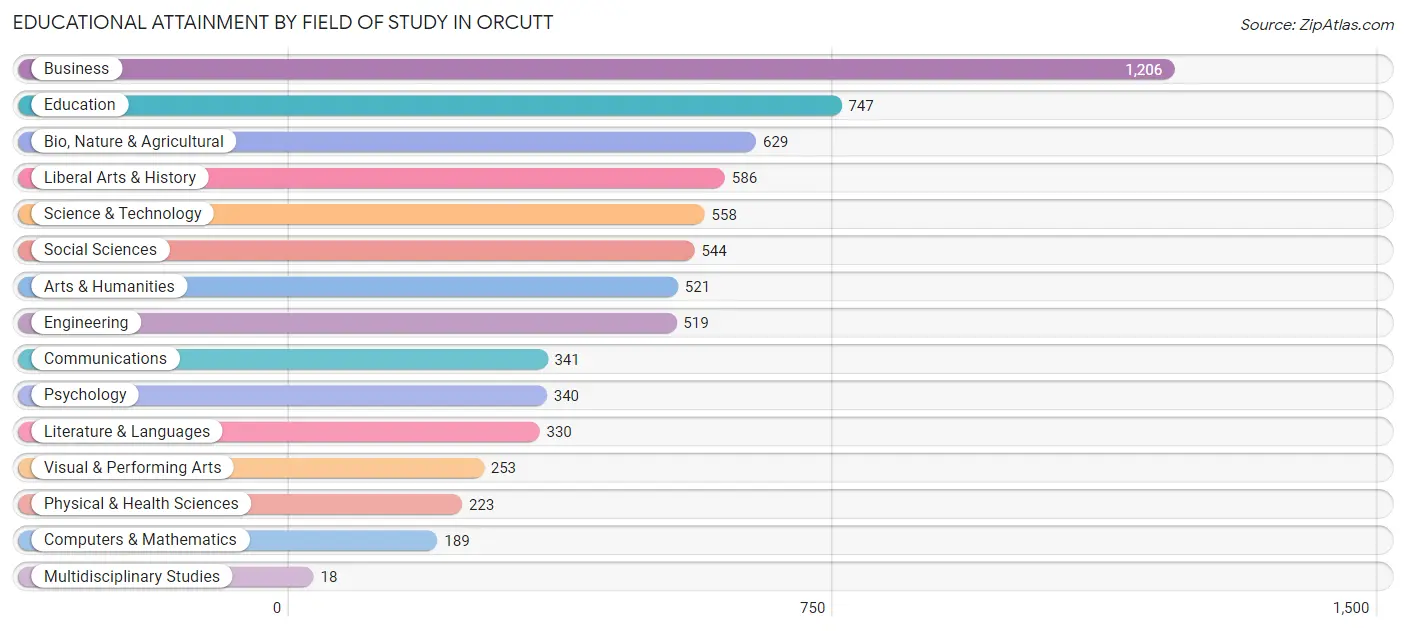
| Field of Study | # Graduates | % Graduates |
| Computers & Mathematics | 189 | 2.7% |
| Bio, Nature & Agricultural | 629 | 9.0% |
| Physical & Health Sciences | 223 | 3.2% |
| Psychology | 340 | 4.9% |
| Social Sciences | 544 | 7.8% |
| Engineering | 519 | 7.4% |
| Multidisciplinary Studies | 18 | 0.3% |
| Science & Technology | 558 | 8.0% |
| Business | 1,206 | 17.2% |
| Education | 747 | 10.7% |
| Literature & Languages | 330 | 4.7% |
| Liberal Arts & History | 586 | 8.4% |
| Visual & Performing Arts | 253 | 3.6% |
| Communications | 341 | 4.9% |
| Arts & Humanities | 521 | 7.4% |
| Total | 7,004 | 100.0% |
Transportation & Commute in Orcutt
Vehicle Availability by Sex in Orcutt
The most prevalent vehicle ownership categories in Orcutt are males with 2 vehicles (2,960, accounting for 37.3%) and females with 2 vehicles (2,222, making up 47.0%).
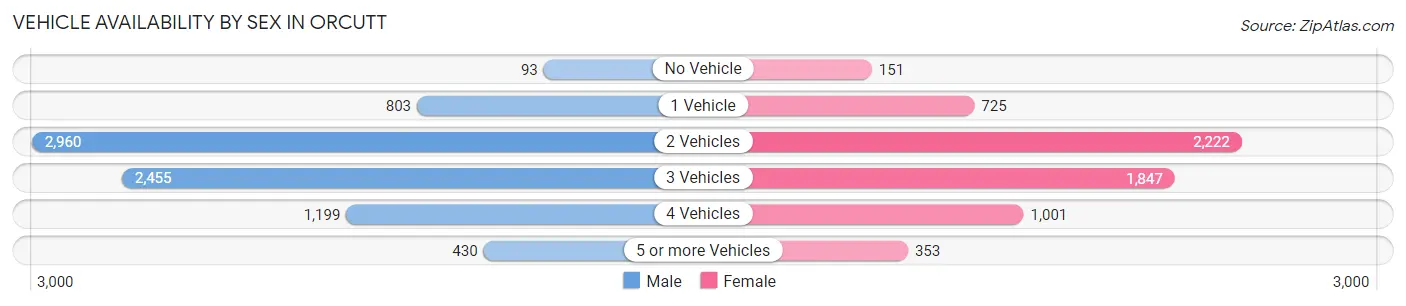
| Vehicles Available | Male | Female |
| No Vehicle | 93 (1.2%) | 151 (2.4%) |
| 1 Vehicle | 803 (10.1%) | 725 (11.5%) |
| 2 Vehicles | 2,960 (37.3%) | 2,222 (35.3%) |
| 3 Vehicles | 2,455 (30.9%) | 1,847 (29.3%) |
| 4 Vehicles | 1,199 (15.1%) | 1,001 (15.9%) |
| 5 or more Vehicles | 430 (5.4%) | 353 (5.6%) |
| Total | 7,940 (100.0%) | 6,299 (100.0%) |
Commute Time in Orcutt
The most frequently occuring commute durations in Orcutt are 10 to 14 minutes (2,998 commuters, 22.8%), 15 to 19 minutes (2,521 commuters, 19.2%), and 5 to 9 minutes (2,149 commuters, 16.3%).
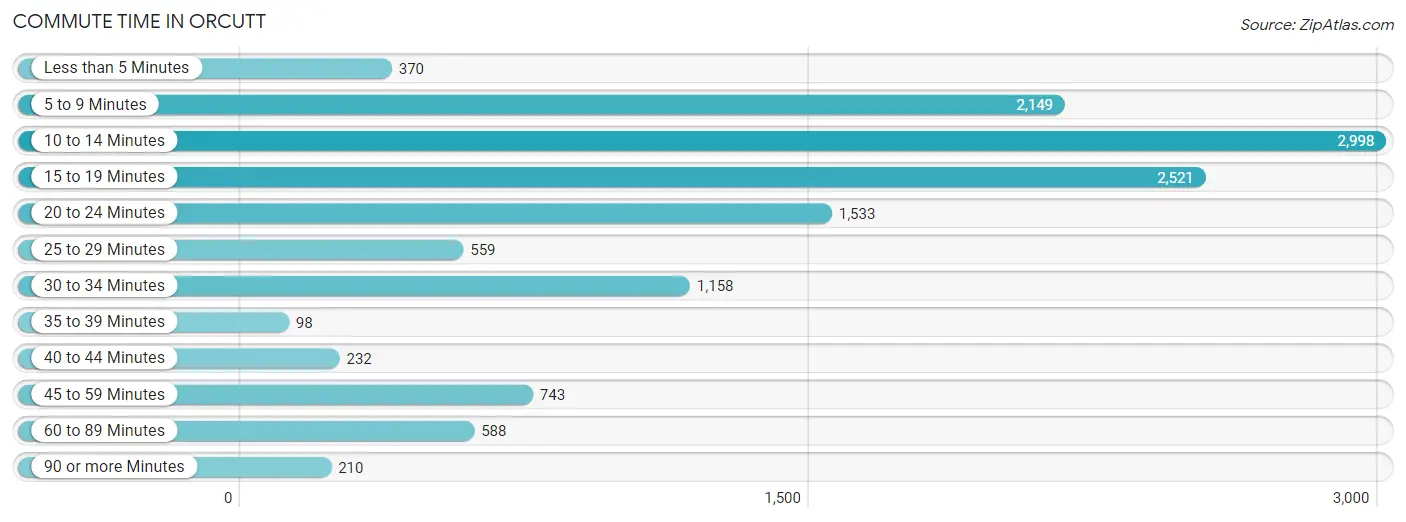
| Commute Time | # Commuters | % Commuters |
| Less than 5 Minutes | 370 | 2.8% |
| 5 to 9 Minutes | 2,149 | 16.3% |
| 10 to 14 Minutes | 2,998 | 22.8% |
| 15 to 19 Minutes | 2,521 | 19.2% |
| 20 to 24 Minutes | 1,533 | 11.7% |
| 25 to 29 Minutes | 559 | 4.3% |
| 30 to 34 Minutes | 1,158 | 8.8% |
| 35 to 39 Minutes | 98 | 0.7% |
| 40 to 44 Minutes | 232 | 1.8% |
| 45 to 59 Minutes | 743 | 5.7% |
| 60 to 89 Minutes | 588 | 4.5% |
| 90 or more Minutes | 210 | 1.6% |
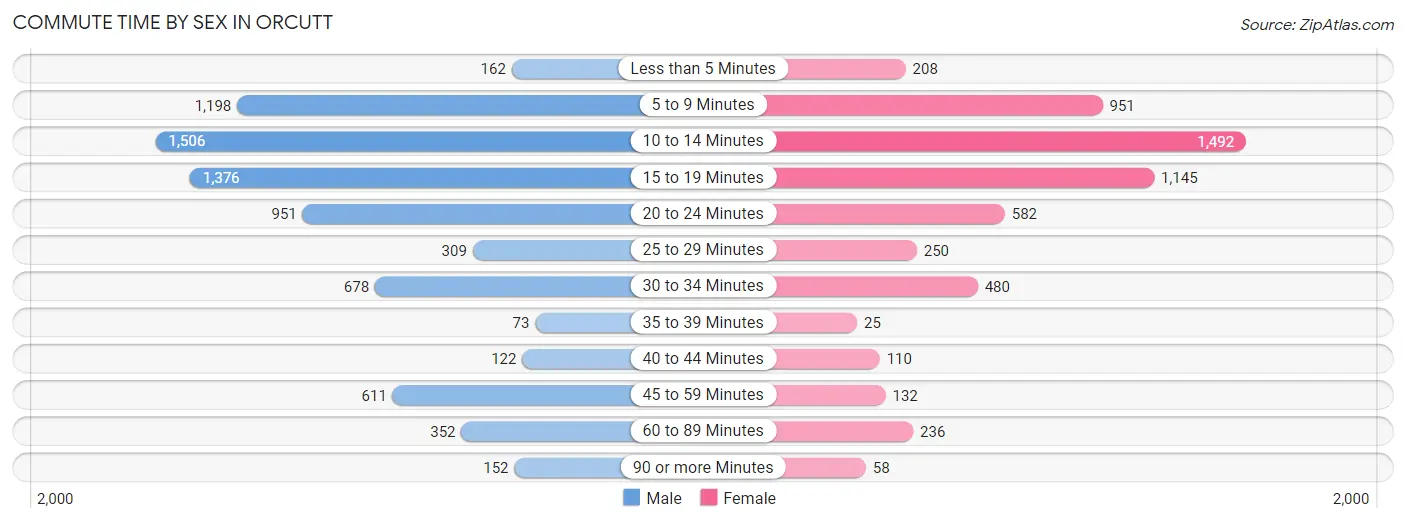
Commute Time by Sex in Orcutt
The most common commute times in Orcutt are 10 to 14 minutes (1,506 commuters, 20.1%) for males and 10 to 14 minutes (1,492 commuters, 26.3%) for females.
| Commute Time | Male | Female |
| Less than 5 Minutes | 162 (2.2%) | 208 (3.7%) |
| 5 to 9 Minutes | 1,198 (16.0%) | 951 (16.8%) |
| 10 to 14 Minutes | 1,506 (20.1%) | 1,492 (26.3%) |
| 15 to 19 Minutes | 1,376 (18.4%) | 1,145 (20.2%) |
| 20 to 24 Minutes | 951 (12.7%) | 582 (10.3%) |
| 25 to 29 Minutes | 309 (4.1%) | 250 (4.4%) |
| 30 to 34 Minutes | 678 (9.0%) | 480 (8.5%) |
| 35 to 39 Minutes | 73 (1.0%) | 25 (0.4%) |
| 40 to 44 Minutes | 122 (1.6%) | 110 (1.9%) |
| 45 to 59 Minutes | 611 (8.2%) | 132 (2.3%) |
| 60 to 89 Minutes | 352 (4.7%) | 236 (4.2%) |
| 90 or more Minutes | 152 (2.0%) | 58 (1.0%) |
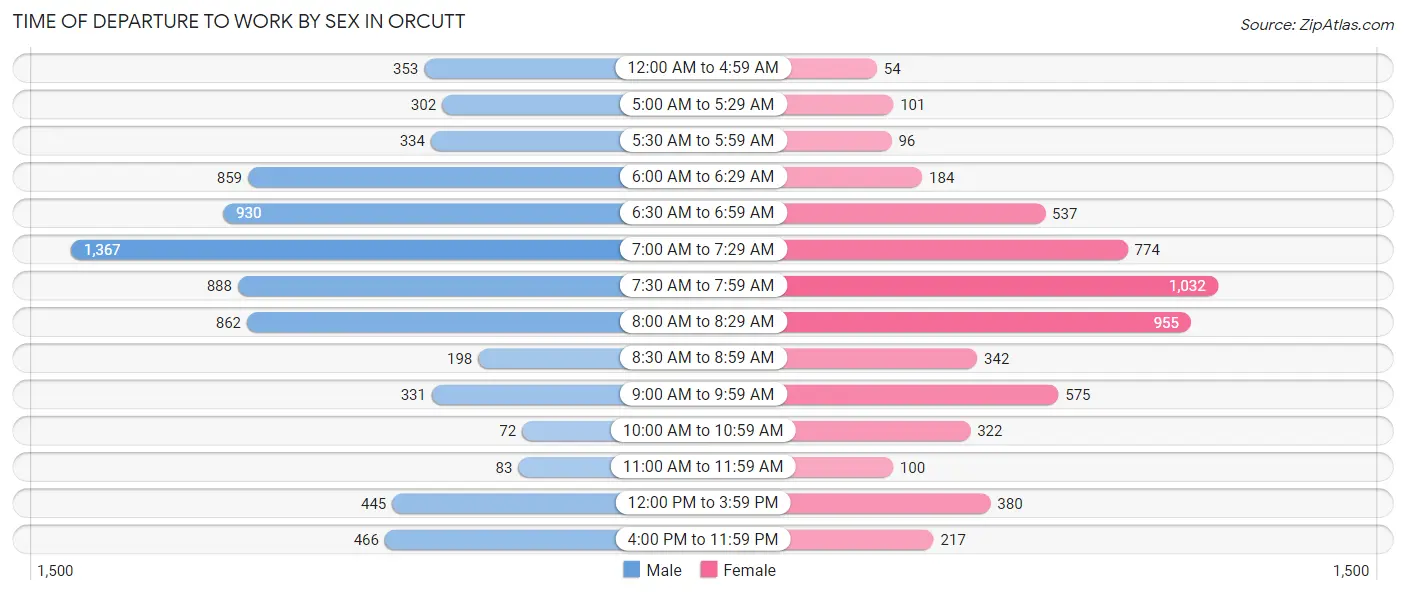
Time of Departure to Work by Sex in Orcutt
The most frequent times of departure to work in Orcutt are 7:00 AM to 7:29 AM (1,367, 18.2%) for males and 7:30 AM to 7:59 AM (1,032, 18.2%) for females.
| Time of Departure | Male | Female |
| 12:00 AM to 4:59 AM | 353 (4.7%) | 54 (0.9%) |
| 5:00 AM to 5:29 AM | 302 (4.0%) | 101 (1.8%) |
| 5:30 AM to 5:59 AM | 334 (4.5%) | 96 (1.7%) |
| 6:00 AM to 6:29 AM | 859 (11.5%) | 184 (3.3%) |
| 6:30 AM to 6:59 AM | 930 (12.4%) | 537 (9.5%) |
| 7:00 AM to 7:29 AM | 1,367 (18.2%) | 774 (13.7%) |
| 7:30 AM to 7:59 AM | 888 (11.9%) | 1,032 (18.2%) |
| 8:00 AM to 8:29 AM | 862 (11.5%) | 955 (16.9%) |
| 8:30 AM to 8:59 AM | 198 (2.6%) | 342 (6.0%) |
| 9:00 AM to 9:59 AM | 331 (4.4%) | 575 (10.1%) |
| 10:00 AM to 10:59 AM | 72 (1.0%) | 322 (5.7%) |
| 11:00 AM to 11:59 AM | 83 (1.1%) | 100 (1.8%) |
| 12:00 PM to 3:59 PM | 445 (5.9%) | 380 (6.7%) |
| 4:00 PM to 11:59 PM | 466 (6.2%) | 217 (3.8%) |
| Total | 7,490 (100.0%) | 5,669 (100.0%) |
Housing Occupancy in Orcutt
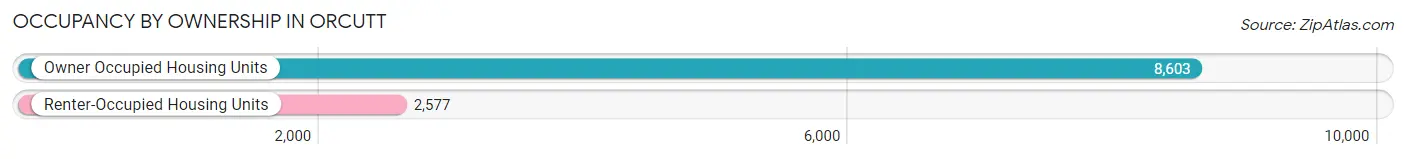
Occupancy by Ownership in Orcutt
Of the total 11,180 dwellings in Orcutt, owner-occupied units account for 8,603 (76.9%), while renter-occupied units make up 2,577 (23.1%).
| Occupancy | # Housing Units | % Housing Units |
| Owner Occupied Housing Units | 8,603 | 76.9% |
| Renter-Occupied Housing Units | 2,577 | 23.1% |
| Total Occupied Housing Units | 11,180 | 100.0% |
Occupancy by Household Size in Orcutt
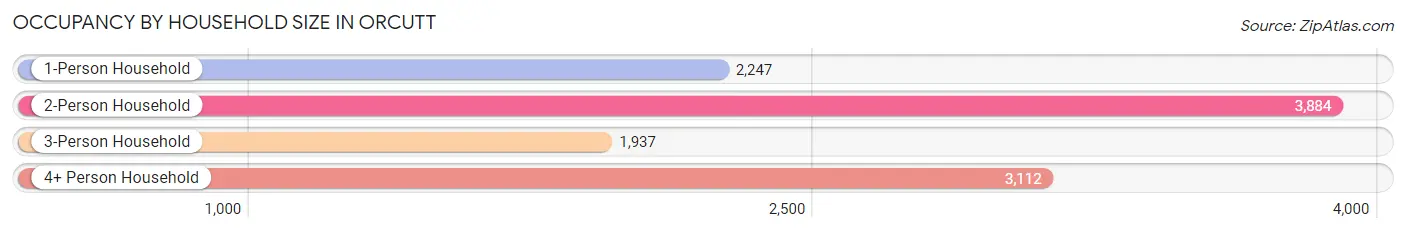
| Household Size | # Housing Units | % Housing Units |
| 1-Person Household | 2,247 | 20.1% |
| 2-Person Household | 3,884 | 34.7% |
| 3-Person Household | 1,937 | 17.3% |
| 4+ Person Household | 3,112 | 27.8% |
| Total Housing Units | 11,180 | 100.0% |
Occupancy by Ownership by Household Size in Orcutt
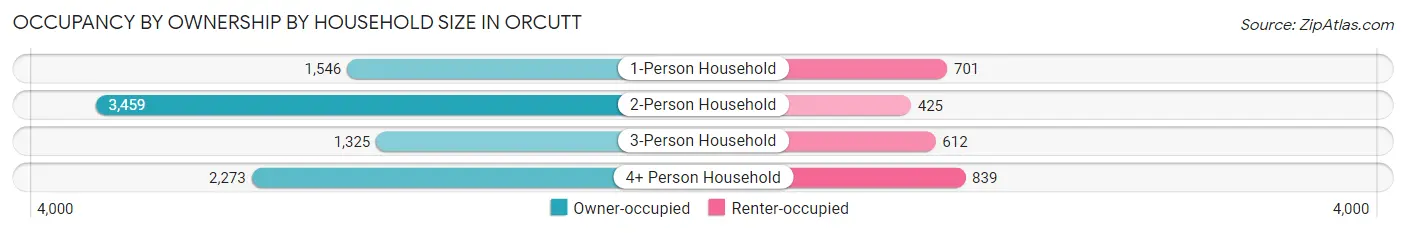
| Household Size | Owner-occupied | Renter-occupied |
| 1-Person Household | 1,546 (68.8%) | 701 (31.2%) |
| 2-Person Household | 3,459 (89.1%) | 425 (10.9%) |
| 3-Person Household | 1,325 (68.4%) | 612 (31.6%) |
| 4+ Person Household | 2,273 (73.0%) | 839 (27.0%) |
| Total Housing Units | 8,603 (76.9%) | 2,577 (23.1%) |
Occupancy by Educational Attainment in Orcutt
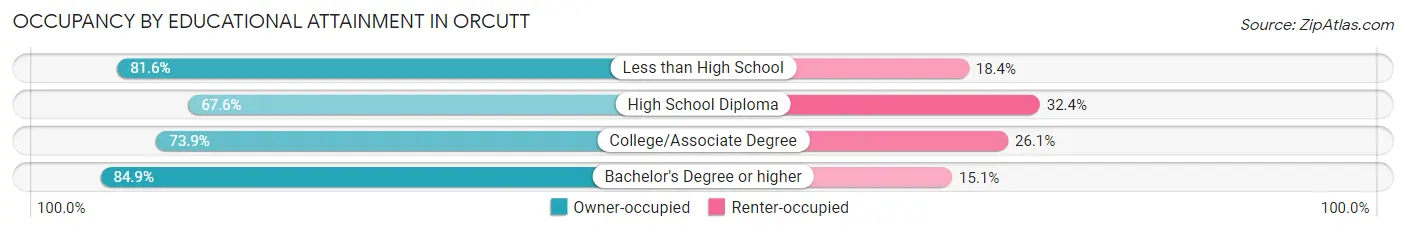
| Household Size | Owner-occupied | Renter-occupied |
| Less than High School | 280 (81.6%) | 63 (18.4%) |
| High School Diploma | 1,256 (67.6%) | 603 (32.4%) |
| College/Associate Degree | 3,727 (73.9%) | 1,319 (26.1%) |
| Bachelor's Degree or higher | 3,340 (84.9%) | 592 (15.1%) |
Occupancy by Age of Householder in Orcutt
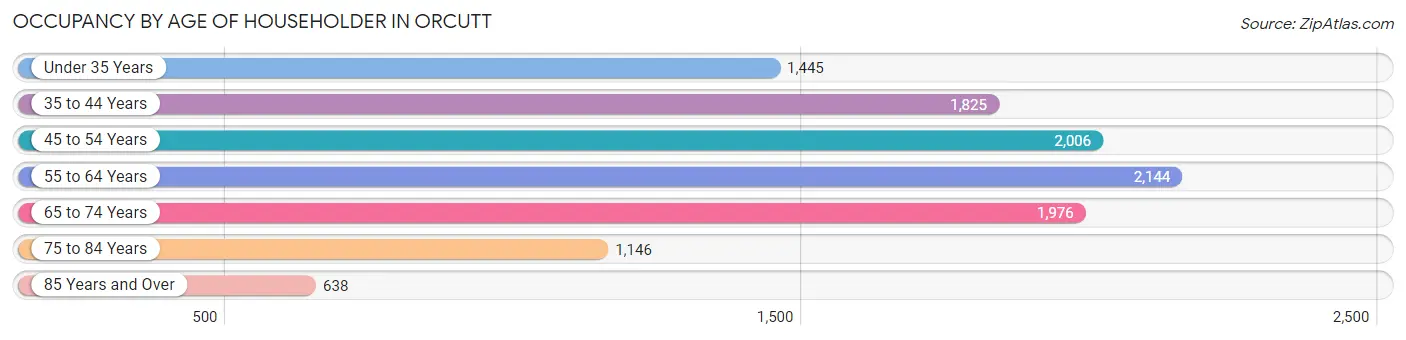
| Age Bracket | # Households | % Households |
| Under 35 Years | 1,445 | 12.9% |
| 35 to 44 Years | 1,825 | 16.3% |
| 45 to 54 Years | 2,006 | 17.9% |
| 55 to 64 Years | 2,144 | 19.2% |
| 65 to 74 Years | 1,976 | 17.7% |
| 75 to 84 Years | 1,146 | 10.2% |
| 85 Years and Over | 638 | 5.7% |
| Total | 11,180 | 100.0% |
Housing Finances in Orcutt
Median Income by Occupancy in Orcutt
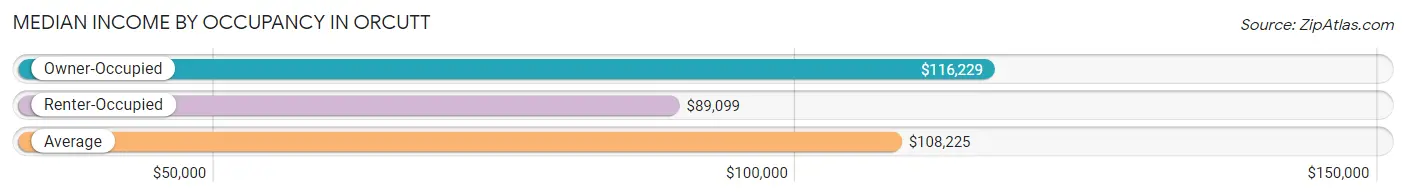
| Occupancy Type | # Households | Median Income |
| Owner-Occupied | 8,603 (76.9%) | $116,229 |
| Renter-Occupied | 2,577 (23.1%) | $89,099 |
| Average | 11,180 (100.0%) | $108,225 |
Occupancy by Householder Income Bracket in Orcutt
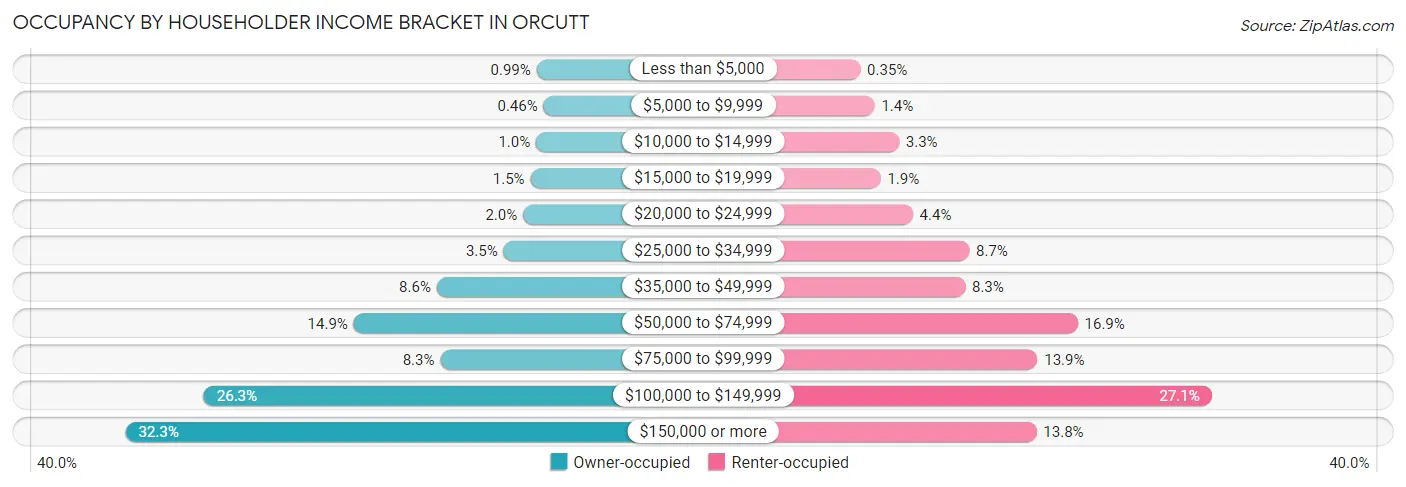
| Income Bracket | Owner-occupied | Renter-occupied |
| Less than $5,000 | 85 (1.0%) | 9 (0.4%) |
| $5,000 to $9,999 | 40 (0.5%) | 37 (1.4%) |
| $10,000 to $14,999 | 89 (1.0%) | 85 (3.3%) |
| $15,000 to $19,999 | 126 (1.5%) | 49 (1.9%) |
| $20,000 to $24,999 | 174 (2.0%) | 112 (4.3%) |
| $25,000 to $34,999 | 302 (3.5%) | 223 (8.6%) |
| $35,000 to $49,999 | 740 (8.6%) | 215 (8.3%) |
| $50,000 to $74,999 | 1,284 (14.9%) | 436 (16.9%) |
| $75,000 to $99,999 | 717 (8.3%) | 357 (13.9%) |
| $100,000 to $149,999 | 2,266 (26.3%) | 699 (27.1%) |
| $150,000 or more | 2,780 (32.3%) | 355 (13.8%) |
| Total | 8,603 (100.0%) | 2,577 (100.0%) |
Monthly Housing Cost Tiers in Orcutt
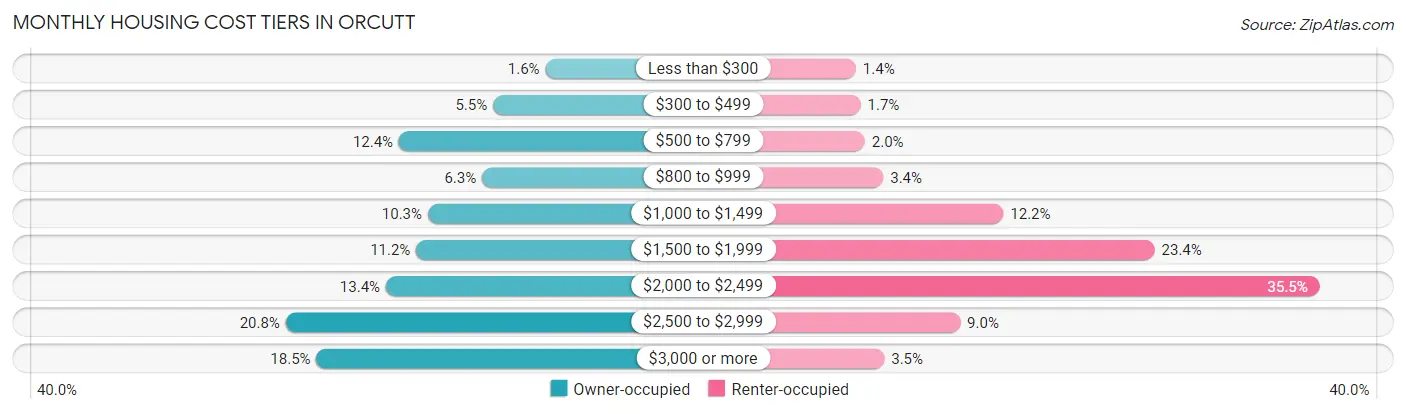
| Monthly Cost | Owner-occupied | Renter-occupied |
| Less than $300 | 141 (1.6%) | 35 (1.4%) |
| $300 to $499 | 473 (5.5%) | 44 (1.7%) |
| $500 to $799 | 1,069 (12.4%) | 52 (2.0%) |
| $800 to $999 | 543 (6.3%) | 87 (3.4%) |
| $1,000 to $1,499 | 886 (10.3%) | 315 (12.2%) |
| $1,500 to $1,999 | 960 (11.2%) | 602 (23.4%) |
| $2,000 to $2,499 | 1,152 (13.4%) | 915 (35.5%) |
| $2,500 to $2,999 | 1,787 (20.8%) | 233 (9.0%) |
| $3,000 or more | 1,592 (18.5%) | 89 (3.5%) |
| Total | 8,603 (100.0%) | 2,577 (100.0%) |
Physical Housing Characteristics in Orcutt
Housing Structures in Orcutt
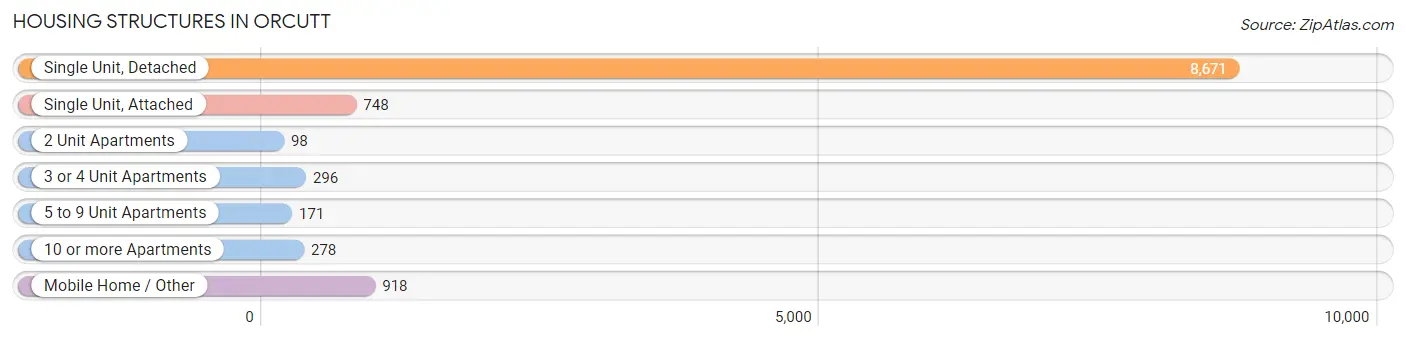
| Structure Type | # Housing Units | % Housing Units |
| Single Unit, Detached | 8,671 | 77.6% |
| Single Unit, Attached | 748 | 6.7% |
| 2 Unit Apartments | 98 | 0.9% |
| 3 or 4 Unit Apartments | 296 | 2.6% |
| 5 to 9 Unit Apartments | 171 | 1.5% |
| 10 or more Apartments | 278 | 2.5% |
| Mobile Home / Other | 918 | 8.2% |
| Total | 11,180 | 100.0% |
Housing Structures by Occupancy in Orcutt
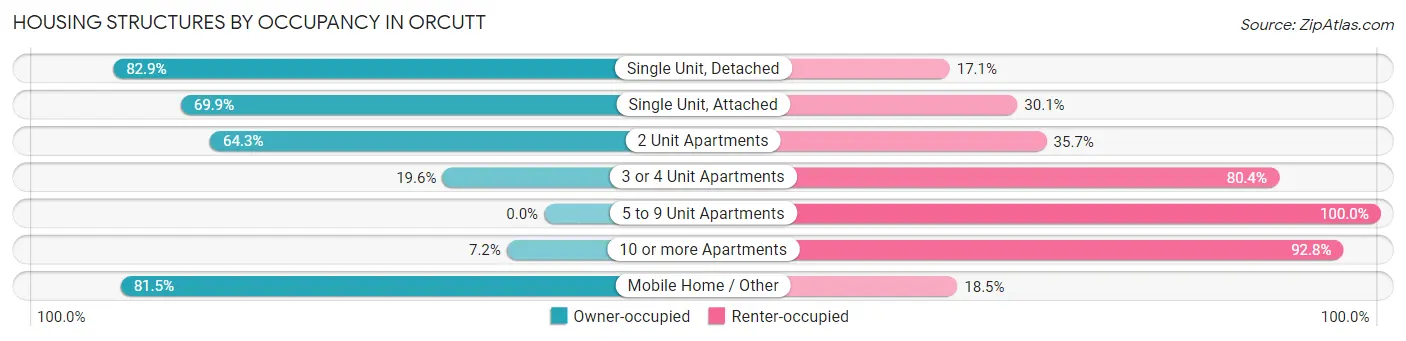
| Structure Type | Owner-occupied | Renter-occupied |
| Single Unit, Detached | 7,191 (82.9%) | 1,480 (17.1%) |
| Single Unit, Attached | 523 (69.9%) | 225 (30.1%) |
| 2 Unit Apartments | 63 (64.3%) | 35 (35.7%) |
| 3 or 4 Unit Apartments | 58 (19.6%) | 238 (80.4%) |
| 5 to 9 Unit Apartments | 0 (0.0%) | 171 (100.0%) |
| 10 or more Apartments | 20 (7.2%) | 258 (92.8%) |
| Mobile Home / Other | 748 (81.5%) | 170 (18.5%) |
| Total | 8,603 (76.9%) | 2,577 (23.1%) |
Housing Structures by Number of Rooms in Orcutt
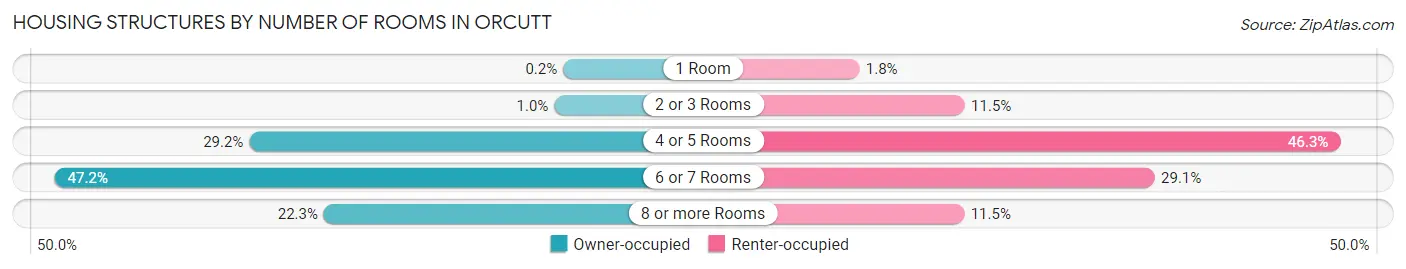
| Number of Rooms | Owner-occupied | Renter-occupied |
| 1 Room | 17 (0.2%) | 45 (1.8%) |
| 2 or 3 Rooms | 88 (1.0%) | 296 (11.5%) |
| 4 or 5 Rooms | 2,515 (29.2%) | 1,192 (46.3%) |
| 6 or 7 Rooms | 4,062 (47.2%) | 749 (29.1%) |
| 8 or more Rooms | 1,921 (22.3%) | 295 (11.5%) |
| Total | 8,603 (100.0%) | 2,577 (100.0%) |
Housing Structure by Heating Type in Orcutt
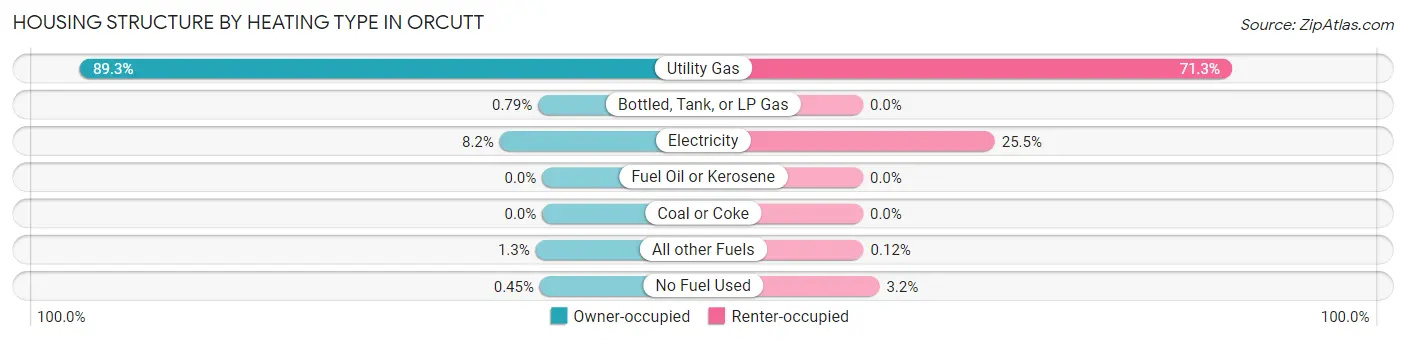
| Heating Type | Owner-occupied | Renter-occupied |
| Utility Gas | 7,682 (89.3%) | 1,836 (71.3%) |
| Bottled, Tank, or LP Gas | 68 (0.8%) | 0 (0.0%) |
| Electricity | 706 (8.2%) | 656 (25.5%) |
| Fuel Oil or Kerosene | 0 (0.0%) | 0 (0.0%) |
| Coal or Coke | 0 (0.0%) | 0 (0.0%) |
| All other Fuels | 108 (1.3%) | 3 (0.1%) |
| No Fuel Used | 39 (0.4%) | 82 (3.2%) |
| Total | 8,603 (100.0%) | 2,577 (100.0%) |
Household Vehicle Usage in Orcutt
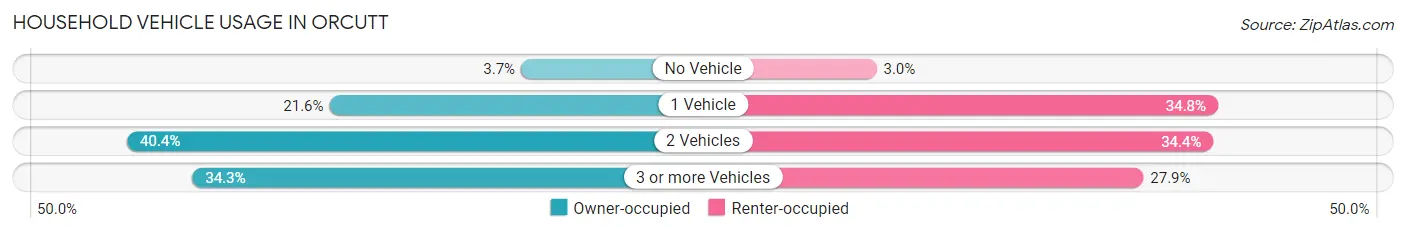
| Vehicles per Household | Owner-occupied | Renter-occupied |
| No Vehicle | 316 (3.7%) | 76 (2.9%) |
| 1 Vehicle | 1,854 (21.5%) | 897 (34.8%) |
| 2 Vehicles | 3,479 (40.4%) | 886 (34.4%) |
| 3 or more Vehicles | 2,954 (34.3%) | 718 (27.9%) |
| Total | 8,603 (100.0%) | 2,577 (100.0%) |
Real Estate & Mortgages in Orcutt
Real Estate and Mortgage Overview in Orcutt
| Characteristic | Without Mortgage | With Mortgage |
| Housing Units | 2,700 | 5,903 |
| Median Property Value | $504,100 | $564,100 |
| Median Household Income | $66,192 | $2,370 |
| Monthly Housing Costs | $694 | $1,580 |
| Real Estate Taxes | $3,693 | $138 |
Property Value by Mortgage Status in Orcutt
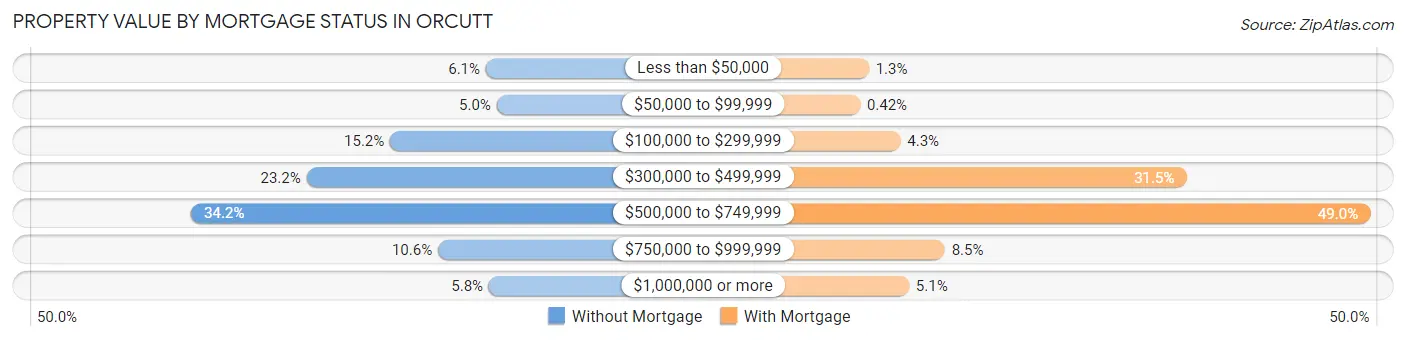
| Property Value | Without Mortgage | With Mortgage |
| Less than $50,000 | 164 (6.1%) | 74 (1.3%) |
| $50,000 to $99,999 | 136 (5.0%) | 25 (0.4%) |
| $100,000 to $299,999 | 410 (15.2%) | 252 (4.3%) |
| $300,000 to $499,999 | 625 (23.2%) | 1,859 (31.5%) |
| $500,000 to $749,999 | 922 (34.2%) | 2,892 (49.0%) |
| $750,000 to $999,999 | 287 (10.6%) | 501 (8.5%) |
| $1,000,000 or more | 156 (5.8%) | 300 (5.1%) |
| Total | 2,700 (100.0%) | 5,903 (100.0%) |
Household Income by Mortgage Status in Orcutt
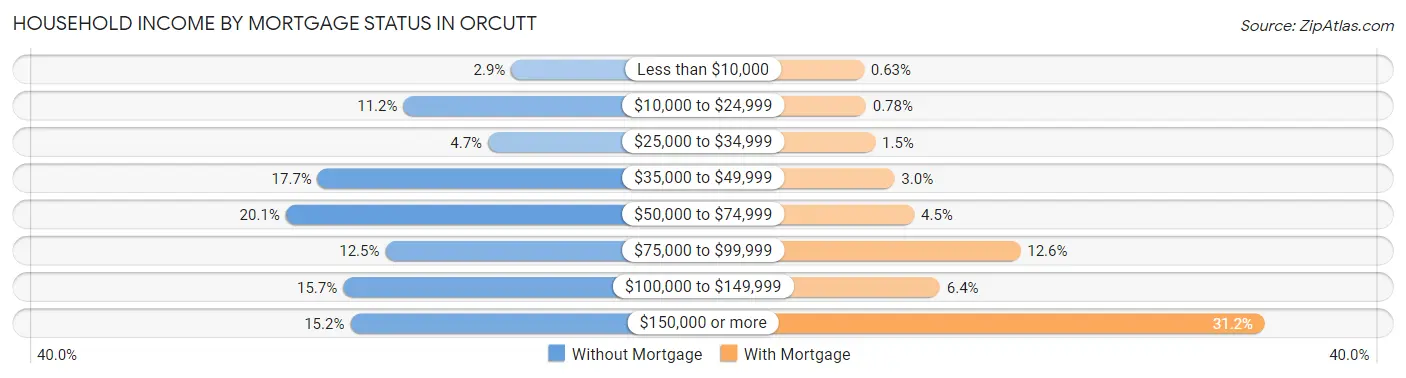
| Household Income | Without Mortgage | With Mortgage |
| Less than $10,000 | 79 (2.9%) | 37 (0.6%) |
| $10,000 to $24,999 | 301 (11.2%) | 46 (0.8%) |
| $25,000 to $34,999 | 127 (4.7%) | 88 (1.5%) |
| $35,000 to $49,999 | 477 (17.7%) | 175 (3.0%) |
| $50,000 to $74,999 | 543 (20.1%) | 263 (4.5%) |
| $75,000 to $99,999 | 338 (12.5%) | 741 (12.6%) |
| $100,000 to $149,999 | 425 (15.7%) | 379 (6.4%) |
| $150,000 or more | 410 (15.2%) | 1,841 (31.2%) |
| Total | 2,700 (100.0%) | 5,903 (100.0%) |
Property Value to Household Income Ratio in Orcutt
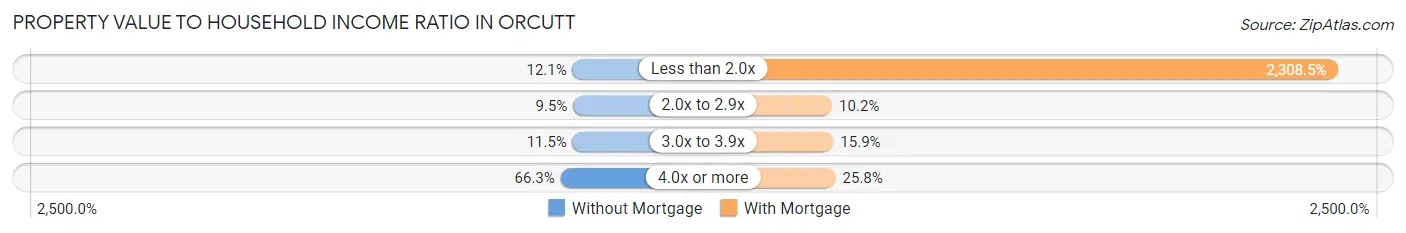
| Value-to-Income Ratio | Without Mortgage | With Mortgage |
| Less than 2.0x | 327 (12.1%) | 136,272 (2,308.5%) |
| 2.0x to 2.9x | 256 (9.5%) | 602 (10.2%) |
| 3.0x to 3.9x | 311 (11.5%) | 938 (15.9%) |
| 4.0x or more | 1,791 (66.3%) | 1,523 (25.8%) |
| Total | 2,700 (100.0%) | 5,903 (100.0%) |
Real Estate Taxes by Mortgage Status in Orcutt
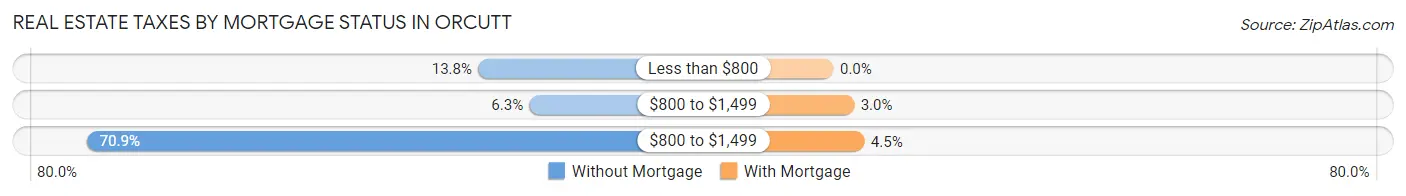
| Property Taxes | Without Mortgage | With Mortgage |
| Less than $800 | 372 (13.8%) | 0 (0.0%) |
| $800 to $1,499 | 170 (6.3%) | 178 (3.0%) |
| $800 to $1,499 | 1,915 (70.9%) | 266 (4.5%) |
| Total | 2,700 (100.0%) | 5,903 (100.0%) |
Health & Disability in Orcutt
Health Insurance Coverage by Age in Orcutt
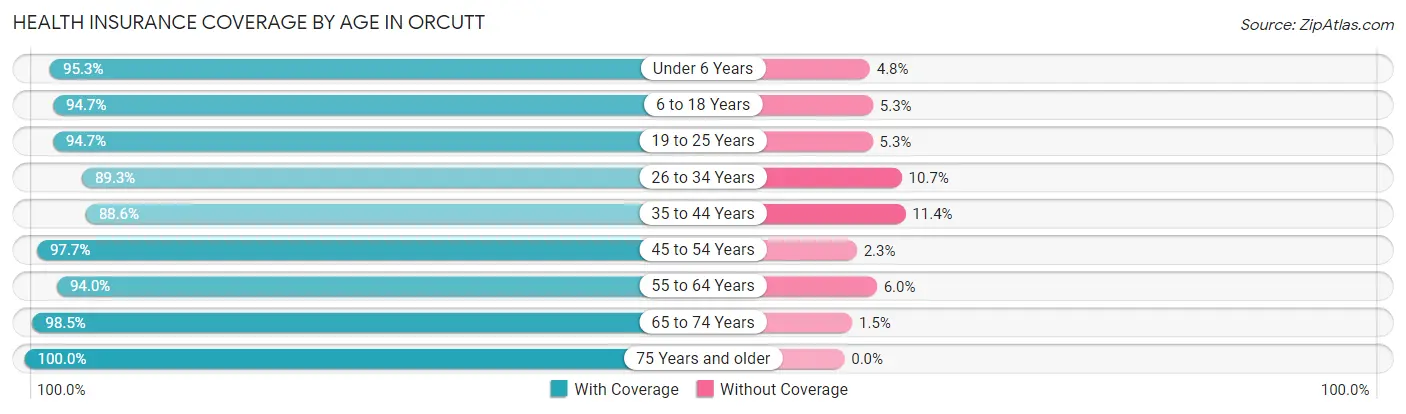
| Age Bracket | With Coverage | Without Coverage |
| Under 6 Years | 1,925 (95.3%) | 96 (4.8%) |
| 6 to 18 Years | 5,248 (94.7%) | 295 (5.3%) |
| 19 to 25 Years | 2,621 (94.7%) | 146 (5.3%) |
| 26 to 34 Years | 2,679 (89.3%) | 321 (10.7%) |
| 35 to 44 Years | 3,333 (88.6%) | 429 (11.4%) |
| 45 to 54 Years | 3,623 (97.7%) | 86 (2.3%) |
| 55 to 64 Years | 3,918 (94.0%) | 252 (6.0%) |
| 65 to 74 Years | 3,237 (98.5%) | 48 (1.5%) |
| 75 Years and older | 2,771 (100.0%) | 0 (0.0%) |
| Total | 29,355 (94.6%) | 1,673 (5.4%) |
Health Insurance Coverage by Citizenship Status in Orcutt
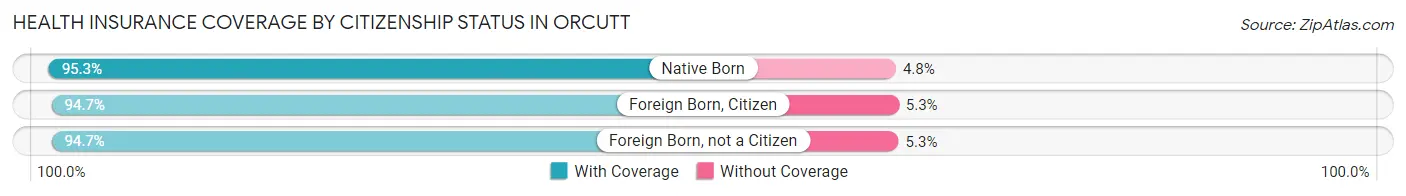
| Citizenship Status | With Coverage | Without Coverage |
| Native Born | 1,925 (95.3%) | 96 (4.8%) |
| Foreign Born, Citizen | 5,248 (94.7%) | 295 (5.3%) |
| Foreign Born, not a Citizen | 2,621 (94.7%) | 146 (5.3%) |
Health Insurance Coverage by Household Income in Orcutt
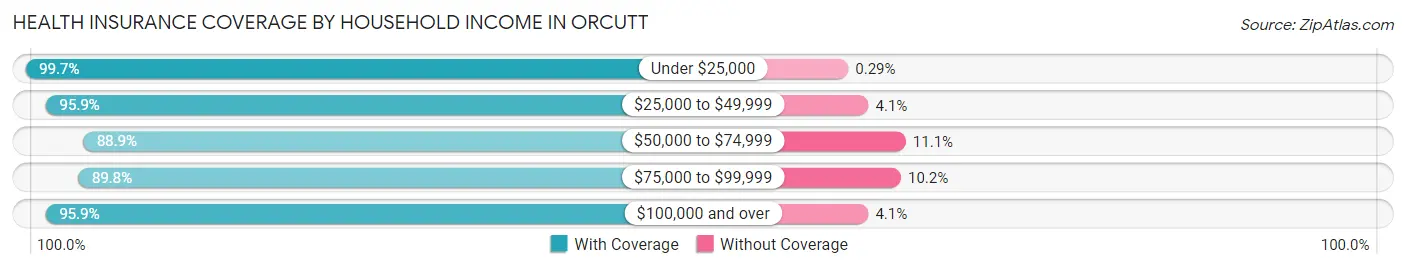
| Household Income | With Coverage | Without Coverage |
| Under $25,000 | 1,375 (99.7%) | 4 (0.3%) |
| $25,000 to $49,999 | 2,745 (95.9%) | 117 (4.1%) |
| $50,000 to $74,999 | 3,401 (88.9%) | 424 (11.1%) |
| $75,000 to $99,999 | 2,776 (89.8%) | 314 (10.2%) |
| $100,000 and over | 18,876 (95.9%) | 798 (4.1%) |
Public vs Private Health Insurance Coverage by Age in Orcutt
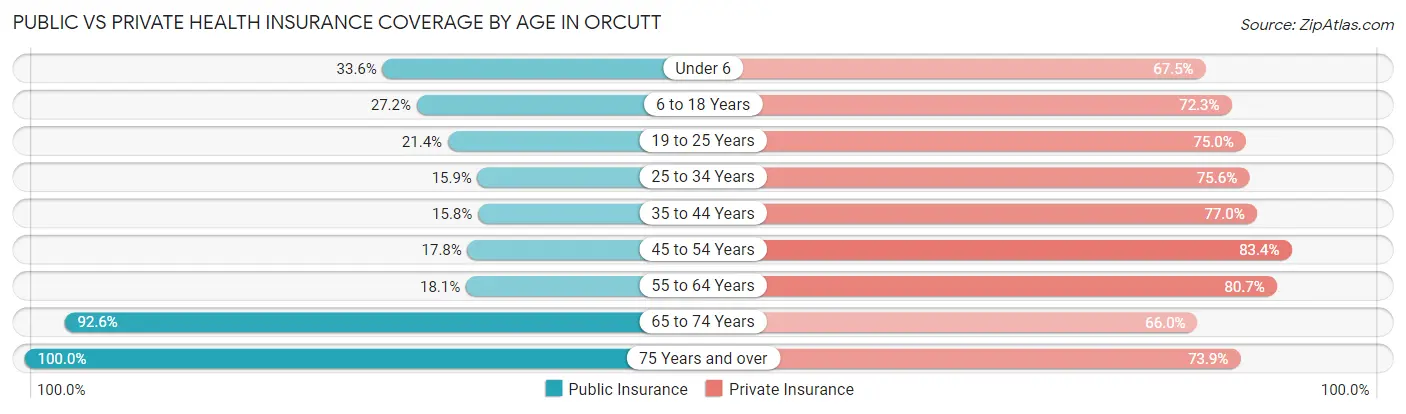
| Age Bracket | Public Insurance | Private Insurance |
| Under 6 | 678 (33.6%) | 1,364 (67.5%) |
| 6 to 18 Years | 1,508 (27.2%) | 4,007 (72.3%) |
| 19 to 25 Years | 593 (21.4%) | 2,074 (75.0%) |
| 25 to 34 Years | 477 (15.9%) | 2,267 (75.6%) |
| 35 to 44 Years | 595 (15.8%) | 2,896 (77.0%) |
| 45 to 54 Years | 659 (17.8%) | 3,094 (83.4%) |
| 55 to 64 Years | 753 (18.1%) | 3,365 (80.7%) |
| 65 to 74 Years | 3,042 (92.6%) | 2,168 (66.0%) |
| 75 Years and over | 2,771 (100.0%) | 2,049 (73.9%) |
| Total | 11,076 (35.7%) | 23,284 (75.0%) |
Disability Status by Sex by Age in Orcutt
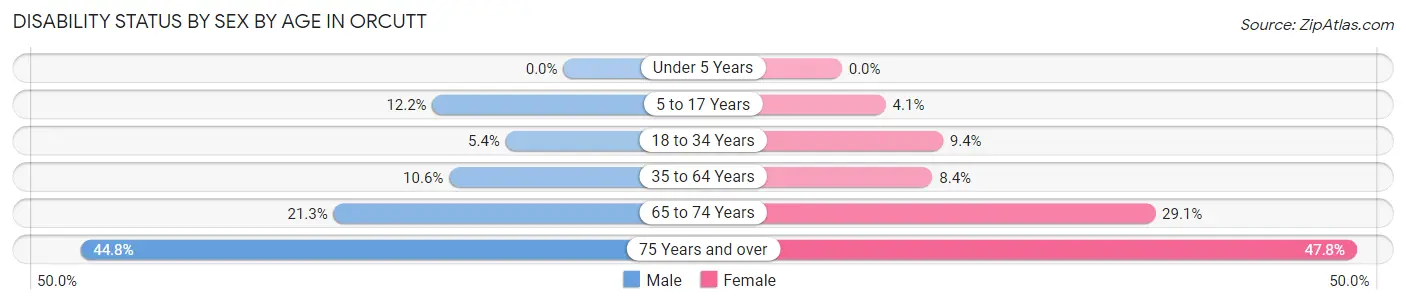
| Age Bracket | Male | Female |
| Under 5 Years | 0 (0.0%) | 0 (0.0%) |
| 5 to 17 Years | 355 (12.1%) | 103 (4.1%) |
| 18 to 34 Years | 173 (5.3%) | 280 (9.4%) |
| 35 to 64 Years | 638 (10.6%) | 472 (8.4%) |
| 65 to 74 Years | 356 (21.3%) | 470 (29.1%) |
| 75 Years and over | 477 (44.8%) | 816 (47.8%) |
Disability Class by Sex by Age in Orcutt
Disability Class: Hearing Difficulty
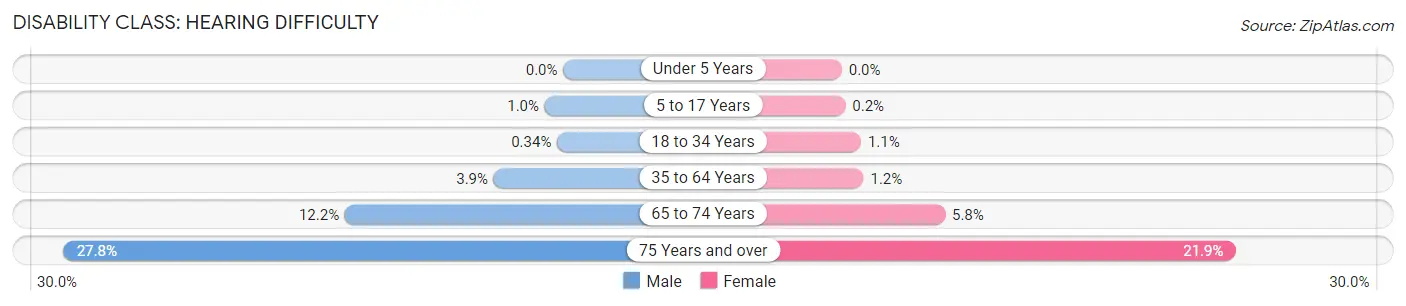
| Age Bracket | Male | Female |
| Under 5 Years | 0 (0.0%) | 0 (0.0%) |
| 5 to 17 Years | 30 (1.0%) | 5 (0.2%) |
| 18 to 34 Years | 11 (0.3%) | 32 (1.1%) |
| 35 to 64 Years | 233 (3.9%) | 68 (1.2%) |
| 65 to 74 Years | 203 (12.2%) | 93 (5.8%) |
| 75 Years and over | 296 (27.8%) | 374 (21.9%) |
Disability Class: Vision Difficulty
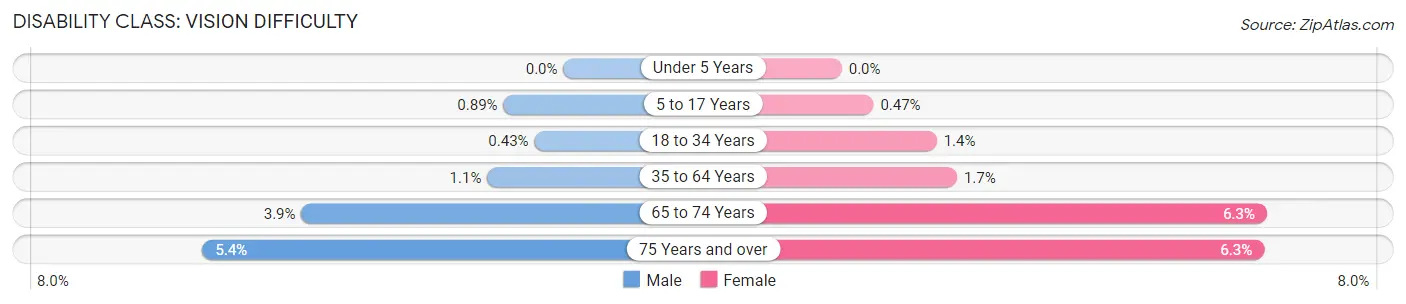
| Age Bracket | Male | Female |
| Under 5 Years | 0 (0.0%) | 0 (0.0%) |
| 5 to 17 Years | 26 (0.9%) | 12 (0.5%) |
| 18 to 34 Years | 14 (0.4%) | 42 (1.4%) |
| 35 to 64 Years | 68 (1.1%) | 96 (1.7%) |
| 65 to 74 Years | 65 (3.9%) | 102 (6.3%) |
| 75 Years and over | 57 (5.4%) | 107 (6.3%) |
Disability Class: Cognitive Difficulty

| Age Bracket | Male | Female |
| 5 to 17 Years | 332 (11.4%) | 98 (3.9%) |
| 18 to 34 Years | 124 (3.8%) | 77 (2.6%) |
| 35 to 64 Years | 199 (3.3%) | 242 (4.3%) |
| 65 to 74 Years | 94 (5.6%) | 102 (6.3%) |
| 75 Years and over | 86 (8.1%) | 246 (14.4%) |
Disability Class: Ambulatory Difficulty
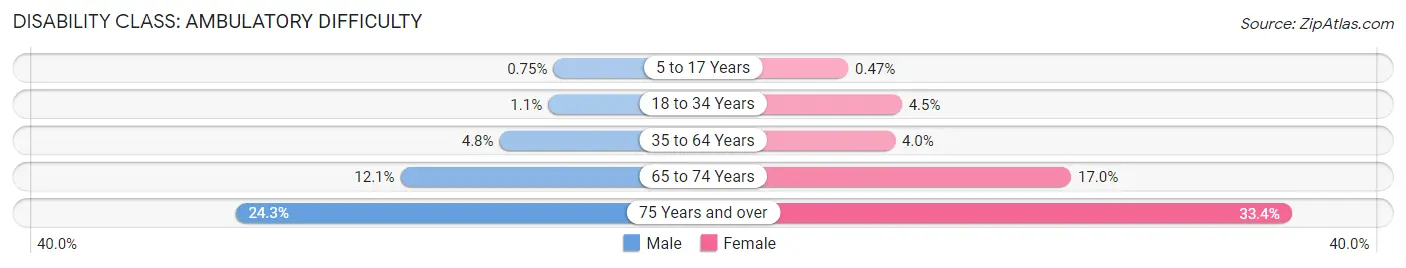
| Age Bracket | Male | Female |
| 5 to 17 Years | 22 (0.7%) | 12 (0.5%) |
| 18 to 34 Years | 37 (1.1%) | 133 (4.4%) |
| 35 to 64 Years | 286 (4.8%) | 222 (4.0%) |
| 65 to 74 Years | 202 (12.1%) | 275 (17.0%) |
| 75 Years and over | 259 (24.3%) | 570 (33.4%) |
Disability Class: Self-Care Difficulty
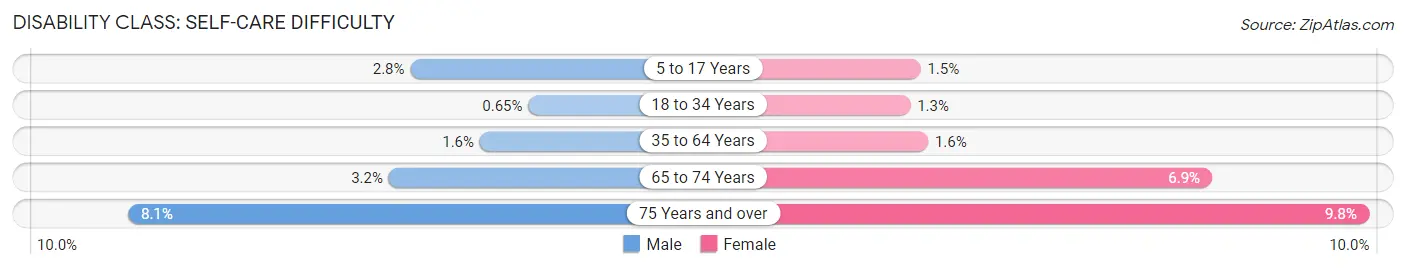
| Age Bracket | Male | Female |
| 5 to 17 Years | 83 (2.8%) | 37 (1.5%) |
| 18 to 34 Years | 21 (0.6%) | 38 (1.3%) |
| 35 to 64 Years | 93 (1.5%) | 90 (1.6%) |
| 65 to 74 Years | 54 (3.2%) | 111 (6.9%) |
| 75 Years and over | 86 (8.1%) | 167 (9.8%) |
Technology Access in Orcutt
Computing Device Access in Orcutt
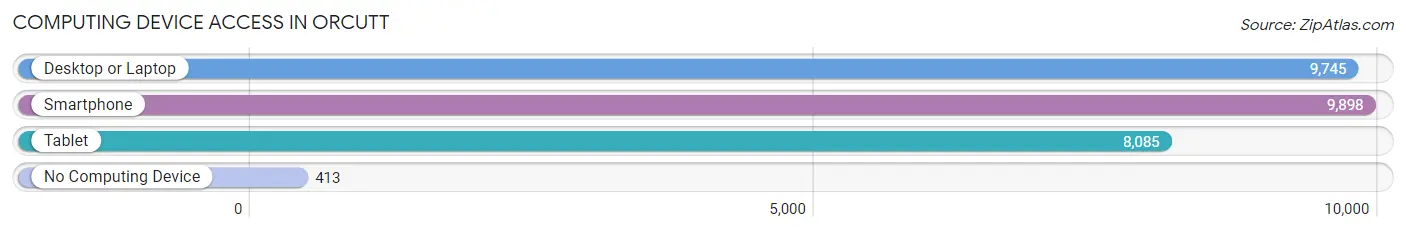
| Device Type | # Households | % Households |
| Desktop or Laptop | 9,745 | 87.2% |
| Smartphone | 9,898 | 88.5% |
| Tablet | 8,085 | 72.3% |
| No Computing Device | 413 | 3.7% |
| Total | 11,180 | 100.0% |
Internet Access in Orcutt
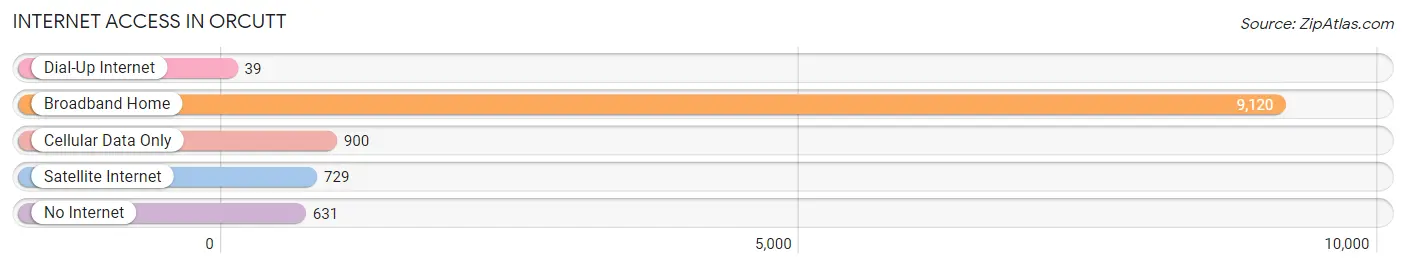
| Internet Type | # Households | % Households |
| Dial-Up Internet | 39 | 0.4% |
| Broadband Home | 9,120 | 81.6% |
| Cellular Data Only | 900 | 8.1% |
| Satellite Internet | 729 | 6.5% |
| No Internet | 631 | 5.6% |
| Total | 11,180 | 100.0% |
Orcutt Summary
Orcutt is a census-designated place (CDP) located in the Santa Maria Valley of Santa Barbara County, California. It is located approximately 8 miles (13 km) northwest of the city of Santa Maria and is part of the Santa Maria-Santa Barbara-Lompoc Metropolitan Statistical Area. The population was 8,780 at the 2010 census, up from 8,389 at the 2000 census.
History
The area now known as Orcutt was originally inhabited by the Chumash people, who lived in the area for thousands of years. The first European to explore the area was Spanish explorer Gaspar de Portolà, who passed through the area in 1769. The area was later settled by ranchers in the late 19th century. The town was named after William Warren Orcutt, a geologist and paleontologist who worked for the Union Oil Company. The town was officially founded in 1887.
Geography
Orcutt is located at 34°51'25" North, 120°25'17" West (34.856944, -120.421389). It is situated in the Santa Maria Valley, between the Santa Ynez Mountains to the north and the Purisima Hills to the south. The town is located approximately 8 miles (13 km) northwest of the city of Santa Maria.
According to the United States Census Bureau, the CDP has a total area of 4.3 square miles (11.2 km2), all of it land.
Economy
The economy of Orcutt is largely based on agriculture and tourism. The town is home to several wineries, including the Orcutt Ranch Winery, which produces a variety of wines. The town is also home to several restaurants, including the popular Orcutt Burger.
Demographics
As of the census of 2000, there were 8,389 people, 2,945 households, and 2,092 families residing in the CDP. The population density was 1,945.3 people per square mile (750.2/km2). There were 3,068 housing units at an average density of 714.3 per square mile (275.7/km2). The racial makeup of the CDP was 77.2% White, 0.9% African American, 1.2% Native American, 1.3% Asian, 0.2% Pacific Islander, 15.2% from other races, and 4.0% from two or more races. Hispanic or Latino of any race were 33.2% of the population.
There were 2,945 households, out of which 37.2% had children under the age of 18 living with them, 51.2% were married couples living together, 13.2% had a female householder with no husband present, and 29.2% were non-families. 22.2% of all households were made up of individuals, and 8.2% had someone living alone who was 65 years of age or older. The average household size was 2.84 and the average family size was 3.33.
In the CDP, the population was spread out, with 29.2% under the age of 18, 9.2% from 18 to 24, 29.7% from 25 to 44, 21.2% from 45 to 64, and 10.7% who were 65 years of age or older. The median age was 33 years. For every 100 females, there were 97.2 males. For every 100 females age 18 and over, there were 94.2 males.
The median income for a household in the CDP was $45,945, and the median income for a family was $50,945. Males had a median income of $37,945 versus $27,945 for females. The per capita income for the CDP was $19,945. About 8.2% of families and 10.2% of the population were below the poverty line, including 13.2% of those under age 18 and 6.2% of those age 65 or over.
Common Questions
What is Per Capita Income in Orcutt?
Per Capita income in Orcutt is $46,586.
What is the Median Family Income in Orcutt?
Median Family Income in Orcutt is $121,215.
What is the Median Household income in Orcutt?
Median Household Income in Orcutt is $108,225.
What is Income or Wage Gap in Orcutt?
Income or Wage Gap in Orcutt is 41.5%.
Women in Orcutt earn 58.5 cents for every dollar earned by a man.
What is Inequality or Gini Index in Orcutt?
Inequality or Gini Index in Orcutt is 0.41.
What is the Total Population of Orcutt?
Total Population of Orcutt is 31,137.
What is the Total Male Population of Orcutt?
Total Male Population of Orcutt is 15,869.
What is the Total Female Population of Orcutt?
Total Female Population of Orcutt is 15,268.
What is the Ratio of Males per 100 Females in Orcutt?
There are 103.94 Males per 100 Females in Orcutt.
What is the Ratio of Females per 100 Males in Orcutt?
There are 96.21 Females per 100 Males in Orcutt.
What is the Median Population Age in Orcutt?
Median Population Age in Orcutt is 40.0 Years.
What is the Average Family Size in Orcutt
Average Family Size in Orcutt is 3.2 People.
What is the Average Household Size in Orcutt
Average Household Size in Orcutt is 2.8 People.
How Large is the Labor Force in Orcutt?
There are 15,143 People in the Labor Forcein in Orcutt.
What is the Percentage of People in the Labor Force in Orcutt?
60.4% of People are in the Labor Force in Orcutt.
What is the Unemployment Rate in Orcutt?
Unemployment Rate in Orcutt is 4.2%.