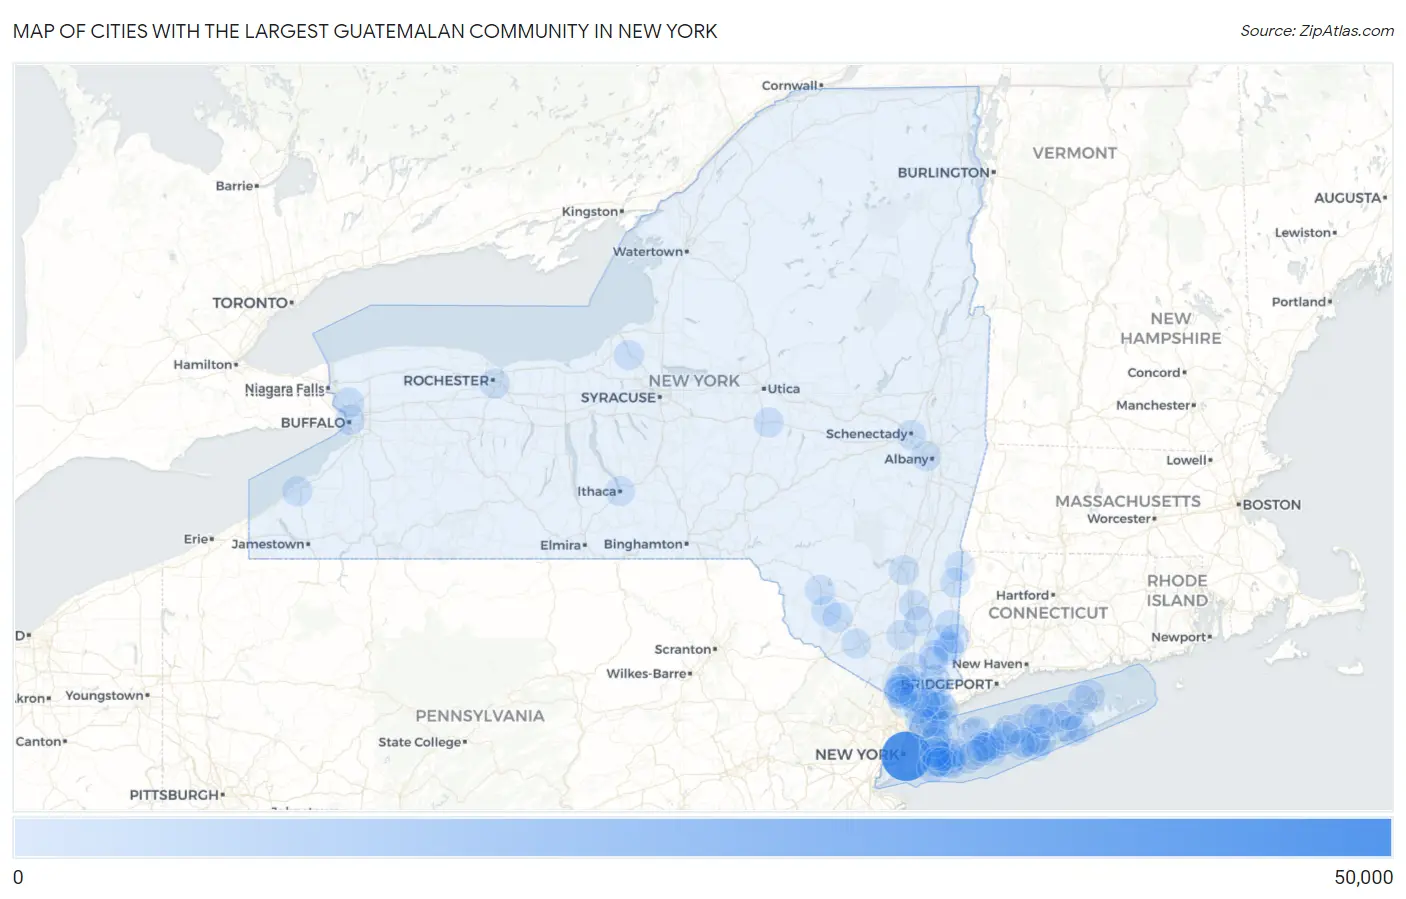
Cities with the Largest Guatemalan Community in New York
RELATED REPORTS & OPTIONS
Guatemalan
New York
Compare Cities
Map of Cities with the Largest Guatemalan Community in New York
0
50,000
Cities with the Largest Guatemalan Community in New York
| City | Guatemalan | vs State | vs National | |
| 1. | New York | 43,920 | 94,808(46.33%)#1 | 1,669,094(2.63%)#2 |
| 2. | Port Chester | 3,159 | 94,808(3.33%)#2 | 1,669,094(0.19%)#66 |
| 3. | Spring Valley | 2,101 | 94,808(2.22%)#3 | 1,669,094(0.13%)#111 |
| 4. | Mount Kisco | 2,079 | 94,808(2.19%)#4 | 1,669,094(0.12%)#114 |
| 5. | New Rochelle | 1,971 | 94,808(2.08%)#5 | 1,669,094(0.12%)#120 |
| 6. | Yonkers | 1,685 | 94,808(1.78%)#6 | 1,669,094(0.10%)#149 |
| 7. | Hempstead | 1,324 | 94,808(1.40%)#7 | 1,669,094(0.08%)#209 |
| 8. | Riverhead | 1,306 | 94,808(1.38%)#8 | 1,669,094(0.08%)#212 |
| 9. | Inwood | 1,222 | 94,808(1.29%)#9 | 1,669,094(0.07%)#223 |
| 10. | Brentwood | 1,205 | 94,808(1.27%)#10 | 1,669,094(0.07%)#226 |
| 11. | Flanders | 1,199 | 94,808(1.26%)#11 | 1,669,094(0.07%)#229 |
| 12. | Huntington Station | 1,189 | 94,808(1.25%)#12 | 1,669,094(0.07%)#230 |
| 13. | Freeport | 1,142 | 94,808(1.20%)#13 | 1,669,094(0.07%)#241 |
| 14. | White Plains | 893 | 94,808(0.94%)#14 | 1,669,094(0.05%)#305 |
| 15. | Hillcrest | 817 | 94,808(0.86%)#15 | 1,669,094(0.05%)#329 |
| 16. | Brewster | 817 | 94,808(0.86%)#16 | 1,669,094(0.05%)#330 |
| 17. | Peekskill | 740 | 94,808(0.78%)#17 | 1,669,094(0.04%)#359 |
| 18. | Central Islip | 731 | 94,808(0.77%)#18 | 1,669,094(0.04%)#362 |
| 19. | Mamaroneck | 705 | 94,808(0.74%)#19 | 1,669,094(0.04%)#373 |
| 20. | Uniondale | 557 | 94,808(0.59%)#20 | 1,669,094(0.03%)#456 |
| 21. | Great Neck | 435 | 94,808(0.46%)#21 | 1,669,094(0.03%)#547 |
| 22. | Hampton Bays | 420 | 94,808(0.44%)#22 | 1,669,094(0.03%)#566 |
| 23. | Newburgh | 418 | 94,808(0.44%)#23 | 1,669,094(0.03%)#572 |
| 24. | Greenlawn | 417 | 94,808(0.44%)#24 | 1,669,094(0.02%)#577 |
| 25. | Monticello | 362 | 94,808(0.38%)#25 | 1,669,094(0.02%)#658 |
| 26. | Greenport | 348 | 94,808(0.37%)#26 | 1,669,094(0.02%)#683 |
| 27. | Ossining | 330 | 94,808(0.35%)#27 | 1,669,094(0.02%)#718 |
| 28. | Dobbs Ferry | 328 | 94,808(0.35%)#28 | 1,669,094(0.02%)#723 |
| 29. | Shinnecock Hills | 314 | 94,808(0.33%)#29 | 1,669,094(0.02%)#753 |
| 30. | Roosevelt | 292 | 94,808(0.31%)#30 | 1,669,094(0.02%)#787 |
| 31. | Buffalo | 288 | 94,808(0.30%)#31 | 1,669,094(0.02%)#796 |
| 32. | Lake Carmel | 285 | 94,808(0.30%)#32 | 1,669,094(0.02%)#809 |
| 33. | Fredonia | 284 | 94,808(0.30%)#33 | 1,669,094(0.02%)#813 |
| 34. | West Haverstraw | 273 | 94,808(0.29%)#34 | 1,669,094(0.02%)#842 |
| 35. | Shirley | 270 | 94,808(0.28%)#35 | 1,669,094(0.02%)#849 |
| 36. | North Bay Shore | 268 | 94,808(0.28%)#36 | 1,669,094(0.02%)#857 |
| 37. | Poughkeepsie | 258 | 94,808(0.27%)#37 | 1,669,094(0.02%)#885 |
| 38. | Valley Stream | 256 | 94,808(0.27%)#38 | 1,669,094(0.02%)#897 |
| 39. | Southold | 251 | 94,808(0.26%)#39 | 1,669,094(0.02%)#905 |
| 40. | Harrison | 248 | 94,808(0.26%)#40 | 1,669,094(0.01%)#910 |
| 41. | Congers | 243 | 94,808(0.26%)#41 | 1,669,094(0.01%)#920 |
| 42. | Brewster Hill | 239 | 94,808(0.25%)#42 | 1,669,094(0.01%)#926 |
| 43. | Glen Cove | 216 | 94,808(0.23%)#43 | 1,669,094(0.01%)#995 |
| 44. | Islip | 215 | 94,808(0.23%)#44 | 1,669,094(0.01%)#999 |
| 45. | Middletown | 213 | 94,808(0.22%)#45 | 1,669,094(0.01%)#1,004 |
| 46. | Mount Ivy | 209 | 94,808(0.22%)#46 | 1,669,094(0.01%)#1,021 |
| 47. | Baldwin | 203 | 94,808(0.21%)#47 | 1,669,094(0.01%)#1,037 |
| 48. | Pearl River | 195 | 94,808(0.21%)#48 | 1,669,094(0.01%)#1,069 |
| 49. | Mastic Beach | 192 | 94,808(0.20%)#49 | 1,669,094(0.01%)#1,077 |
| 50. | Pawling | 189 | 94,808(0.20%)#50 | 1,669,094(0.01%)#1,088 |
| 51. | Nyack | 185 | 94,808(0.20%)#51 | 1,669,094(0.01%)#1,105 |
| 52. | West Hempstead | 182 | 94,808(0.19%)#52 | 1,669,094(0.01%)#1,124 |
| 53. | Franklin Square | 180 | 94,808(0.19%)#53 | 1,669,094(0.01%)#1,134 |
| 54. | Rock Hill | 180 | 94,808(0.19%)#54 | 1,669,094(0.01%)#1,138 |
| 55. | Deer Park | 178 | 94,808(0.19%)#55 | 1,669,094(0.01%)#1,140 |
| 56. | Laurel | 173 | 94,808(0.18%)#56 | 1,669,094(0.01%)#1,163 |
| 57. | Kingston | 172 | 94,808(0.18%)#57 | 1,669,094(0.01%)#1,165 |
| 58. | Millerton | 172 | 94,808(0.18%)#58 | 1,669,094(0.01%)#1,167 |
| 59. | Elmont | 166 | 94,808(0.18%)#59 | 1,669,094(0.01%)#1,192 |
| 60. | Manorhaven | 166 | 94,808(0.18%)#60 | 1,669,094(0.01%)#1,196 |
| 61. | Armonk | 166 | 94,808(0.18%)#61 | 1,669,094(0.01%)#1,197 |
| 62. | Mastic | 160 | 94,808(0.17%)#62 | 1,669,094(0.01%)#1,227 |
| 63. | East Meadow | 158 | 94,808(0.17%)#63 | 1,669,094(0.01%)#1,233 |
| 64. | Brighton | 158 | 94,808(0.17%)#64 | 1,669,094(0.01%)#1,234 |
| 65. | Ronkonkoma | 149 | 94,808(0.16%)#65 | 1,669,094(0.01%)#1,295 |
| 66. | Putnam Lake | 148 | 94,808(0.16%)#66 | 1,669,094(0.01%)#1,308 |
| 67. | Mahopac | 146 | 94,808(0.15%)#67 | 1,669,094(0.01%)#1,317 |
| 68. | Tonawanda | 144 | 94,808(0.15%)#68 | 1,669,094(0.01%)#1,322 |
| 69. | Centereach | 141 | 94,808(0.15%)#69 | 1,669,094(0.01%)#1,347 |
| 70. | Shenorock | 140 | 94,808(0.15%)#70 | 1,669,094(0.01%)#1,358 |
| 71. | Amenia | 140 | 94,808(0.15%)#71 | 1,669,094(0.01%)#1,359 |
| 72. | East Massapequa | 138 | 94,808(0.15%)#72 | 1,669,094(0.01%)#1,370 |
| 73. | East Shoreham | 136 | 94,808(0.14%)#73 | 1,669,094(0.01%)#1,380 |
| 74. | Brewster Heights | 135 | 94,808(0.14%)#74 | 1,669,094(0.01%)#1,385 |
| 75. | Great Neck Plaza | 133 | 94,808(0.14%)#75 | 1,669,094(0.01%)#1,403 |
| 76. | Albany | 128 | 94,808(0.14%)#76 | 1,669,094(0.01%)#1,430 |
| 77. | Rye Brook | 120 | 94,808(0.13%)#77 | 1,669,094(0.01%)#1,470 |
| 78. | Ithaca | 117 | 94,808(0.12%)#78 | 1,669,094(0.01%)#1,486 |
| 79. | South Valley Stream | 116 | 94,808(0.12%)#79 | 1,669,094(0.01%)#1,498 |
| 80. | Coram | 115 | 94,808(0.12%)#80 | 1,669,094(0.01%)#1,505 |
| 81. | Center Moriches | 114 | 94,808(0.12%)#81 | 1,669,094(0.01%)#1,517 |
| 82. | Calverton | 113 | 94,808(0.12%)#82 | 1,669,094(0.01%)#1,523 |
| 83. | Elmsford | 112 | 94,808(0.12%)#83 | 1,669,094(0.01%)#1,535 |
| 84. | East Patchogue | 109 | 94,808(0.11%)#84 | 1,669,094(0.01%)#1,560 |
| 85. | West Winfield | 106 | 94,808(0.11%)#85 | 1,669,094(0.01%)#1,590 |
| 86. | North Babylon | 104 | 94,808(0.11%)#86 | 1,669,094(0.01%)#1,600 |
| 87. | Wading River | 104 | 94,808(0.11%)#87 | 1,669,094(0.01%)#1,604 |
| 88. | Schenectady | 101 | 94,808(0.11%)#88 | 1,669,094(0.01%)#1,633 |
| 89. | Nanuet | 101 | 94,808(0.11%)#89 | 1,669,094(0.01%)#1,636 |
| 90. | Bellerose Terrace | 101 | 94,808(0.11%)#90 | 1,669,094(0.01%)#1,644 |
| 91. | Fulton | 96 | 94,808(0.10%)#91 | 1,669,094(0.01%)#1,712 |
| 92. | Liberty | 95 | 94,808(0.10%)#92 | 1,669,094(0.01%)#1,722 |
| 93. | New Hempstead | 93 | 94,808(0.10%)#93 | 1,669,094(0.01%)#1,744 |
| 94. | Mount Vernon | 91 | 94,808(0.10%)#94 | 1,669,094(0.01%)#1,764 |
| 95. | North Lindenhurst | 91 | 94,808(0.10%)#95 | 1,669,094(0.01%)#1,775 |
| 96. | Myers Corner | 90 | 94,808(0.09%)#96 | 1,669,094(0.01%)#1,783 |
| 97. | Lynbrook | 89 | 94,808(0.09%)#97 | 1,669,094(0.01%)#1,794 |
| 98. | Baywood | 89 | 94,808(0.09%)#98 | 1,669,094(0.01%)#1,795 |
| 99. | North Bellport | 88 | 94,808(0.09%)#99 | 1,669,094(0.01%)#1,807 |
| 100. | Lake Ronkonkoma | 86 | 94,808(0.09%)#100 | 1,669,094(0.01%)#1,828 |
Common Questions
What are the Top 10 Cities with the Largest Guatemalan Community in New York?
Top 10 Cities with the Largest Guatemalan Community in New York are:
#1
43,920
#2
3,159
#3
2,101
#4
2,079
#5
1,971
#6
1,685
#7
1,324
#8
1,306
#9
1,222
#10
1,205
What city has the Largest Guatemalan Community in New York?
New York has the Largest Guatemalan Community in New York with 43,920.
What is the Total Guatemalan Population in the State of New York?
Total Guatemalan Population in New York is 94,808.
What is the Total Guatemalan Population in the United States?
Total Guatemalan Population in the United States is 1,669,094.