Cities with the Largest Guatemalan Community in Ohio
RELATED REPORTS & OPTIONS
Guatemalan
Ohio
Compare Cities
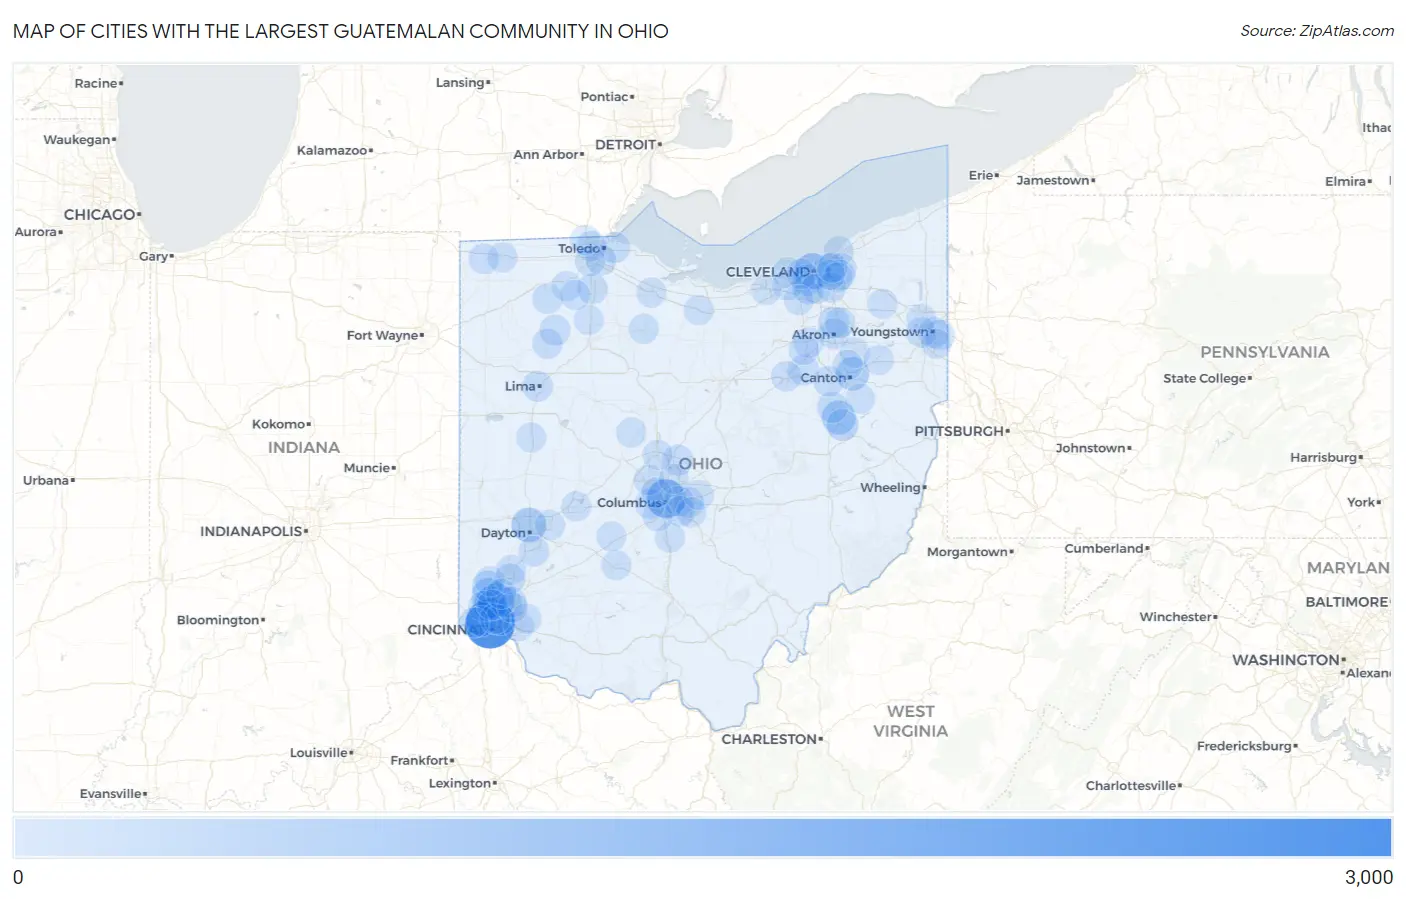
Map of Cities with the Largest Guatemalan Community in Ohio
0
3,000
Cities with the Largest Guatemalan Community in Ohio
| City | Guatemalan | vs State | vs National | |
| 1. | Cincinnati | 2,862 | 15,265(18.75%)#1 | 1,669,094(0.17%)#75 |
| 2. | Columbus | 1,263 | 15,265(8.27%)#2 | 1,669,094(0.08%)#214 |
| 3. | Cleveland | 902 | 15,265(5.91%)#3 | 1,669,094(0.05%)#302 |
| 4. | Springdale | 834 | 15,265(5.46%)#4 | 1,669,094(0.05%)#321 |
| 5. | Dayton | 663 | 15,265(4.34%)#5 | 1,669,094(0.04%)#386 |
| 6. | Fairfield | 554 | 15,265(3.63%)#6 | 1,669,094(0.03%)#457 |
| 7. | Dover | 553 | 15,265(3.62%)#7 | 1,669,094(0.03%)#459 |
| 8. | Canton | 466 | 15,265(3.05%)#8 | 1,669,094(0.03%)#522 |
| 9. | New Burlington | 330 | 15,265(2.16%)#9 | 1,669,094(0.02%)#719 |
| 10. | Forest Park | 325 | 15,265(2.13%)#10 | 1,669,094(0.02%)#727 |
| 11. | New Philadelphia | 269 | 15,265(1.76%)#11 | 1,669,094(0.02%)#853 |
| 12. | Brooklyn | 202 | 15,265(1.32%)#12 | 1,669,094(0.01%)#1,043 |
| 13. | Parma | 163 | 15,265(1.07%)#13 | 1,669,094(0.01%)#1,209 |
| 14. | Cuyahoga Falls | 149 | 15,265(0.98%)#14 | 1,669,094(0.01%)#1,292 |
| 15. | Hamilton | 137 | 15,265(0.90%)#15 | 1,669,094(0.01%)#1,374 |
| 16. | Strasburg | 128 | 15,265(0.84%)#16 | 1,669,094(0.01%)#1,434 |
| 17. | Northgate | 124 | 15,265(0.81%)#17 | 1,669,094(0.01%)#1,446 |
| 18. | Brecon | 122 | 15,265(0.80%)#18 | 1,669,094(0.01%)#1,459 |
| 19. | Akron | 116 | 15,265(0.76%)#19 | 1,669,094(0.01%)#1,489 |
| 20. | Youngstown | 116 | 15,265(0.76%)#20 | 1,669,094(0.01%)#1,491 |
| 21. | Sharonville | 114 | 15,265(0.75%)#21 | 1,669,094(0.01%)#1,516 |
| 22. | Oregon | 113 | 15,265(0.74%)#22 | 1,669,094(0.01%)#1,520 |
| 23. | Leipsic | 113 | 15,265(0.74%)#23 | 1,669,094(0.01%)#1,526 |
| 24. | Sunbury | 111 | 15,265(0.73%)#24 | 1,669,094(0.01%)#1,546 |
| 25. | Lima | 99 | 15,265(0.65%)#25 | 1,669,094(0.01%)#1,662 |
| 26. | Orrville | 99 | 15,265(0.65%)#26 | 1,669,094(0.01%)#1,667 |
| 27. | Bowling Green | 95 | 15,265(0.62%)#27 | 1,669,094(0.01%)#1,718 |
| 28. | Massillon | 88 | 15,265(0.58%)#28 | 1,669,094(0.01%)#1,800 |
| 29. | Centerville | 87 | 15,265(0.57%)#29 | 1,669,094(0.01%)#1,818 |
| 30. | Mayfield Heights | 83 | 15,265(0.54%)#30 | 1,669,094(0.00%)#1,853 |
| 31. | Monroe | 79 | 15,265(0.52%)#31 | 1,669,094(0.00%)#1,906 |
| 32. | Cleveland Heights | 76 | 15,265(0.50%)#32 | 1,669,094(0.00%)#1,941 |
| 33. | Montpelier | 71 | 15,265(0.47%)#33 | 1,669,094(0.00%)#2,012 |
| 34. | Bay Village | 61 | 15,265(0.40%)#34 | 1,669,094(0.00%)#2,176 |
| 35. | Rossford | 61 | 15,265(0.40%)#35 | 1,669,094(0.00%)#2,183 |
| 36. | Reynoldsburg | 59 | 15,265(0.39%)#36 | 1,669,094(0.00%)#2,208 |
| 37. | Wooster | 52 | 15,265(0.34%)#37 | 1,669,094(0.00%)#2,358 |
| 38. | Lincoln Village | 52 | 15,265(0.34%)#38 | 1,669,094(0.00%)#2,367 |
| 39. | Cheviot | 50 | 15,265(0.33%)#39 | 1,669,094(0.00%)#2,410 |
| 40. | Whitehall | 48 | 15,265(0.31%)#40 | 1,669,094(0.00%)#2,442 |
| 41. | Ottawa | 47 | 15,265(0.31%)#41 | 1,669,094(0.00%)#2,462 |
| 42. | Blacklick Estates | 43 | 15,265(0.28%)#42 | 1,669,094(0.00%)#2,563 |
| 43. | Campbell | 43 | 15,265(0.28%)#43 | 1,669,094(0.00%)#2,565 |
| 44. | Malinta | 43 | 15,265(0.28%)#44 | 1,669,094(0.00%)#2,574 |
| 45. | Austintown | 41 | 15,265(0.27%)#45 | 1,669,094(0.00%)#2,596 |
| 46. | Dublin | 40 | 15,265(0.26%)#46 | 1,669,094(0.00%)#2,620 |
| 47. | Upper Arlington | 39 | 15,265(0.26%)#47 | 1,669,094(0.00%)#2,648 |
| 48. | Willowick | 39 | 15,265(0.26%)#48 | 1,669,094(0.00%)#2,656 |
| 49. | Norwood | 38 | 15,265(0.25%)#49 | 1,669,094(0.00%)#2,685 |
| 50. | Silver Lake | 38 | 15,265(0.25%)#50 | 1,669,094(0.00%)#2,705 |
| 51. | North Olmsted | 37 | 15,265(0.24%)#51 | 1,669,094(0.00%)#2,716 |
| 52. | Wadsworth | 37 | 15,265(0.24%)#52 | 1,669,094(0.00%)#2,719 |
| 53. | Lakewood | 35 | 15,265(0.23%)#53 | 1,669,094(0.00%)#2,781 |
| 54. | Pepper Pike | 35 | 15,265(0.23%)#54 | 1,669,094(0.00%)#2,796 |
| 55. | Tiffin | 32 | 15,265(0.21%)#55 | 1,669,094(0.00%)#2,894 |
| 56. | Ottawa Hills | 32 | 15,265(0.21%)#56 | 1,669,094(0.00%)#2,913 |
| 57. | Greenhills | 32 | 15,265(0.21%)#57 | 1,669,094(0.00%)#2,916 |
| 58. | Summerside | 26 | 15,265(0.17%)#58 | 1,669,094(0.00%)#3,123 |
| 59. | Washington Court House | 25 | 15,265(0.16%)#59 | 1,669,094(0.00%)#3,146 |
| 60. | Seven Hills | 25 | 15,265(0.16%)#60 | 1,669,094(0.00%)#3,148 |
| 61. | St Bernard | 25 | 15,265(0.16%)#61 | 1,669,094(0.00%)#3,165 |
| 62. | Hartville | 24 | 15,265(0.16%)#62 | 1,669,094(0.00%)#3,211 |
| 63. | Day Heights | 24 | 15,265(0.16%)#63 | 1,669,094(0.00%)#3,219 |
| 64. | Middletown | 23 | 15,265(0.15%)#64 | 1,669,094(0.00%)#3,234 |
| 65. | Pickerington | 23 | 15,265(0.15%)#65 | 1,669,094(0.00%)#3,240 |
| 66. | Maumee | 23 | 15,265(0.15%)#66 | 1,669,094(0.00%)#3,251 |
| 67. | Bedford | 23 | 15,265(0.15%)#67 | 1,669,094(0.00%)#3,252 |
| 68. | Springfield | 22 | 15,265(0.14%)#68 | 1,669,094(0.00%)#3,281 |
| 69. | New Miami | 22 | 15,265(0.14%)#69 | 1,669,094(0.00%)#3,324 |
| 70. | Woodmere | 20 | 15,265(0.13%)#70 | 1,669,094(0.00%)#3,435 |
| 71. | Poland | 18 | 15,265(0.12%)#71 | 1,669,094(0.00%)#3,538 |
| 72. | Midway | 18 | 15,265(0.12%)#72 | 1,669,094(0.00%)#3,558 |
| 73. | West Unity | 15 | 15,265(0.10%)#73 | 1,669,094(0.00%)#3,737 |
| 74. | Elyria | 14 | 15,265(0.09%)#74 | 1,669,094(0.00%)#3,755 |
| 75. | Westerville | 14 | 15,265(0.09%)#75 | 1,669,094(0.00%)#3,761 |
| 76. | Alliance | 14 | 15,265(0.09%)#76 | 1,669,094(0.00%)#3,767 |
| 77. | Montgomery | 14 | 15,265(0.09%)#77 | 1,669,094(0.00%)#3,788 |
| 78. | Pataskala | 13 | 15,265(0.09%)#78 | 1,669,094(0.00%)#3,844 |
| 79. | Richwood | 13 | 15,265(0.09%)#79 | 1,669,094(0.00%)#3,876 |
| 80. | Monroeville | 13 | 15,265(0.09%)#80 | 1,669,094(0.00%)#3,883 |
| 81. | Grand Rapids | 13 | 15,265(0.09%)#81 | 1,669,094(0.00%)#3,886 |
| 82. | Sylvania | 12 | 15,265(0.08%)#82 | 1,669,094(0.00%)#3,912 |
| 83. | North Canton | 12 | 15,265(0.08%)#83 | 1,669,094(0.00%)#3,915 |
| 84. | Garrettsville | 12 | 15,265(0.08%)#84 | 1,669,094(0.00%)#3,951 |
| 85. | Mack | 11 | 15,265(0.07%)#85 | 1,669,094(0.00%)#4,001 |
| 86. | Beckett Ridge | 11 | 15,265(0.07%)#86 | 1,669,094(0.00%)#4,007 |
| 87. | Rittman | 11 | 15,265(0.07%)#87 | 1,669,094(0.00%)#4,014 |
| 88. | Shaker Heights | 10 | 15,265(0.07%)#88 | 1,669,094(0.00%)#4,064 |
| 89. | North Baltimore | 10 | 15,265(0.07%)#89 | 1,669,094(0.00%)#4,108 |
| 90. | Magnolia | 10 | 15,265(0.07%)#90 | 1,669,094(0.00%)#4,137 |
| 91. | Strongsville | 9 | 15,265(0.06%)#91 | 1,669,094(0.00%)#4,160 |
| 92. | Fairborn | 9 | 15,265(0.06%)#92 | 1,669,094(0.00%)#4,168 |
| 93. | South Euclid | 9 | 15,265(0.06%)#93 | 1,669,094(0.00%)#4,175 |
| 94. | Fremont | 9 | 15,265(0.06%)#94 | 1,669,094(0.00%)#4,184 |
| 95. | Ashville | 9 | 15,265(0.06%)#95 | 1,669,094(0.00%)#4,209 |
| 96. | Anna | 9 | 15,265(0.06%)#96 | 1,669,094(0.00%)#4,236 |
| 97. | Weston | 9 | 15,265(0.06%)#97 | 1,669,094(0.00%)#4,240 |
| 98. | Delaware | 8 | 15,265(0.05%)#98 | 1,669,094(0.00%)#4,261 |
| 99. | Grove City | 8 | 15,265(0.05%)#99 | 1,669,094(0.00%)#4,262 |
| 100. | Niles | 7 | 15,265(0.05%)#100 | 1,669,094(0.00%)#4,374 |
Common Questions
What are the Top 10 Cities with the Largest Guatemalan Community in Ohio?
Top 10 Cities with the Largest Guatemalan Community in Ohio are:
#1
2,862
#2
1,263
#3
902
#4
834
#5
663
#6
554
#7
553
#8
466
#9
330
#10
325
What city has the Largest Guatemalan Community in Ohio?
Cincinnati has the Largest Guatemalan Community in Ohio with 2,862.
What is the Total Guatemalan Population in the State of Ohio?
Total Guatemalan Population in Ohio is 15,265.
What is the Total Guatemalan Population in the United States?
Total Guatemalan Population in the United States is 1,669,094.