Cities with the Largest Guatemalan Community in the United States
RELATED REPORTS & OPTIONS
Guatemalan
United States
Compare Cities
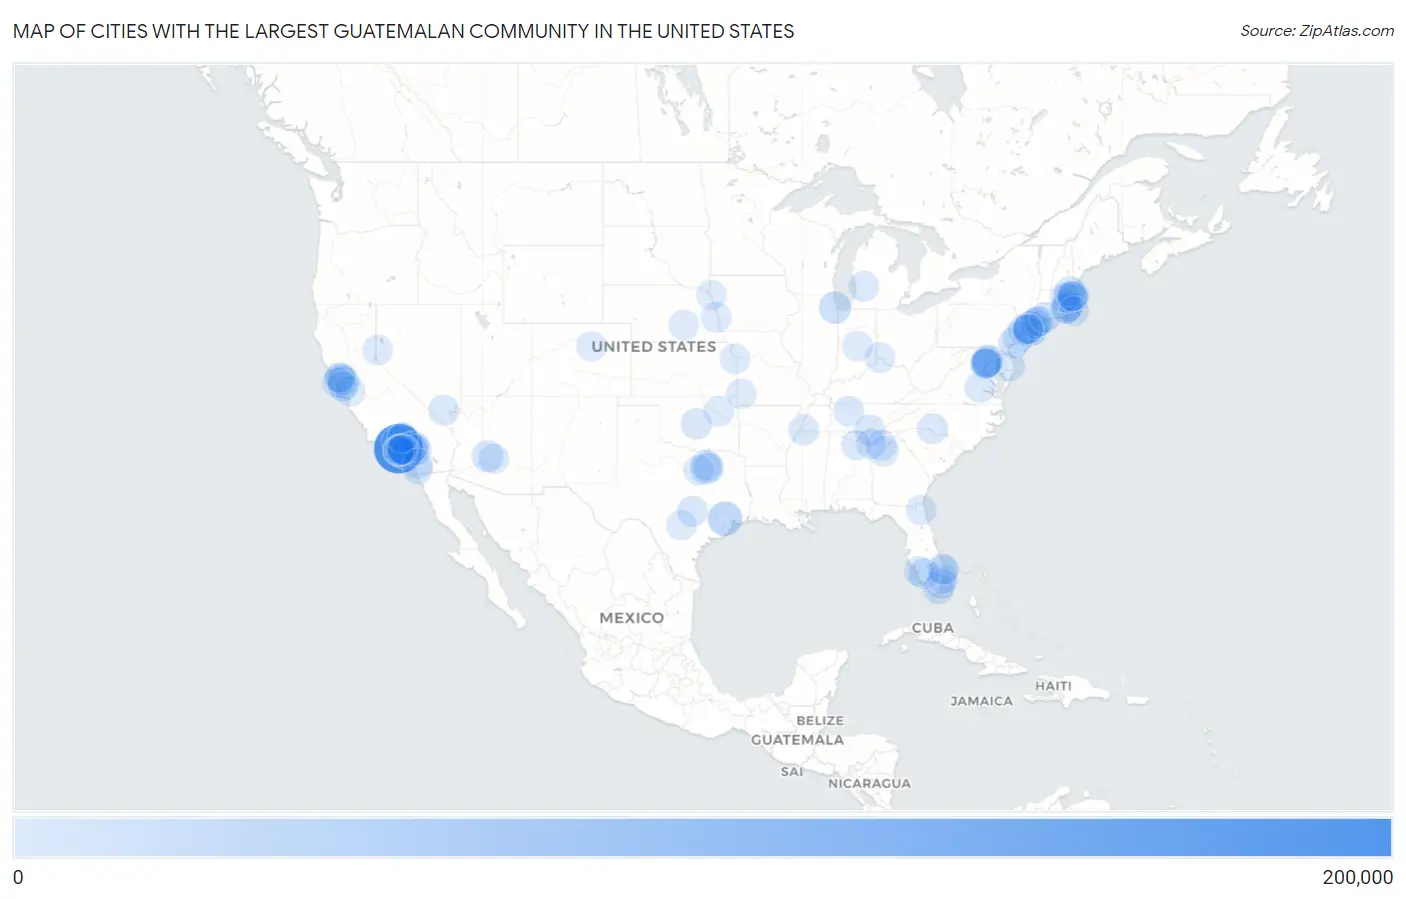
Map of Cities with the Largest Guatemalan Community in the United States
0
200,000
Cities with the Largest Guatemalan Community in the United States
| City | Guatemalan | vs State | vs National | |
| 1. | Los Angeles | 177,815 | 468,407(37.96%)#1 | 1,669,094(10.65%)#1 |
| 2. | New York | 43,920 | 94,808(46.33%)#1 | 1,669,094(2.63%)#2 |
| 3. | Houston | 38,631 | 125,510(30.78%)#1 | 1,669,094(2.31%)#3 |
| 4. | Chicago | 18,579 | 43,359(42.85%)#1 | 1,669,094(1.11%)#4 |
| 5. | Providence | 13,733 | 27,884(49.25%)#1 | 1,669,094(0.82%)#5 |
| 6. | Oakland | 13,260 | 468,407(2.83%)#2 | 1,669,094(0.79%)#6 |
| 7. | Phoenix | 12,447 | 24,113(51.62%)#1 | 1,669,094(0.75%)#7 |
| 8. | Stamford | 10,123 | 26,702(37.91%)#1 | 1,669,094(0.61%)#8 |
| 9. | Langley Park | 9,396 | 64,033(14.67%)#1 | 1,669,094(0.56%)#9 |
| 10. | Trenton | 9,324 | 72,199(12.91%)#1 | 1,669,094(0.56%)#10 |
| 11. | Dallas | 9,145 | 125,510(7.29%)#2 | 1,669,094(0.55%)#11 |
| 12. | Oklahoma City | 9,127 | 18,100(50.43%)#1 | 1,669,094(0.55%)#12 |
| 13. | Lynn | 8,988 | 51,425(17.48%)#1 | 1,669,094(0.54%)#13 |
| 14. | Lake Worth Beach | 8,320 | 148,879(5.59%)#1 | 1,669,094(0.50%)#14 |
| 15. | Homestead | 8,299 | 148,879(5.57%)#2 | 1,669,094(0.50%)#15 |
| 16. | Plainfield | 6,810 | 72,199(9.43%)#2 | 1,669,094(0.41%)#16 |
| 17. | Austin | 6,750 | 125,510(5.38%)#3 | 1,669,094(0.40%)#17 |
| 18. | Long Beach | 6,607 | 468,407(1.41%)#3 | 1,669,094(0.40%)#18 |
| 19. | Charlotte | 6,529 | 38,038(17.16%)#1 | 1,669,094(0.39%)#19 |
| 20. | San Rafael | 6,042 | 468,407(1.29%)#4 | 1,669,094(0.36%)#20 |
| 21. | West Palm Beach | 5,999 | 148,879(4.03%)#3 | 1,669,094(0.36%)#21 |
| 22. | San Francisco | 5,978 | 468,407(1.28%)#5 | 1,669,094(0.36%)#22 |
| 23. | Riverside | 5,891 | 468,407(1.26%)#6 | 1,669,094(0.35%)#23 |
| 24. | Miami | 5,746 | 148,879(3.86%)#4 | 1,669,094(0.34%)#24 |
| 25. | Las Vegas | 5,356 | 22,632(23.67%)#1 | 1,669,094(0.32%)#25 |
| 26. | Nashville | 5,319 | 31,896(16.68%)#1 | 1,669,094(0.32%)#26 |
| 27. | Santa Clarita | 5,171 | 468,407(1.10%)#7 | 1,669,094(0.31%)#27 |
| 28. | Philadelphia | 5,042 | 20,886(24.14%)#1 | 1,669,094(0.30%)#28 |
| 29. | Silver Spring | 5,038 | 64,033(7.87%)#2 | 1,669,094(0.30%)#29 |
| 30. | Palmdale | 4,927 | 468,407(1.05%)#8 | 1,669,094(0.30%)#30 |
| 31. | Boston | 4,870 | 51,425(9.47%)#2 | 1,669,094(0.29%)#31 |
| 32. | Richmond | 4,805 | 57,984(8.29%)#1 | 1,669,094(0.29%)#32 |
| 33. | Chattanooga | 4,720 | 31,896(14.80%)#2 | 1,669,094(0.28%)#33 |
| 34. | Memphis | 4,712 | 31,896(14.77%)#3 | 1,669,094(0.28%)#34 |
| 35. | Inglewood | 4,556 | 468,407(0.97%)#9 | 1,669,094(0.27%)#35 |
| 36. | Immokalee | 4,480 | 148,879(3.01%)#5 | 1,669,094(0.27%)#36 |
| 37. | San Diego | 4,458 | 468,407(0.95%)#10 | 1,669,094(0.27%)#37 |
| 38. | Anaheim | 4,374 | 468,407(0.93%)#11 | 1,669,094(0.26%)#38 |
| 39. | Central Falls | 4,366 | 27,884(15.66%)#2 | 1,669,094(0.26%)#39 |
| 40. | San Bernardino | 4,285 | 468,407(0.91%)#12 | 1,669,094(0.26%)#40 |
| 41. | Grand Rapids | 4,254 | 12,949(32.85%)#1 | 1,669,094(0.25%)#41 |
| 42. | Newark | 4,184 | 72,199(5.80%)#3 | 1,669,094(0.25%)#42 |
| 43. | Fontana | 4,069 | 468,407(0.87%)#13 | 1,669,094(0.24%)#43 |
| 44. | Hawthorne | 4,053 | 468,407(0.87%)#14 | 1,669,094(0.24%)#44 |
| 45. | Santa Ana | 3,988 | 468,407(0.85%)#15 | 1,669,094(0.24%)#45 |
| 46. | Waltham | 3,839 | 51,425(7.47%)#3 | 1,669,094(0.23%)#46 |
| 47. | Cranston | 3,765 | 27,884(13.50%)#3 | 1,669,094(0.23%)#47 |
| 48. | San Jose | 3,759 | 468,407(0.80%)#16 | 1,669,094(0.23%)#48 |
| 49. | Omaha | 3,733 | 17,215(21.68%)#1 | 1,669,094(0.22%)#49 |
| 50. | Plano | 3,712 | 125,510(2.96%)#4 | 1,669,094(0.22%)#50 |
| 51. | Lawrence | 3,711 | 51,425(7.22%)#4 | 1,669,094(0.22%)#51 |
| 52. | Canton | 3,636 | 65,283(5.57%)#1 | 1,669,094(0.22%)#52 |
| 53. | Downey | 3,614 | 468,407(0.77%)#17 | 1,669,094(0.22%)#53 |
| 54. | Grand Island | 3,596 | 17,215(20.89%)#2 | 1,669,094(0.22%)#54 |
| 55. | Chamblee | 3,564 | 65,283(5.46%)#2 | 1,669,094(0.21%)#55 |
| 56. | Richmond | 3,560 | 468,407(0.76%)#18 | 1,669,094(0.21%)#56 |
| 57. | Bailey S Crossroads | 3,430 | 57,984(5.92%)#2 | 1,669,094(0.21%)#57 |
| 58. | Tulsa | 3,427 | 18,100(18.93%)#2 | 1,669,094(0.21%)#58 |
| 59. | Indianapolis | 3,404 | 13,194(25.80%)#1 | 1,669,094(0.20%)#59 |
| 60. | Washington | 3,397 | 3,397(100.00%)#1 | 1,669,094(0.20%)#60 |
| 61. | Fort Myers | 3,341 | 148,879(2.24%)#6 | 1,669,094(0.20%)#61 |
| 62. | Chelsea | 3,267 | 51,425(6.35%)#5 | 1,669,094(0.20%)#62 |
| 63. | Arlington | 3,265 | 57,984(5.63%)#3 | 1,669,094(0.20%)#63 |
| 64. | San Mateo | 3,234 | 468,407(0.69%)#19 | 1,669,094(0.19%)#64 |
| 65. | Jacksonville | 3,232 | 148,879(2.17%)#7 | 1,669,094(0.19%)#65 |
| 66. | Port Chester | 3,159 | 94,808(3.33%)#2 | 1,669,094(0.19%)#66 |
| 67. | Moreno Valley | 3,140 | 468,407(0.67%)#20 | 1,669,094(0.19%)#67 |
| 68. | Pomona | 3,119 | 468,407(0.67%)#21 | 1,669,094(0.19%)#68 |
| 69. | San Antonio | 3,113 | 125,510(2.48%)#5 | 1,669,094(0.19%)#69 |
| 70. | Marlborough | 3,108 | 51,425(6.04%)#6 | 1,669,094(0.19%)#70 |
| 71. | Carthage | 3,036 | 11,745(25.85%)#1 | 1,669,094(0.18%)#71 |
| 72. | Fort Lauderdale | 3,017 | 148,879(2.03%)#8 | 1,669,094(0.18%)#72 |
| 73. | Westmont | 2,998 | 468,407(0.64%)#22 | 1,669,094(0.18%)#73 |
| 74. | Rome | 2,920 | 65,283(4.47%)#3 | 1,669,094(0.17%)#74 |
| 75. | Cincinnati | 2,862 | 15,265(18.75%)#1 | 1,669,094(0.17%)#75 |
| 76. | Garland | 2,747 | 125,510(2.19%)#6 | 1,669,094(0.16%)#76 |
| 77. | Reno | 2,721 | 22,632(12.02%)#2 | 1,669,094(0.16%)#77 |
| 78. | South Gate | 2,718 | 468,407(0.58%)#23 | 1,669,094(0.16%)#78 |
| 79. | East Los Angeles | 2,647 | 468,407(0.57%)#24 | 1,669,094(0.16%)#79 |
| 80. | Sioux City | 2,642 | 10,561(25.02%)#1 | 1,669,094(0.16%)#80 |
| 81. | Norwalk | 2,613 | 468,407(0.56%)#25 | 1,669,094(0.16%)#81 |
| 82. | Lancaster | 2,598 | 468,407(0.55%)#26 | 1,669,094(0.16%)#82 |
| 83. | Escondido | 2,579 | 468,407(0.55%)#27 | 1,669,094(0.15%)#83 |
| 84. | Norwalk | 2,557 | 26,702(9.58%)#2 | 1,669,094(0.15%)#84 |
| 85. | Novato | 2,548 | 468,407(0.54%)#28 | 1,669,094(0.15%)#85 |
| 86. | Georgetown | 2,518 | 9,879(25.49%)#1 | 1,669,094(0.15%)#86 |
| 87. | New Bedford | 2,498 | 51,425(4.86%)#7 | 1,669,094(0.15%)#87 |
| 88. | Kansas City | 2,487 | 11,164(22.28%)#1 | 1,669,094(0.15%)#88 |
| 89. | Revere | 2,487 | 51,425(4.84%)#8 | 1,669,094(0.15%)#89 |
| 90. | Westgate | 2,454 | 148,879(1.65%)#9 | 1,669,094(0.15%)#90 |
| 91. | Alexandria | 2,427 | 57,984(4.19%)#4 | 1,669,094(0.15%)#91 |
| 92. | Albertville | 2,427 | 22,309(10.88%)#1 | 1,669,094(0.15%)#92 |
| 93. | Fort Worth | 2,398 | 125,510(1.91%)#7 | 1,669,094(0.14%)#93 |
| 94. | Elizabeth | 2,395 | 72,199(3.32%)#4 | 1,669,094(0.14%)#94 |
| 95. | Lawndale | 2,341 | 468,407(0.50%)#29 | 1,669,094(0.14%)#95 |
| 96. | Denver | 2,309 | 11,760(19.63%)#1 | 1,669,094(0.14%)#96 |
| 97. | New Haven | 2,308 | 26,702(8.64%)#3 | 1,669,094(0.14%)#97 |
| 98. | Mesa | 2,299 | 24,113(9.53%)#2 | 1,669,094(0.14%)#98 |
| 99. | Florence Graham | 2,298 | 468,407(0.49%)#30 | 1,669,094(0.14%)#99 |
| 100. | Jersey City | 2,296 | 72,199(3.18%)#5 | 1,669,094(0.14%)#100 |
Common Questions
What are the Top 10 Cities with the Largest Guatemalan Community in the United States?
Top 10 Cities with the Largest Guatemalan Community in the United States are:
What city has the Largest Guatemalan Community in the United States?
Los Angeles has the Largest Guatemalan Community in the United States with 177,815.
What is the Total Guatemalan Population in the United States?
Total Guatemalan Population in the United States is 1,669,094.