Cities with the Largest Guatemalan Community in Pennsylvania
RELATED REPORTS & OPTIONS
Guatemalan
Pennsylvania
Compare Cities
Map of Cities with the Largest Guatemalan Community in Pennsylvania
0
6,000
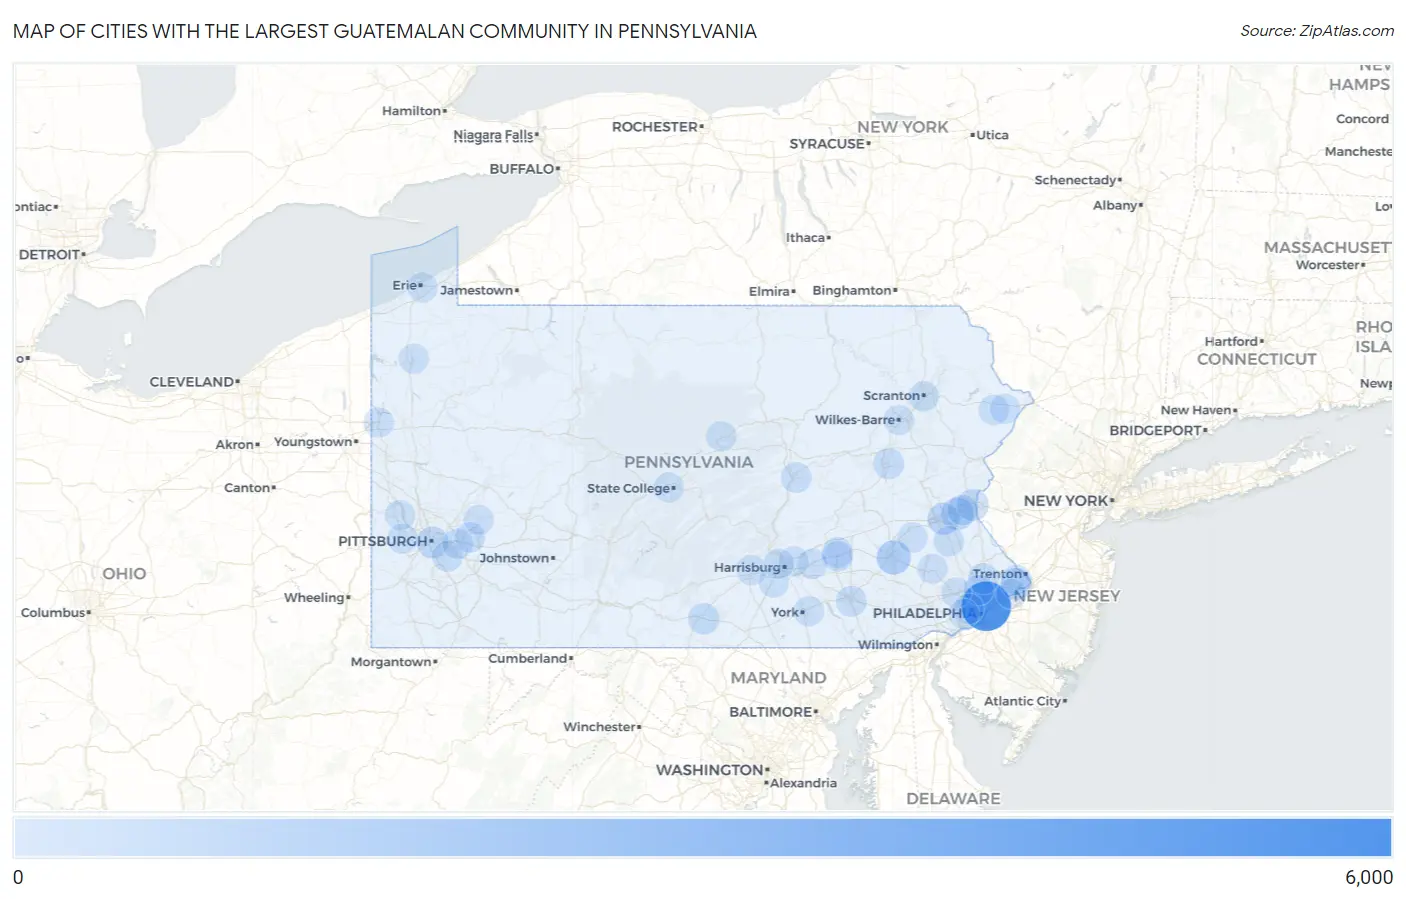
Cities with the Largest Guatemalan Community in Pennsylvania
| City | Guatemalan | vs State | vs National | |
| 1. | Philadelphia | 5,042 | 20,886(24.14%)#1 | 1,669,094(0.30%)#28 |
| 2. | Chambersburg Borough | 1,385 | 20,886(6.63%)#2 | 1,669,094(0.08%)#197 |
| 3. | Reading | 1,001 | 20,886(4.79%)#3 | 1,669,094(0.06%)#271 |
| 4. | Bethlehem | 570 | 20,886(2.73%)#4 | 1,669,094(0.03%)#449 |
| 5. | Allentown | 535 | 20,886(2.56%)#5 | 1,669,094(0.03%)#474 |
| 6. | Easton | 462 | 20,886(2.21%)#6 | 1,669,094(0.03%)#525 |
| 7. | Pittsburgh | 443 | 20,886(2.12%)#7 | 1,669,094(0.03%)#541 |
| 8. | Levittown | 369 | 20,886(1.77%)#8 | 1,669,094(0.02%)#646 |
| 9. | Guilford | 295 | 20,886(1.41%)#9 | 1,669,094(0.02%)#780 |
| 10. | Mount Joy Borough | 257 | 20,886(1.23%)#10 | 1,669,094(0.02%)#891 |
| 11. | Avondale Borough | 236 | 20,886(1.13%)#11 | 1,669,094(0.01%)#937 |
| 12. | Horsham | 230 | 20,886(1.10%)#12 | 1,669,094(0.01%)#956 |
| 13. | West Hazleton Borough | 221 | 20,886(1.06%)#13 | 1,669,094(0.01%)#981 |
| 14. | Lansdale Borough | 192 | 20,886(0.92%)#14 | 1,669,094(0.01%)#1,076 |
| 15. | Hazleton | 181 | 20,886(0.87%)#15 | 1,669,094(0.01%)#1,127 |
| 16. | Sand Hill | 177 | 20,886(0.85%)#16 | 1,669,094(0.01%)#1,148 |
| 17. | Mckeesport | 159 | 20,886(0.76%)#17 | 1,669,094(0.01%)#1,229 |
| 18. | Lancaster | 151 | 20,886(0.72%)#18 | 1,669,094(0.01%)#1,284 |
| 19. | West York Borough | 132 | 20,886(0.63%)#19 | 1,669,094(0.01%)#1,407 |
| 20. | Dormont Borough | 116 | 20,886(0.56%)#20 | 1,669,094(0.01%)#1,497 |
| 21. | Shenandoah Borough | 112 | 20,886(0.54%)#21 | 1,669,094(0.01%)#1,536 |
| 22. | Mifflinburg Borough | 108 | 20,886(0.52%)#22 | 1,669,094(0.01%)#1,568 |
| 23. | Quarryville Borough | 108 | 20,886(0.52%)#23 | 1,669,094(0.01%)#1,569 |
| 24. | Sunbury | 107 | 20,886(0.51%)#24 | 1,669,094(0.01%)#1,578 |
| 25. | Bangor Borough | 107 | 20,886(0.51%)#25 | 1,669,094(0.01%)#1,579 |
| 26. | Lebanon | 88 | 20,886(0.42%)#26 | 1,669,094(0.01%)#1,801 |
| 27. | Phoenixville Borough | 81 | 20,886(0.39%)#27 | 1,669,094(0.00%)#1,880 |
| 28. | Scranton | 79 | 20,886(0.38%)#28 | 1,669,094(0.00%)#1,901 |
| 29. | Middletown | 79 | 20,886(0.38%)#29 | 1,669,094(0.00%)#1,908 |
| 30. | Indiana Borough | 78 | 20,886(0.37%)#30 | 1,669,094(0.00%)#1,920 |
| 31. | Pottstown Borough | 77 | 20,886(0.37%)#31 | 1,669,094(0.00%)#1,932 |
| 32. | Carlisle Borough | 73 | 20,886(0.35%)#32 | 1,669,094(0.00%)#1,976 |
| 33. | Monroeville | 71 | 20,886(0.34%)#33 | 1,669,094(0.00%)#2,004 |
| 34. | Hemlock Farms | 66 | 20,886(0.32%)#34 | 1,669,094(0.00%)#2,107 |
| 35. | East Stroudsburg Borough | 63 | 20,886(0.30%)#35 | 1,669,094(0.00%)#2,155 |
| 36. | West View Borough | 59 | 20,886(0.28%)#36 | 1,669,094(0.00%)#2,218 |
| 37. | Spinnerstown | 57 | 20,886(0.27%)#37 | 1,669,094(0.00%)#2,267 |
| 38. | Telford Borough | 56 | 20,886(0.27%)#38 | 1,669,094(0.00%)#2,284 |
| 39. | Murrysville | 55 | 20,886(0.26%)#39 | 1,669,094(0.00%)#2,297 |
| 40. | Springdale Borough | 54 | 20,886(0.26%)#40 | 1,669,094(0.00%)#2,326 |
| 41. | West Chester Borough | 53 | 20,886(0.25%)#41 | 1,669,094(0.00%)#2,339 |
| 42. | Hershey | 53 | 20,886(0.25%)#42 | 1,669,094(0.00%)#2,343 |
| 43. | Schlusser | 51 | 20,886(0.24%)#43 | 1,669,094(0.00%)#2,393 |
| 44. | East York | 50 | 20,886(0.24%)#44 | 1,669,094(0.00%)#2,409 |
| 45. | Osceola Mills Borough | 47 | 20,886(0.23%)#45 | 1,669,094(0.00%)#2,466 |
| 46. | Hermitage | 45 | 20,886(0.22%)#46 | 1,669,094(0.00%)#2,505 |
| 47. | Meadville | 45 | 20,886(0.22%)#47 | 1,669,094(0.00%)#2,509 |
| 48. | Oreland | 45 | 20,886(0.22%)#48 | 1,669,094(0.00%)#2,514 |
| 49. | Columbia Borough | 44 | 20,886(0.21%)#49 | 1,669,094(0.00%)#2,532 |
| 50. | Morrisville Borough | 44 | 20,886(0.21%)#50 | 1,669,094(0.00%)#2,533 |
| 51. | Fairless Hills | 44 | 20,886(0.21%)#51 | 1,669,094(0.00%)#2,534 |
| 52. | Lititz Borough | 42 | 20,886(0.20%)#52 | 1,669,094(0.00%)#2,583 |
| 53. | Freeland Borough | 42 | 20,886(0.20%)#53 | 1,669,094(0.00%)#2,585 |
| 54. | Erie | 41 | 20,886(0.20%)#54 | 1,669,094(0.00%)#2,590 |
| 55. | Wilkes Barre | 40 | 20,886(0.19%)#55 | 1,669,094(0.00%)#2,623 |
| 56. | Wilson Borough | 39 | 20,886(0.19%)#56 | 1,669,094(0.00%)#2,662 |
| 57. | Park Forest Village | 37 | 20,886(0.18%)#57 | 1,669,094(0.00%)#2,726 |
| 58. | Ambler Borough | 37 | 20,886(0.18%)#58 | 1,669,094(0.00%)#2,728 |
| 59. | Aliquippa | 36 | 20,886(0.17%)#59 | 1,669,094(0.00%)#2,763 |
| 60. | King Of Prussia | 34 | 20,886(0.16%)#60 | 1,669,094(0.00%)#2,819 |
| 61. | Edinboro Borough | 34 | 20,886(0.16%)#61 | 1,669,094(0.00%)#2,837 |
| 62. | Chestnut Hill | 33 | 20,886(0.16%)#62 | 1,669,094(0.00%)#2,871 |
| 63. | Lock Haven | 32 | 20,886(0.15%)#63 | 1,669,094(0.00%)#2,907 |
| 64. | California Borough | 32 | 20,886(0.15%)#64 | 1,669,094(0.00%)#2,912 |
| 65. | Yardley Borough | 32 | 20,886(0.15%)#65 | 1,669,094(0.00%)#2,920 |
| 66. | Norristown Borough | 29 | 20,886(0.14%)#66 | 1,669,094(0.00%)#2,983 |
| 67. | Economy Borough | 29 | 20,886(0.14%)#67 | 1,669,094(0.00%)#3,003 |
| 68. | West Reading Borough | 28 | 20,886(0.13%)#68 | 1,669,094(0.00%)#3,044 |
| 69. | East Washington Borough | 27 | 20,886(0.13%)#69 | 1,669,094(0.00%)#3,087 |
| 70. | State College Borough | 26 | 20,886(0.12%)#70 | 1,669,094(0.00%)#3,098 |
| 71. | North Catasauqua Borough | 26 | 20,886(0.12%)#71 | 1,669,094(0.00%)#3,127 |
| 72. | Swissvale Borough | 24 | 20,886(0.11%)#72 | 1,669,094(0.00%)#3,196 |
| 73. | Huntingdon Borough | 24 | 20,886(0.11%)#73 | 1,669,094(0.00%)#3,200 |
| 74. | Blossburg Borough | 24 | 20,886(0.11%)#74 | 1,669,094(0.00%)#3,221 |
| 75. | Hellertown Borough | 23 | 20,886(0.11%)#75 | 1,669,094(0.00%)#3,264 |
| 76. | Croydon | 22 | 20,886(0.11%)#76 | 1,669,094(0.00%)#3,311 |
| 77. | Topton Borough | 22 | 20,886(0.11%)#77 | 1,669,094(0.00%)#3,325 |
| 78. | North Belle Vernon Borough | 21 | 20,886(0.10%)#78 | 1,669,094(0.00%)#3,380 |
| 79. | Souderton Borough | 20 | 20,886(0.10%)#79 | 1,669,094(0.00%)#3,409 |
| 80. | Oakmont Borough | 20 | 20,886(0.10%)#80 | 1,669,094(0.00%)#3,413 |
| 81. | Red Lion Borough | 20 | 20,886(0.10%)#81 | 1,669,094(0.00%)#3,415 |
| 82. | Penn Wynne | 20 | 20,886(0.10%)#82 | 1,669,094(0.00%)#3,417 |
| 83. | Sharon Hill Borough | 20 | 20,886(0.10%)#83 | 1,669,094(0.00%)#3,418 |
| 84. | Imperial | 20 | 20,886(0.10%)#84 | 1,669,094(0.00%)#3,423 |
| 85. | Gold Key Lake | 20 | 20,886(0.10%)#85 | 1,669,094(0.00%)#3,425 |
| 86. | Messiah College | 20 | 20,886(0.10%)#86 | 1,669,094(0.00%)#3,426 |
| 87. | Colonial Park | 19 | 20,886(0.09%)#87 | 1,669,094(0.00%)#3,448 |
| 88. | Sanatoga | 19 | 20,886(0.09%)#88 | 1,669,094(0.00%)#3,460 |
| 89. | Enola | 19 | 20,886(0.09%)#89 | 1,669,094(0.00%)#3,465 |
| 90. | Shippensburg Borough | 19 | 20,886(0.09%)#90 | 1,669,094(0.00%)#3,468 |
| 91. | Dryville | 18 | 20,886(0.09%)#91 | 1,669,094(0.00%)#3,560 |
| 92. | Perkasie Borough | 17 | 20,886(0.08%)#92 | 1,669,094(0.00%)#3,584 |
| 93. | Carnegie Borough | 17 | 20,886(0.08%)#93 | 1,669,094(0.00%)#3,585 |
| 94. | Fountain Hill Borough | 17 | 20,886(0.08%)#94 | 1,669,094(0.00%)#3,594 |
| 95. | Bowmanstown Borough | 17 | 20,886(0.08%)#95 | 1,669,094(0.00%)#3,614 |
| 96. | South Williamsport Borough | 15 | 20,886(0.07%)#96 | 1,669,094(0.00%)#3,722 |
| 97. | Oklahoma | 15 | 20,886(0.07%)#97 | 1,669,094(0.00%)#3,744 |
| 98. | Gettysburg Borough | 14 | 20,886(0.07%)#98 | 1,669,094(0.00%)#3,797 |
| 99. | Denver Borough | 14 | 20,886(0.07%)#99 | 1,669,094(0.00%)#3,813 |
| 100. | Drexel Hill | 13 | 20,886(0.06%)#100 | 1,669,094(0.00%)#3,837 |
Common Questions
What are the Top 10 Cities with the Largest Guatemalan Community in Pennsylvania?
Top 10 Cities with the Largest Guatemalan Community in Pennsylvania are:
#1
5,042
#2
1,001
#3
570
#4
535
#5
462
#6
443
#7
369
#8
295
#9
230
#10
181
What city has the Largest Guatemalan Community in Pennsylvania?
Philadelphia has the Largest Guatemalan Community in Pennsylvania with 5,042.
What is the Total Guatemalan Population in the State of Pennsylvania?
Total Guatemalan Population in Pennsylvania is 20,886.
What is the Total Guatemalan Population in the United States?
Total Guatemalan Population in the United States is 1,669,094.