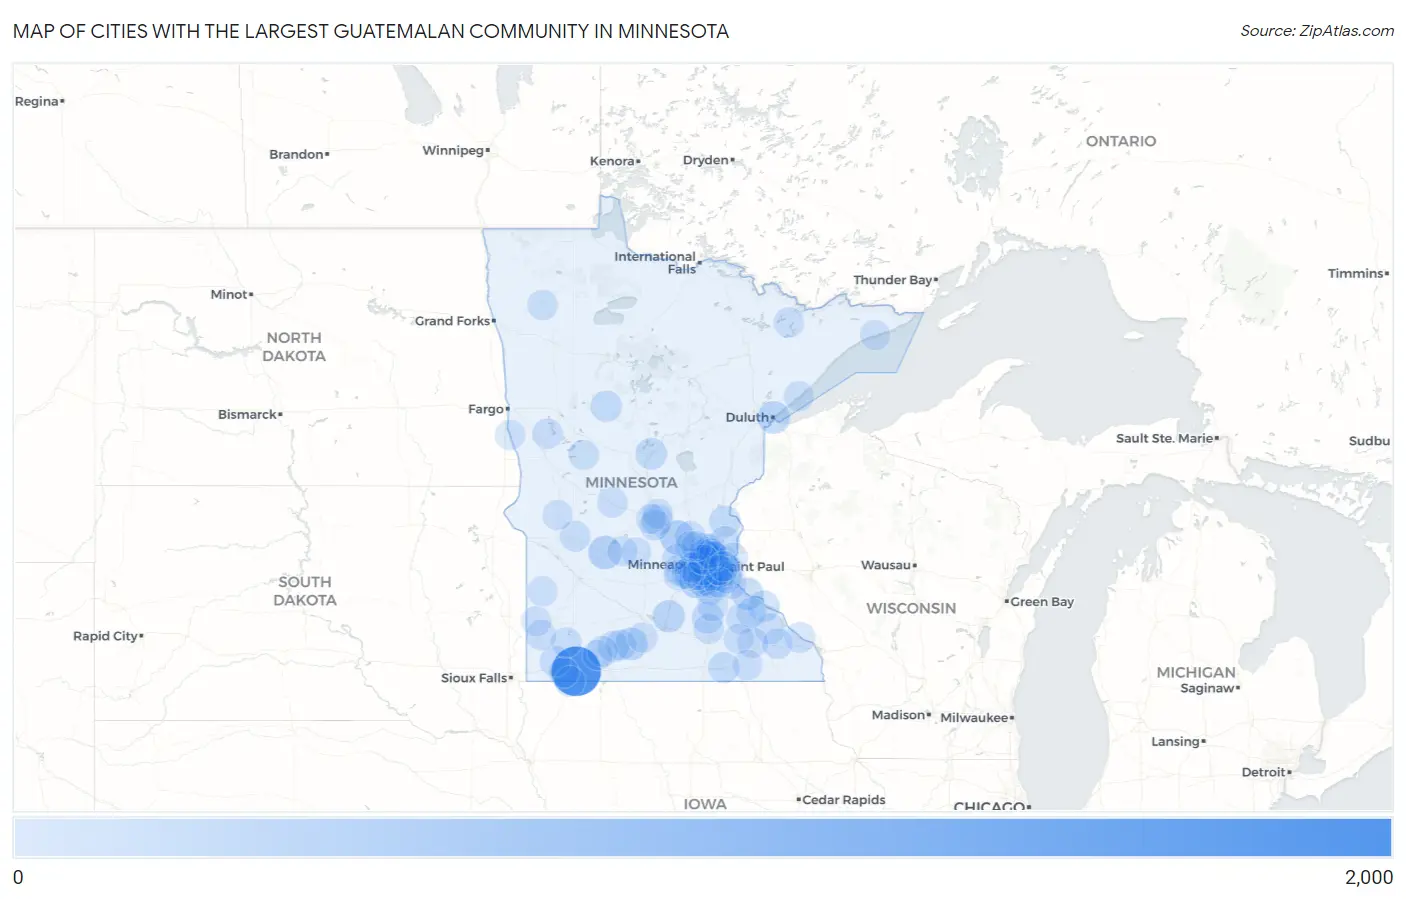
Cities with the Largest Guatemalan Community in Minnesota
RELATED REPORTS & OPTIONS
Guatemalan
Minnesota
Compare Cities
Map of Cities with the Largest Guatemalan Community in Minnesota
0
2,000
Cities with the Largest Guatemalan Community in Minnesota
| City | Guatemalan | vs State | vs National | |
| 1. | Worthington | 1,840 | 11,097(16.58%)#1 | 1,669,094(0.11%)#137 |
| 2. | Minneapolis | 1,061 | 11,097(9.56%)#2 | 1,669,094(0.06%)#258 |
| 3. | Brooklyn Center | 403 | 11,097(3.63%)#3 | 1,669,094(0.02%)#595 |
| 4. | Monticello | 385 | 11,097(3.47%)#4 | 1,669,094(0.02%)#624 |
| 5. | St Paul | 318 | 11,097(2.87%)#5 | 1,669,094(0.02%)#743 |
| 6. | Willmar | 316 | 11,097(2.85%)#6 | 1,669,094(0.02%)#748 |
| 7. | Shakopee | 311 | 11,097(2.80%)#7 | 1,669,094(0.02%)#757 |
| 8. | Duluth | 236 | 11,097(2.13%)#8 | 1,669,094(0.01%)#936 |
| 9. | St James | 229 | 11,097(2.06%)#9 | 1,669,094(0.01%)#958 |
| 10. | Red Wing | 196 | 11,097(1.77%)#10 | 1,669,094(0.01%)#1,062 |
| 11. | Plymouth | 195 | 11,097(1.76%)#11 | 1,669,094(0.01%)#1,066 |
| 12. | St Peter | 185 | 11,097(1.67%)#12 | 1,669,094(0.01%)#1,103 |
| 13. | Bloomington | 169 | 11,097(1.52%)#13 | 1,669,094(0.01%)#1,179 |
| 14. | Lakeville | 151 | 11,097(1.36%)#14 | 1,669,094(0.01%)#1,283 |
| 15. | Minnetonka | 143 | 11,097(1.29%)#15 | 1,669,094(0.01%)#1,331 |
| 16. | Chanhassen | 143 | 11,097(1.29%)#16 | 1,669,094(0.01%)#1,335 |
| 17. | North St Paul | 134 | 11,097(1.21%)#17 | 1,669,094(0.01%)#1,394 |
| 18. | Faribault | 133 | 11,097(1.20%)#18 | 1,669,094(0.01%)#1,399 |
| 19. | Baxter | 128 | 11,097(1.15%)#19 | 1,669,094(0.01%)#1,433 |
| 20. | Lake City | 126 | 11,097(1.14%)#20 | 1,669,094(0.01%)#1,437 |
| 21. | Richfield | 119 | 11,097(1.07%)#21 | 1,669,094(0.01%)#1,475 |
| 22. | North Branch | 115 | 11,097(1.04%)#22 | 1,669,094(0.01%)#1,510 |
| 23. | St Bonifacius | 115 | 11,097(1.04%)#23 | 1,669,094(0.01%)#1,513 |
| 24. | Austin | 107 | 11,097(0.96%)#24 | 1,669,094(0.01%)#1,574 |
| 25. | Cottage Grove | 105 | 11,097(0.95%)#25 | 1,669,094(0.01%)#1,591 |
| 26. | Park Rapids | 103 | 11,097(0.93%)#26 | 1,669,094(0.01%)#1,617 |
| 27. | Woodbury | 99 | 11,097(0.89%)#27 | 1,669,094(0.01%)#1,658 |
| 28. | New Brighton | 96 | 11,097(0.87%)#28 | 1,669,094(0.01%)#1,707 |
| 29. | New Hope | 96 | 11,097(0.87%)#29 | 1,669,094(0.01%)#1,708 |
| 30. | Coon Rapids | 92 | 11,097(0.83%)#30 | 1,669,094(0.01%)#1,750 |
| 31. | Mountain Lake | 88 | 11,097(0.79%)#31 | 1,669,094(0.01%)#1,813 |
| 32. | Inver Grove Heights | 86 | 11,097(0.77%)#32 | 1,669,094(0.01%)#1,825 |
| 33. | St Cloud | 84 | 11,097(0.76%)#33 | 1,669,094(0.01%)#1,839 |
| 34. | Burnsville | 81 | 11,097(0.73%)#34 | 1,669,094(0.00%)#1,874 |
| 35. | St Augusta | 72 | 11,097(0.65%)#35 | 1,669,094(0.00%)#1,995 |
| 36. | Benson | 72 | 11,097(0.65%)#36 | 1,669,094(0.00%)#1,996 |
| 37. | Butterfield | 72 | 11,097(0.65%)#37 | 1,669,094(0.00%)#1,998 |
| 38. | Apple Valley | 71 | 11,097(0.64%)#38 | 1,669,094(0.00%)#1,999 |
| 39. | Roseville | 68 | 11,097(0.61%)#39 | 1,669,094(0.00%)#2,047 |
| 40. | Lismore | 68 | 11,097(0.61%)#40 | 1,669,094(0.00%)#2,066 |
| 41. | Windom | 67 | 11,097(0.60%)#41 | 1,669,094(0.00%)#2,086 |
| 42. | Spring Lake Park | 61 | 11,097(0.55%)#42 | 1,669,094(0.00%)#2,182 |
| 43. | Bigelow | 61 | 11,097(0.55%)#43 | 1,669,094(0.00%)#2,192 |
| 44. | Hastings | 58 | 11,097(0.52%)#44 | 1,669,094(0.00%)#2,236 |
| 45. | Eagan | 55 | 11,097(0.50%)#45 | 1,669,094(0.00%)#2,290 |
| 46. | Winona | 53 | 11,097(0.48%)#46 | 1,669,094(0.00%)#2,336 |
| 47. | Delano | 52 | 11,097(0.47%)#47 | 1,669,094(0.00%)#2,371 |
| 48. | Zumbrota | 52 | 11,097(0.47%)#48 | 1,669,094(0.00%)#2,376 |
| 49. | St Louis Park | 50 | 11,097(0.45%)#49 | 1,669,094(0.00%)#2,402 |
| 50. | Plainview | 50 | 11,097(0.45%)#50 | 1,669,094(0.00%)#2,417 |
| 51. | Rochester | 49 | 11,097(0.44%)#51 | 1,669,094(0.00%)#2,420 |
| 52. | Fridley | 47 | 11,097(0.42%)#52 | 1,669,094(0.00%)#2,457 |
| 53. | Elk River | 46 | 11,097(0.41%)#53 | 1,669,094(0.00%)#2,475 |
| 54. | Waconia | 46 | 11,097(0.41%)#54 | 1,669,094(0.00%)#2,479 |
| 55. | Forest Lake | 44 | 11,097(0.40%)#55 | 1,669,094(0.00%)#2,528 |
| 56. | Slayton | 44 | 11,097(0.40%)#56 | 1,669,094(0.00%)#2,543 |
| 57. | Golden Valley | 43 | 11,097(0.39%)#57 | 1,669,094(0.00%)#2,554 |
| 58. | South St Paul | 43 | 11,097(0.39%)#58 | 1,669,094(0.00%)#2,556 |
| 59. | Savage | 41 | 11,097(0.37%)#59 | 1,669,094(0.00%)#2,594 |
| 60. | Crystal | 41 | 11,097(0.37%)#60 | 1,669,094(0.00%)#2,598 |
| 61. | Ely | 39 | 11,097(0.35%)#61 | 1,669,094(0.00%)#2,667 |
| 62. | Pelican Rapids | 39 | 11,097(0.35%)#62 | 1,669,094(0.00%)#2,669 |
| 63. | Edina | 37 | 11,097(0.33%)#63 | 1,669,094(0.00%)#2,713 |
| 64. | Holland | 37 | 11,097(0.33%)#64 | 1,669,094(0.00%)#2,739 |
| 65. | Brooklyn Park | 34 | 11,097(0.31%)#65 | 1,669,094(0.00%)#2,810 |
| 66. | Medford | 34 | 11,097(0.31%)#66 | 1,669,094(0.00%)#2,847 |
| 67. | Blaine | 33 | 11,097(0.30%)#67 | 1,669,094(0.00%)#2,850 |
| 68. | Thief River Falls | 33 | 11,097(0.30%)#68 | 1,669,094(0.00%)#2,866 |
| 69. | St Charles | 32 | 11,097(0.29%)#69 | 1,669,094(0.00%)#2,915 |
| 70. | Deephaven | 31 | 11,097(0.28%)#70 | 1,669,094(0.00%)#2,940 |
| 71. | Rogers | 30 | 11,097(0.27%)#71 | 1,669,094(0.00%)#2,956 |
| 72. | Rushmore | 30 | 11,097(0.27%)#72 | 1,669,094(0.00%)#2,974 |
| 73. | Mounds View | 28 | 11,097(0.25%)#73 | 1,669,094(0.00%)#3,036 |
| 74. | Sauk Centre | 27 | 11,097(0.24%)#74 | 1,669,094(0.00%)#3,080 |
| 75. | Henning | 27 | 11,097(0.24%)#75 | 1,669,094(0.00%)#3,092 |
| 76. | Eden Prairie | 26 | 11,097(0.23%)#76 | 1,669,094(0.00%)#3,097 |
| 77. | Sauk Rapids | 25 | 11,097(0.23%)#77 | 1,669,094(0.00%)#3,147 |
| 78. | Northfield | 24 | 11,097(0.22%)#78 | 1,669,094(0.00%)#3,190 |
| 79. | Morris | 23 | 11,097(0.21%)#79 | 1,669,094(0.00%)#3,265 |
| 80. | Stillwater | 22 | 11,097(0.20%)#80 | 1,669,094(0.00%)#3,296 |
| 81. | Arden Hills | 21 | 11,097(0.19%)#81 | 1,669,094(0.00%)#3,359 |
| 82. | Rosemount | 20 | 11,097(0.18%)#82 | 1,669,094(0.00%)#3,391 |
| 83. | Madelia | 19 | 11,097(0.17%)#83 | 1,669,094(0.00%)#3,477 |
| 84. | West St Paul | 18 | 11,097(0.16%)#84 | 1,669,094(0.00%)#3,504 |
| 85. | Kasson | 18 | 11,097(0.16%)#85 | 1,669,094(0.00%)#3,524 |
| 86. | Litchfield | 18 | 11,097(0.16%)#86 | 1,669,094(0.00%)#3,526 |
| 87. | Wolverton | 18 | 11,097(0.16%)#87 | 1,669,094(0.00%)#3,561 |
| 88. | Robbinsdale | 17 | 11,097(0.15%)#88 | 1,669,094(0.00%)#3,578 |
| 89. | Landfall | 17 | 11,097(0.15%)#89 | 1,669,094(0.00%)#3,617 |
| 90. | Victoria | 16 | 11,097(0.14%)#90 | 1,669,094(0.00%)#3,637 |
| 91. | Wilder | 16 | 11,097(0.14%)#91 | 1,669,094(0.00%)#3,684 |
| 92. | Grand Marais | 15 | 11,097(0.14%)#92 | 1,669,094(0.00%)#3,740 |
| 93. | Dayton | 14 | 11,097(0.13%)#93 | 1,669,094(0.00%)#3,795 |
| 94. | Waite Park | 12 | 11,097(0.11%)#94 | 1,669,094(0.00%)#3,934 |
| 95. | Lake Benton | 12 | 11,097(0.11%)#95 | 1,669,094(0.00%)#3,966 |
| 96. | Bellechester | 12 | 11,097(0.11%)#96 | 1,669,094(0.00%)#3,969 |
| 97. | Porter | 12 | 11,097(0.11%)#97 | 1,669,094(0.00%)#3,972 |
| 98. | Two Harbors | 11 | 11,097(0.10%)#98 | 1,669,094(0.00%)#4,023 |
| 99. | Atwater | 10 | 11,097(0.09%)#99 | 1,669,094(0.00%)#4,136 |
| 100. | Grand Meadow | 10 | 11,097(0.09%)#100 | 1,669,094(0.00%)#4,141 |
Common Questions
What are the Top 10 Cities with the Largest Guatemalan Community in Minnesota?
Top 10 Cities with the Largest Guatemalan Community in Minnesota are:
#1
1,840
#2
1,061
#3
403
#4
385
#5
318
#6
316
#7
311
#8
236
#9
229
#10
196
What city has the Largest Guatemalan Community in Minnesota?
Worthington has the Largest Guatemalan Community in Minnesota with 1,840.
What is the Total Guatemalan Population in the State of Minnesota?
Total Guatemalan Population in Minnesota is 11,097.
What is the Total Guatemalan Population in the United States?
Total Guatemalan Population in the United States is 1,669,094.