Cities with the Highest Poverty Level Among Seniors Over the Age of 65 in Minnesota
RELATED REPORTS & OPTIONS
Highest Poverty | Seniors 65+
Minnesota
Compare Cities
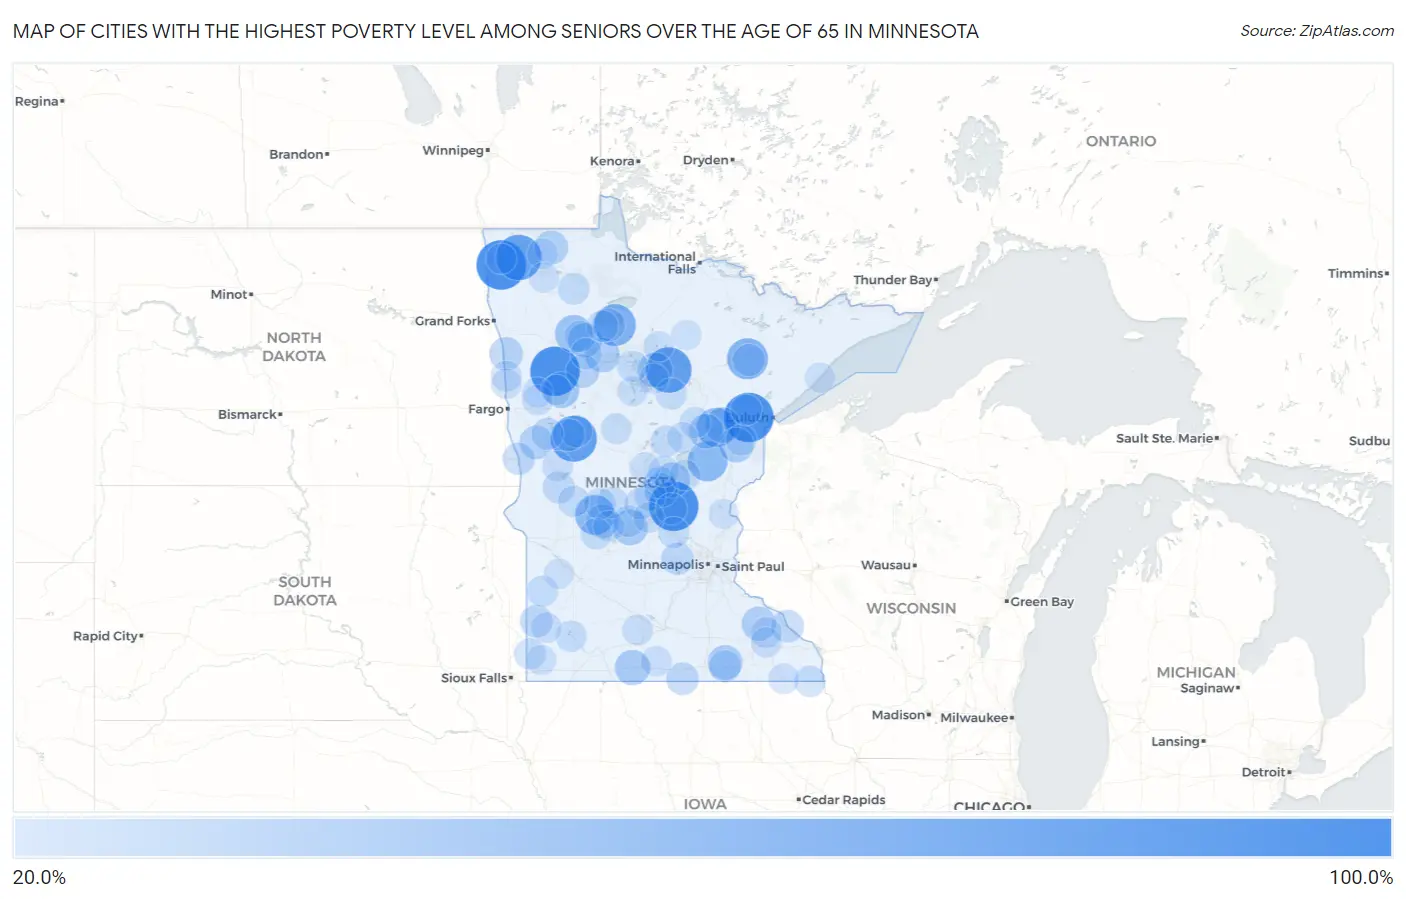
Map of Cities with the Highest Poverty Level Among Seniors Over the Age of 65 in Minnesota
0.0%
100.0%
Cities with the Highest Poverty Level Among Seniors Over the Age of 65 in Minnesota
| City | Senior Poverty | vs State | vs National | |
| 1. | Riverland | 100.0% | 7.9%(+92.1)#1 | 10.0%(+90.0)#48 |
| 2. | Mahnomen | 100.0% | 7.9%(+92.1)#2 | 10.0%(+90.0)#77 |
| 3. | Ronneby | 100.0% | 7.9%(+92.1)#3 | 10.0%(+90.0)#154 |
| 4. | Donaldson | 100.0% | 7.9%(+92.1)#4 | 10.0%(+90.0)#213 |
| 5. | Richville | 85.7% | 7.9%(+77.8)#5 | 10.0%(+75.8)#249 |
| 6. | Ball Club | 83.8% | 7.9%(+75.8)#6 | 10.0%(+73.8)#258 |
| 7. | Halma | 83.3% | 7.9%(+75.4)#7 | 10.0%(+73.4)#263 |
| 8. | Redby | 67.5% | 7.9%(+59.6)#8 | 10.0%(+57.5)#397 |
| 9. | Leonidas | 64.3% | 7.9%(+56.3)#9 | 10.0%(+54.3)#450 |
| 10. | Sedan | 60.0% | 7.9%(+52.1)#10 | 10.0%(+50.0)#515 |
| 11. | Mcgrath | 60.0% | 7.9%(+52.1)#11 | 10.0%(+50.0)#517 |
| 12. | Tamarack | 57.1% | 7.9%(+49.2)#12 | 10.0%(+47.2)#554 |
| 13. | Gully | 50.0% | 7.9%(+42.1)#13 | 10.0%(+40.0)#797 |
| 14. | White Earth | 44.1% | 7.9%(+36.2)#14 | 10.0%(+34.2)#1,018 |
| 15. | Roscoe | 42.1% | 7.9%(+34.2)#15 | 10.0%(+32.2)#1,118 |
| 16. | Wright | 41.2% | 7.9%(+33.2)#16 | 10.0%(+31.2)#1,176 |
| 17. | Welcome | 40.7% | 7.9%(+32.7)#17 | 10.0%(+30.7)#1,205 |
| 18. | St. John's University | 40.4% | 7.9%(+32.4)#18 | 10.0%(+30.4)#1,216 |
| 19. | Bena | 40.0% | 7.9%(+32.1)#19 | 10.0%(+30.0)#1,240 |
| 20. | Hillman | 40.0% | 7.9%(+32.1)#20 | 10.0%(+30.0)#1,263 |
| 21. | Moose Lake | 39.4% | 7.9%(+31.5)#21 | 10.0%(+29.5)#1,288 |
| 22. | Lansing | 38.9% | 7.9%(+30.9)#22 | 10.0%(+28.9)#1,325 |
| 23. | Mcgregor | 38.5% | 7.9%(+30.5)#23 | 10.0%(+28.5)#1,350 |
| 24. | Solway | 38.5% | 7.9%(+30.5)#24 | 10.0%(+28.5)#1,357 |
| 25. | Clearbrook | 37.3% | 7.9%(+29.3)#25 | 10.0%(+27.3)#1,438 |
| 26. | Hammond | 36.4% | 7.9%(+28.4)#26 | 10.0%(+26.4)#1,517 |
| 27. | Buckman | 35.3% | 7.9%(+27.3)#27 | 10.0%(+25.3)#1,617 |
| 28. | Badger | 34.9% | 7.9%(+27.0)#28 | 10.0%(+25.0)#1,643 |
| 29. | Rothsay | 34.6% | 7.9%(+26.7)#29 | 10.0%(+24.7)#1,661 |
| 30. | Brooten | 34.2% | 7.9%(+26.3)#30 | 10.0%(+24.3)#1,700 |
| 31. | Nielsville | 33.3% | 7.9%(+25.4)#31 | 10.0%(+23.4)#1,811 |
| 32. | South End | 33.3% | 7.9%(+25.4)#32 | 10.0%(+23.4)#1,830 |
| 33. | Minneiska | 30.4% | 7.9%(+22.5)#33 | 10.0%(+20.5)#2,147 |
| 34. | Red Lake | 30.3% | 7.9%(+22.4)#34 | 10.0%(+20.4)#2,162 |
| 35. | Lake Benton | 30.1% | 7.9%(+22.1)#35 | 10.0%(+20.1)#2,192 |
| 36. | Kiester | 29.8% | 7.9%(+21.9)#36 | 10.0%(+19.9)#2,231 |
| 37. | Delano | 29.2% | 7.9%(+21.3)#37 | 10.0%(+19.3)#2,322 |
| 38. | Eveleth | 28.7% | 7.9%(+20.7)#38 | 10.0%(+18.7)#2,412 |
| 39. | Perham | 28.3% | 7.9%(+20.4)#39 | 10.0%(+18.4)#2,490 |
| 40. | Breckenridge | 28.2% | 7.9%(+20.3)#40 | 10.0%(+18.2)#2,510 |
| 41. | Dent | 28.0% | 7.9%(+20.1)#41 | 10.0%(+18.0)#2,544 |
| 42. | Pelican Rapids | 27.9% | 7.9%(+20.0)#42 | 10.0%(+18.0)#2,557 |
| 43. | Mapleview | 27.8% | 7.9%(+19.8)#43 | 10.0%(+17.8)#2,585 |
| 44. | Barrett | 27.7% | 7.9%(+19.7)#44 | 10.0%(+17.7)#2,606 |
| 45. | Pierz | 27.2% | 7.9%(+19.3)#45 | 10.0%(+17.3)#2,698 |
| 46. | Grygla | 26.5% | 7.9%(+18.6)#46 | 10.0%(+16.6)#2,817 |
| 47. | Royalton | 26.5% | 7.9%(+18.5)#47 | 10.0%(+16.5)#2,832 |
| 48. | Little Rock | 26.2% | 7.9%(+18.2)#48 | 10.0%(+16.2)#2,888 |
| 49. | Ironton | 25.9% | 7.9%(+17.9)#49 | 10.0%(+15.9)#2,947 |
| 50. | Sauk Centre | 25.8% | 7.9%(+17.9)#50 | 10.0%(+15.9)#2,955 |
| 51. | Gonvick | 25.7% | 7.9%(+17.8)#51 | 10.0%(+15.8)#2,978 |
| 52. | Bagley | 25.6% | 7.9%(+17.7)#52 | 10.0%(+15.6)#3,007 |
| 53. | Foley | 25.5% | 7.9%(+17.6)#53 | 10.0%(+15.6)#3,037 |
| 54. | St Martin | 25.5% | 7.9%(+17.5)#54 | 10.0%(+15.5)#3,042 |
| 55. | Cass Lake | 25.2% | 7.9%(+17.3)#55 | 10.0%(+15.3)#3,113 |
| 56. | Holdingford | 25.0% | 7.9%(+17.1)#56 | 10.0%(+15.0)#3,150 |
| 57. | Jasper | 25.0% | 7.9%(+17.1)#57 | 10.0%(+15.0)#3,153 |
| 58. | Remer | 25.0% | 7.9%(+17.1)#58 | 10.0%(+15.0)#3,165 |
| 59. | Sunburg | 25.0% | 7.9%(+17.1)#59 | 10.0%(+15.0)#3,204 |
| 60. | Westport | 25.0% | 7.9%(+17.1)#60 | 10.0%(+15.0)#3,224 |
| 61. | Farwell | 25.0% | 7.9%(+17.1)#61 | 10.0%(+15.0)#3,230 |
| 62. | Becker | 24.9% | 7.9%(+16.9)#62 | 10.0%(+14.9)#3,245 |
| 63. | Currie | 24.4% | 7.9%(+16.5)#63 | 10.0%(+14.5)#3,330 |
| 64. | Porter | 24.4% | 7.9%(+16.4)#64 | 10.0%(+14.4)#3,342 |
| 65. | Eitzen | 24.3% | 7.9%(+16.4)#65 | 10.0%(+14.4)#3,358 |
| 66. | Harding | 24.1% | 7.9%(+16.2)#66 | 10.0%(+14.2)#3,418 |
| 67. | Palisade | 24.1% | 7.9%(+16.2)#67 | 10.0%(+14.2)#3,419 |
| 68. | Elgin | 23.8% | 7.9%(+15.9)#68 | 10.0%(+13.9)#3,488 |
| 69. | Aitkin | 23.7% | 7.9%(+15.8)#69 | 10.0%(+13.8)#3,507 |
| 70. | Barnum | 23.7% | 7.9%(+15.7)#70 | 10.0%(+13.7)#3,520 |
| 71. | Belgrade | 23.3% | 7.9%(+15.3)#71 | 10.0%(+13.3)#3,645 |
| 72. | St Joseph | 23.1% | 7.9%(+15.2)#72 | 10.0%(+13.2)#3,679 |
| 73. | Brookston | 23.1% | 7.9%(+15.1)#73 | 10.0%(+13.1)#3,710 |
| 74. | Nimrod | 23.1% | 7.9%(+15.1)#74 | 10.0%(+13.1)#3,714 |
| 75. | Onamia | 23.0% | 7.9%(+15.1)#75 | 10.0%(+13.1)#3,725 |
| 76. | Hanska | 22.9% | 7.9%(+14.9)#76 | 10.0%(+12.9)#3,759 |
| 77. | Hitterdal | 22.7% | 7.9%(+14.8)#77 | 10.0%(+12.8)#3,805 |
| 78. | Hendrum | 22.7% | 7.9%(+14.8)#78 | 10.0%(+12.8)#3,811 |
| 79. | Winnebago | 22.3% | 7.9%(+14.4)#79 | 10.0%(+12.4)#3,909 |
| 80. | Dalton | 22.2% | 7.9%(+14.3)#80 | 10.0%(+12.3)#3,941 |
| 81. | Fort Ripley | 22.2% | 7.9%(+14.3)#81 | 10.0%(+12.3)#3,958 |
| 82. | St Anthony City Stearns County | 22.2% | 7.9%(+14.3)#82 | 10.0%(+12.3)#3,967 |
| 83. | Hubbard | 22.2% | 7.9%(+14.3)#83 | 10.0%(+12.3)#3,971 |
| 84. | Greenbush | 22.1% | 7.9%(+14.2)#84 | 10.0%(+12.2)#3,988 |
| 85. | Canton | 22.0% | 7.9%(+14.0)#85 | 10.0%(+12.0)#4,032 |
| 86. | Middle River | 21.9% | 7.9%(+13.9)#86 | 10.0%(+11.9)#4,057 |
| 87. | Eyota | 21.6% | 7.9%(+13.7)#87 | 10.0%(+11.7)#4,119 |
| 88. | Ulen | 21.4% | 7.9%(+13.5)#88 | 10.0%(+11.5)#4,177 |
| 89. | Ogema | 21.4% | 7.9%(+13.5)#89 | 10.0%(+11.5)#4,183 |
| 90. | Ruthton | 21.4% | 7.9%(+13.5)#90 | 10.0%(+11.5)#4,186 |
| 91. | Perley | 21.4% | 7.9%(+13.5)#91 | 10.0%(+11.5)#4,191 |
| 92. | Squaw Lake | 21.4% | 7.9%(+13.5)#92 | 10.0%(+11.5)#4,193 |
| 93. | Walker | 21.4% | 7.9%(+13.4)#93 | 10.0%(+11.4)#4,207 |
| 94. | Boyd | 21.2% | 7.9%(+13.3)#94 | 10.0%(+11.3)#4,264 |
| 95. | Beaver Bay | 21.2% | 7.9%(+13.3)#95 | 10.0%(+11.3)#4,266 |
| 96. | Bigfork | 21.2% | 7.9%(+13.2)#96 | 10.0%(+11.2)#4,276 |
| 97. | Harris | 20.7% | 7.9%(+12.8)#97 | 10.0%(+10.8)#4,436 |
| 98. | Hardwick | 20.7% | 7.9%(+12.7)#98 | 10.0%(+10.7)#4,454 |
| 99. | Kennedy | 20.6% | 7.9%(+12.6)#99 | 10.0%(+10.6)#4,492 |
| 100. | Federal Dam | 20.6% | 7.9%(+12.6)#100 | 10.0%(+10.6)#4,493 |
Common Questions
What are the Top 10 Cities with the Highest Poverty Level Among Seniors Over the Age of 65 in Minnesota?
Top 10 Cities with the Highest Poverty Level Among Seniors Over the Age of 65 in Minnesota are:
What city has the Highest Poverty Level Among Seniors Over the Age of 65 in Minnesota?
Riverland has the Highest Poverty Level Among Seniors Over the Age of 65 in Minnesota with 100.0%.
What is the Poverty Level Among Seniors Over the Age of 65 in the State of Minnesota?
Poverty Level Among Seniors Over the Age of 65 in Minnesota is 7.9%.
What is the Poverty Level Among Seniors Over the Age of 65 in the United States?
Poverty Level Among Seniors Over the Age of 65 in the United States is 10.0%.