Cities with the Highest Poverty Level Among Seniors Over the Age of 65 in New York
RELATED REPORTS & OPTIONS
Highest Poverty | Seniors 65+
New York
Compare Cities
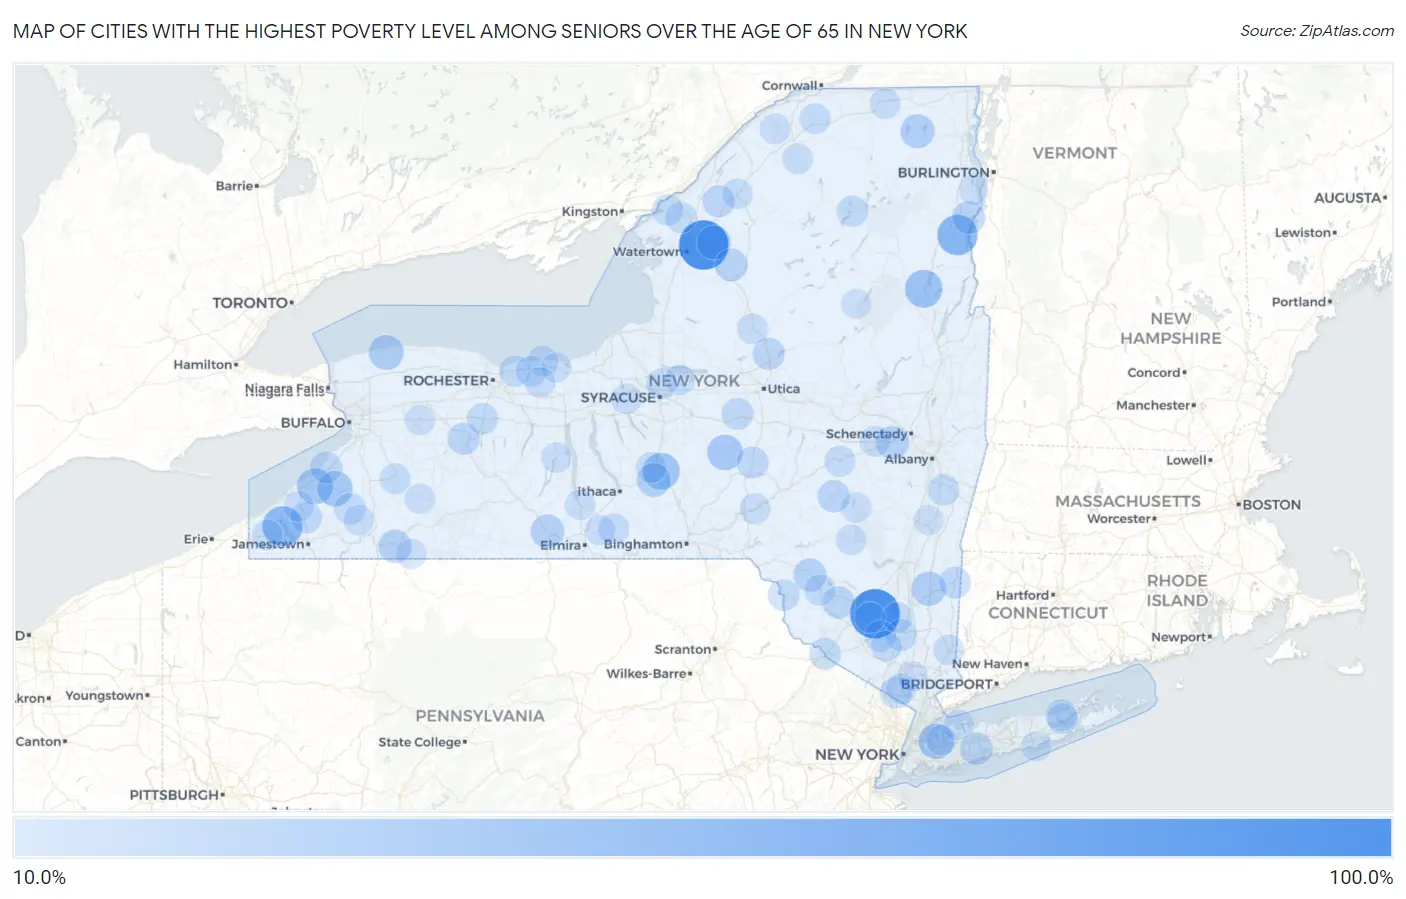
Map of Cities with the Highest Poverty Level Among Seniors Over the Age of 65 in New York
0.0%
100.0%
Cities with the Highest Poverty Level Among Seniors Over the Age of 65 in New York
| City | Senior Poverty | vs State | vs National | |
| 1. | Siena College | 100.0% | 12.2%(+87.8)#1 | 10.0%(+90.0)#2 |
| 2. | Nazareth College | 100.0% | 12.2%(+87.8)#2 | 10.0%(+90.0)#8 |
| 3. | Watchtower | 100.0% | 12.2%(+87.8)#3 | 10.0%(+90.0)#21 |
| 4. | Felts Mills | 100.0% | 12.2%(+87.8)#4 | 10.0%(+90.0)#30 |
| 5. | Schuyler Lake | 66.7% | 12.2%(+54.5)#5 | 10.0%(+56.7)#413 |
| 6. | Witherbee | 61.1% | 12.2%(+48.9)#6 | 10.0%(+51.2)#486 |
| 7. | Chautauqua | 60.2% | 12.2%(+48.1)#7 | 10.0%(+50.3)#502 |
| 8. | Wingdale | 53.4% | 12.2%(+41.3)#8 | 10.0%(+43.5)#653 |
| 9. | Pottersville | 50.0% | 12.2%(+37.8)#9 | 10.0%(+40.0)#772 |
| 10. | Blodgett Mills | 46.9% | 12.2%(+34.7)#10 | 10.0%(+36.9)#904 |
| 11. | Forestville | 42.9% | 12.2%(+30.7)#11 | 10.0%(+32.9)#1,080 |
| 12. | Smyrna | 41.2% | 12.2%(+29.0)#12 | 10.0%(+31.2)#1,174 |
| 13. | Perrysburg | 41.1% | 12.2%(+28.9)#13 | 10.0%(+31.1)#1,180 |
| 14. | Great Neck Gardens | 40.9% | 12.2%(+28.7)#14 | 10.0%(+30.9)#1,195 |
| 15. | Barker | 38.8% | 12.2%(+26.7)#15 | 10.0%(+28.9)#1,329 |
| 16. | Salt Point | 36.4% | 12.2%(+24.2)#16 | 10.0%(+26.4)#1,511 |
| 17. | Deferiet | 35.7% | 12.2%(+23.5)#17 | 10.0%(+25.8)#1,575 |
| 18. | Lyon Mountain | 35.6% | 12.2%(+23.4)#18 | 10.0%(+25.6)#1,595 |
| 19. | Virgil | 35.3% | 12.2%(+23.1)#19 | 10.0%(+25.3)#1,618 |
| 20. | Newfield | 33.8% | 12.2%(+21.6)#20 | 10.0%(+23.8)#1,726 |
| 21. | Coopers Plains | 33.3% | 12.2%(+21.2)#21 | 10.0%(+23.4)#1,765 |
| 22. | Duane Lake | 32.6% | 12.2%(+20.4)#22 | 10.0%(+22.6)#1,880 |
| 23. | St Bonaventure | 32.5% | 12.2%(+20.3)#23 | 10.0%(+22.5)#1,890 |
| 24. | Livingston Manor | 32.3% | 12.2%(+20.1)#24 | 10.0%(+22.3)#1,907 |
| 25. | Westport | 31.5% | 12.2%(+19.3)#25 | 10.0%(+21.6)#2,017 |
| 26. | Castorland | 30.5% | 12.2%(+18.3)#26 | 10.0%(+20.6)#2,138 |
| 27. | Wyandanch | 30.0% | 12.2%(+17.8)#27 | 10.0%(+20.0)#2,214 |
| 28. | Stamford | 28.8% | 12.2%(+16.6)#28 | 10.0%(+18.8)#2,397 |
| 29. | Woodridge | 28.7% | 12.2%(+16.5)#29 | 10.0%(+18.7)#2,410 |
| 30. | Remsen | 28.4% | 12.2%(+16.3)#30 | 10.0%(+18.5)#2,474 |
| 31. | Oxbow | 28.0% | 12.2%(+15.8)#31 | 10.0%(+18.0)#2,547 |
| 32. | North Granville | 27.9% | 12.2%(+15.7)#32 | 10.0%(+18.0)#2,558 |
| 33. | Cuylerville | 27.8% | 12.2%(+15.6)#33 | 10.0%(+17.8)#2,579 |
| 34. | New Berlin | 27.3% | 12.2%(+15.1)#34 | 10.0%(+17.4)#2,664 |
| 35. | Farnham | 27.1% | 12.2%(+15.0)#35 | 10.0%(+17.2)#2,709 |
| 36. | Oriskany Falls | 27.1% | 12.2%(+14.9)#36 | 10.0%(+17.1)#2,716 |
| 37. | Kaser | 27.1% | 12.2%(+14.9)#37 | 10.0%(+17.1)#2,719 |
| 38. | Sinclairville | 26.6% | 12.2%(+14.4)#38 | 10.0%(+16.6)#2,802 |
| 39. | Amenia | 26.2% | 12.2%(+14.0)#39 | 10.0%(+16.2)#2,893 |
| 40. | Callicoon | 25.9% | 12.2%(+13.7)#40 | 10.0%(+15.9)#2,950 |
| 41. | Rosendale | 25.8% | 12.2%(+13.7)#41 | 10.0%(+15.9)#2,952 |
| 42. | Niverville | 25.6% | 12.2%(+13.4)#42 | 10.0%(+15.6)#3,006 |
| 43. | Port Jervis | 25.6% | 12.2%(+13.4)#43 | 10.0%(+15.6)#3,013 |
| 44. | Northville | 25.6% | 12.2%(+13.4)#44 | 10.0%(+15.6)#3,020 |
| 45. | Akwesasne | 25.4% | 12.2%(+13.3)#45 | 10.0%(+15.5)#3,052 |
| 46. | Newburgh | 25.3% | 12.2%(+13.1)#46 | 10.0%(+15.3)#3,106 |
| 47. | Cattaraugus | 25.1% | 12.2%(+13.0)#47 | 10.0%(+15.2)#3,119 |
| 48. | Tupper Lake | 25.1% | 12.2%(+12.9)#48 | 10.0%(+15.2)#3,130 |
| 49. | East Avon | 25.0% | 12.2%(+12.8)#49 | 10.0%(+15.0)#3,155 |
| 50. | Webster | 24.7% | 12.2%(+12.5)#50 | 10.0%(+14.7)#3,269 |
| 51. | Liberty | 24.6% | 12.2%(+12.4)#51 | 10.0%(+14.7)#3,276 |
| 52. | Maybrook | 24.6% | 12.2%(+12.4)#52 | 10.0%(+14.6)#3,285 |
| 53. | Van Etten | 24.4% | 12.2%(+12.2)#53 | 10.0%(+14.4)#3,348 |
| 54. | East Herkimer | 24.2% | 12.2%(+12.1)#54 | 10.0%(+14.3)#3,378 |
| 55. | Pultneyville | 24.0% | 12.2%(+11.9)#55 | 10.0%(+14.1)#3,438 |
| 56. | Richmondville | 24.0% | 12.2%(+11.8)#56 | 10.0%(+14.0)#3,442 |
| 57. | La Fargeville | 24.0% | 12.2%(+11.8)#57 | 10.0%(+14.0)#3,444 |
| 58. | Clayton | 23.9% | 12.2%(+11.7)#58 | 10.0%(+13.9)#3,471 |
| 59. | Ontario | 23.6% | 12.2%(+11.4)#59 | 10.0%(+13.6)#3,549 |
| 60. | Yorkshire | 23.5% | 12.2%(+11.3)#60 | 10.0%(+13.5)#3,591 |
| 61. | Washingtonville | 23.4% | 12.2%(+11.2)#61 | 10.0%(+13.5)#3,599 |
| 62. | Plattekill | 23.4% | 12.2%(+11.2)#62 | 10.0%(+13.5)#3,602 |
| 63. | Brasher Falls | 23.4% | 12.2%(+11.2)#63 | 10.0%(+13.5)#3,606 |
| 64. | Esperance | 23.2% | 12.2%(+11.0)#64 | 10.0%(+13.3)#3,665 |
| 65. | North Syracuse | 23.2% | 12.2%(+11.0)#65 | 10.0%(+13.3)#3,666 |
| 66. | Aquebogue | 22.9% | 12.2%(+10.7)#66 | 10.0%(+13.0)#3,752 |
| 67. | Cortland West | 22.8% | 12.2%(+10.6)#67 | 10.0%(+12.8)#3,794 |
| 68. | Unadilla | 22.7% | 12.2%(+10.5)#68 | 10.0%(+12.7)#3,817 |
| 69. | Burke | 22.6% | 12.2%(+10.4)#69 | 10.0%(+12.6)#3,847 |
| 70. | Madrid | 22.5% | 12.2%(+10.3)#70 | 10.0%(+12.5)#3,870 |
| 71. | Colton | 22.4% | 12.2%(+10.2)#71 | 10.0%(+12.5)#3,894 |
| 72. | Centre Island | 22.4% | 12.2%(+10.2)#72 | 10.0%(+12.4)#3,895 |
| 73. | Gouverneur | 22.3% | 12.2%(+10.1)#73 | 10.0%(+12.3)#3,919 |
| 74. | Pine Hill | 22.2% | 12.2%(+10.0)#74 | 10.0%(+12.3)#3,939 |
| 75. | Boonville | 22.1% | 12.2%(+9.94)#75 | 10.0%(+12.2)#3,991 |
| 76. | Sherman | 22.0% | 12.2%(+9.86)#76 | 10.0%(+12.1)#4,009 |
| 77. | Brewster | 22.0% | 12.2%(+9.83)#77 | 10.0%(+12.1)#4,015 |
| 78. | Brewster Heights | 21.7% | 12.2%(+9.54)#78 | 10.0%(+11.8)#4,102 |
| 79. | Alexander | 21.6% | 12.2%(+9.39)#79 | 10.0%(+11.6)#4,135 |
| 80. | Prattsville | 21.6% | 12.2%(+9.39)#80 | 10.0%(+11.6)#4,140 |
| 81. | Rushford | 21.5% | 12.2%(+9.35)#81 | 10.0%(+11.6)#4,153 |
| 82. | New Square | 21.5% | 12.2%(+9.34)#82 | 10.0%(+11.6)#4,156 |
| 83. | Penn Yan | 21.5% | 12.2%(+9.28)#83 | 10.0%(+11.5)#4,171 |
| 84. | Cassadaga | 21.3% | 12.2%(+9.15)#84 | 10.0%(+11.4)#4,225 |
| 85. | Elbridge | 21.3% | 12.2%(+9.13)#85 | 10.0%(+11.4)#4,230 |
| 86. | Pine Bush | 21.3% | 12.2%(+9.10)#86 | 10.0%(+11.3)#4,235 |
| 87. | Unadilla Forks | 21.2% | 12.2%(+9.04)#87 | 10.0%(+11.3)#4,262 |
| 88. | Flower Hill | 21.2% | 12.2%(+9.03)#88 | 10.0%(+11.3)#4,268 |
| 89. | Erin | 21.1% | 12.2%(+8.95)#89 | 10.0%(+11.2)#4,284 |
| 90. | Bridgeport | 21.1% | 12.2%(+8.88)#90 | 10.0%(+11.1)#4,303 |
| 91. | Little Valley | 20.8% | 12.2%(+8.66)#91 | 10.0%(+10.9)#4,387 |
| 92. | Montour Falls | 20.7% | 12.2%(+8.55)#92 | 10.0%(+10.8)#4,434 |
| 93. | Marion | 20.7% | 12.2%(+8.49)#93 | 10.0%(+10.7)#4,467 |
| 94. | Portville | 20.5% | 12.2%(+8.34)#94 | 10.0%(+10.6)#4,513 |
| 95. | Sodus | 20.4% | 12.2%(+8.25)#95 | 10.0%(+10.5)#4,551 |
| 96. | Hudson | 20.4% | 12.2%(+8.20)#96 | 10.0%(+10.4)#4,568 |
| 97. | Speculator | 20.4% | 12.2%(+8.19)#97 | 10.0%(+10.4)#4,579 |
| 98. | Willsboro | 20.2% | 12.2%(+8.02)#98 | 10.0%(+10.2)#4,636 |
| 99. | Crugers | 20.1% | 12.2%(+7.91)#99 | 10.0%(+10.1)#4,677 |
| 100. | Mastic Beach | 20.0% | 12.2%(+7.83)#100 | 10.0%(+10.0)#4,694 |
Common Questions
What are the Top 10 Cities with the Highest Poverty Level Among Seniors Over the Age of 65 in New York?
Top 10 Cities with the Highest Poverty Level Among Seniors Over the Age of 65 in New York are:
#1
100.0%
#2
100.0%
#3
61.1%
#4
60.2%
#5
50.0%
#6
46.9%
#7
42.9%
#8
41.2%
#9
41.1%
#10
40.9%
What city has the Highest Poverty Level Among Seniors Over the Age of 65 in New York?
Watchtower has the Highest Poverty Level Among Seniors Over the Age of 65 in New York with 100.0%.
What is the Poverty Level Among Seniors Over the Age of 65 in the State of New York?
Poverty Level Among Seniors Over the Age of 65 in New York is 12.2%.
What is the Poverty Level Among Seniors Over the Age of 65 in the United States?
Poverty Level Among Seniors Over the Age of 65 in the United States is 10.0%.