Cities with the Highest Poverty Level Among Seniors Over the Age of 65 in Connecticut
RELATED REPORTS & OPTIONS
Highest Poverty | Seniors 65+
Connecticut
Compare Cities
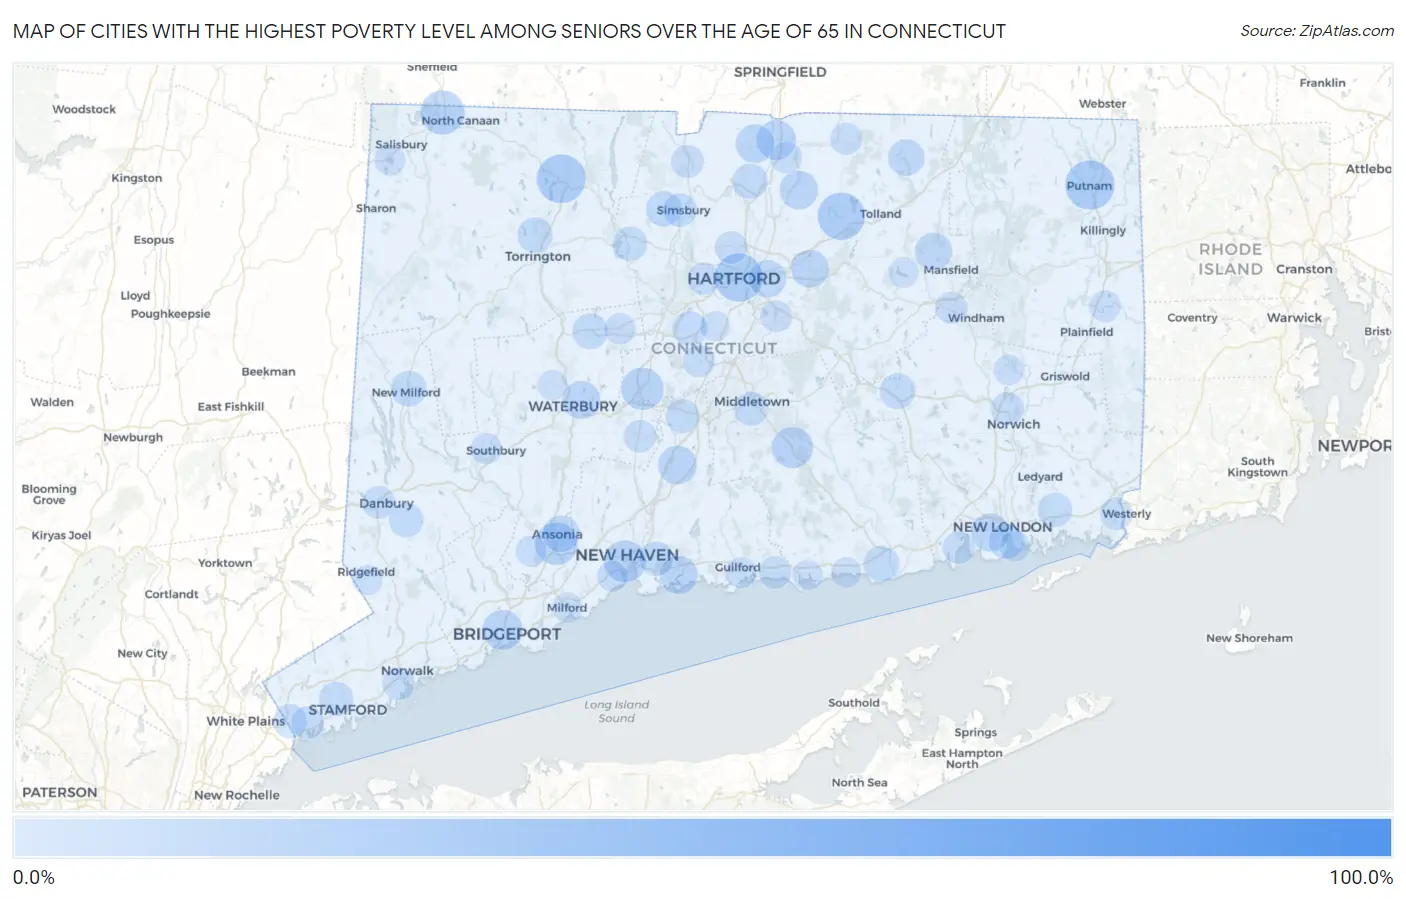
Map of Cities with the Highest Poverty Level Among Seniors Over the Age of 65 in Connecticut
0.0%
100.0%
Cities with the Highest Poverty Level Among Seniors Over the Age of 65 in Connecticut
| City | Senior Poverty | vs State | vs National | |
| 1. | Fairfield University | 100.0% | 7.9%(+92.1)#1 | 10.0%(+90.0)#1 |
| 2. | Hawleyville | 50.0% | 7.9%(+42.1)#2 | 10.0%(+40.0)#771 |
| 3. | Danielson Borough | 44.3% | 7.9%(+36.3)#3 | 10.0%(+34.3)#1,009 |
| 4. | Topstone | 31.7% | 7.9%(+23.8)#4 | 10.0%(+21.8)#1,984 |
| 5. | Putnam | 27.8% | 7.9%(+19.9)#5 | 10.0%(+17.9)#2,572 |
| 6. | Winsted | 27.2% | 7.9%(+19.2)#6 | 10.0%(+17.2)#2,708 |
| 7. | Hartford | 26.6% | 7.9%(+18.6)#7 | 10.0%(+16.6)#2,803 |
| 8. | Rockville | 25.4% | 7.9%(+17.4)#8 | 10.0%(+15.4)#3,075 |
| 9. | Indian Field | 21.9% | 7.9%(+14.0)#9 | 10.0%(+12.0)#4,043 |
| 10. | Canaan | 21.5% | 7.9%(+13.6)#10 | 10.0%(+11.6)#4,150 |
| 11. | Derby | 20.0% | 7.9%(+12.1)#11 | 10.0%(+10.1)#4,693 |
| 12. | Plantsville | 19.7% | 7.9%(+11.7)#12 | 10.0%(+9.72)#4,912 |
| 13. | Bantam Borough | 19.7% | 7.9%(+11.7)#13 | 10.0%(+9.71)#4,916 |
| 14. | New Haven | 19.0% | 7.9%(+11.1)#14 | 10.0%(+9.05)#5,214 |
| 15. | Higganum | 18.2% | 7.9%(+10.3)#15 | 10.0%(+8.25)#5,548 |
| 16. | Taylor Corners | 17.4% | 7.9%(+9.41)#16 | 10.0%(+7.41)#6,019 |
| 17. | Bridgeport | 16.9% | 7.9%(+8.98)#17 | 10.0%(+6.98)#6,269 |
| 18. | Thompsonville | 16.3% | 7.9%(+8.36)#18 | 10.0%(+6.36)#6,653 |
| 19. | Inglenook | 15.6% | 7.9%(+7.70)#19 | 10.0%(+5.69)#7,061 |
| 20. | Wallingford Center | 15.5% | 7.9%(+7.59)#20 | 10.0%(+5.58)#7,127 |
| 21. | Broad Brook | 15.2% | 7.9%(+7.22)#21 | 10.0%(+5.22)#7,371 |
| 22. | Suffield Depot | 15.0% | 7.9%(+7.05)#22 | 10.0%(+5.05)#7,486 |
| 23. | Waterbury | 14.7% | 7.9%(+6.74)#23 | 10.0%(+4.74)#7,714 |
| 24. | Branford Center | 14.5% | 7.9%(+6.59)#24 | 10.0%(+4.58)#7,823 |
| 25. | Waterford | 14.5% | 7.9%(+6.51)#25 | 10.0%(+4.50)#7,876 |
| 26. | Jewett City Borough | 14.3% | 7.9%(+6.34)#26 | 10.0%(+4.33)#7,979 |
| 27. | Manchester | 14.2% | 7.9%(+6.30)#27 | 10.0%(+4.29)#8,081 |
| 28. | East Hartford | 13.9% | 7.9%(+5.95)#28 | 10.0%(+3.95)#8,336 |
| 29. | Storrs | 13.8% | 7.9%(+5.82)#29 | 10.0%(+3.82)#8,473 |
| 30. | Ansonia | 13.0% | 7.9%(+5.08)#30 | 10.0%(+3.07)#9,161 |
| 31. | Stafford Springs | 12.8% | 7.9%(+4.88)#31 | 10.0%(+2.88)#9,316 |
| 32. | Ridgebury | 12.1% | 7.9%(+4.18)#32 | 10.0%(+2.18)#10,009 |
| 33. | New Milford | 11.9% | 7.9%(+3.97)#33 | 10.0%(+1.97)#10,231 |
| 34. | Terryville | 11.8% | 7.9%(+3.81)#34 | 10.0%(+1.81)#10,432 |
| 35. | Colchester | 11.7% | 7.9%(+3.73)#35 | 10.0%(+1.73)#10,517 |
| 36. | Old Saybrook Center | 11.7% | 7.9%(+3.71)#36 | 10.0%(+1.70)#10,544 |
| 37. | Oronoque | 11.6% | 7.9%(+3.63)#37 | 10.0%(+1.63)#10,607 |
| 38. | West Simsbury | 11.5% | 7.9%(+3.57)#38 | 10.0%(+1.56)#10,680 |
| 39. | Torrington | 11.4% | 7.9%(+3.46)#39 | 10.0%(+1.46)#10,779 |
| 40. | Windsor Locks | 11.3% | 7.9%(+3.40)#40 | 10.0%(+1.39)#10,841 |
| 41. | New London | 11.1% | 7.9%(+3.12)#41 | 10.0%(+1.12)#11,179 |
| 42. | New Britain | 10.8% | 7.9%(+2.84)#42 | 10.0%(+0.840)#11,487 |
| 43. | Old Mystic | 10.5% | 7.9%(+2.59)#43 | 10.0%(+0.590)#11,767 |
| 44. | Collinsville | 10.5% | 7.9%(+2.57)#44 | 10.0%(+0.561)#11,819 |
| 45. | Bethel | 10.3% | 7.9%(+2.39)#45 | 10.0%(+0.382)#12,049 |
| 46. | East Haven | 10.3% | 7.9%(+2.31)#46 | 10.0%(+0.305)#12,127 |
| 47. | Stamford | 10.2% | 7.9%(+2.24)#47 | 10.0%(+0.236)#12,233 |
| 48. | Middletown | 9.9% | 7.9%(+1.98)#48 | 10.0%(-0.022)#12,583 |
| 49. | Meriden | 9.9% | 7.9%(+1.96)#49 | 10.0%(-0.049)#12,611 |
| 50. | Glenville | 9.8% | 7.9%(+1.88)#50 | 10.0%(-0.126)#12,718 |
| 51. | Noroton Heights | 9.3% | 7.9%(+1.36)#51 | 10.0%(-0.641)#13,383 |
| 52. | Simsbury Center | 9.3% | 7.9%(+1.31)#52 | 10.0%(-0.697)#13,454 |
| 53. | Mechanicsville | 9.2% | 7.9%(+1.28)#53 | 10.0%(-0.721)#13,490 |
| 54. | Norwich | 9.2% | 7.9%(+1.27)#54 | 10.0%(-0.734)#13,504 |
| 55. | Northford | 9.1% | 7.9%(+1.19)#55 | 10.0%(-0.819)#13,590 |
| 56. | Cornwall Bridge | 8.9% | 7.9%(+0.982)#56 | 10.0%(-1.02)#13,870 |
| 57. | Salmon Brook | 8.6% | 7.9%(+0.685)#57 | 10.0%(-1.32)#14,266 |
| 58. | Danbury | 8.5% | 7.9%(+0.572)#58 | 10.0%(-1.43)#14,431 |
| 59. | Pawcatuck | 8.5% | 7.9%(+0.566)#59 | 10.0%(-1.44)#14,438 |
| 60. | Greenwich | 8.4% | 7.9%(+0.436)#60 | 10.0%(-1.57)#14,612 |
| 61. | Route 7 Gateway | 8.3% | 7.9%(+0.362)#61 | 10.0%(-1.64)#14,752 |
| 62. | Cheshire Village | 8.3% | 7.9%(+0.355)#62 | 10.0%(-1.65)#14,759 |
| 63. | Blue Hills | 8.3% | 7.9%(+0.340)#63 | 10.0%(-1.66)#14,776 |
| 64. | Norwalk | 8.1% | 7.9%(+0.183)#64 | 10.0%(-1.82)#14,968 |
| 65. | Noroton | 8.1% | 7.9%(+0.139)#65 | 10.0%(-1.87)#15,029 |
| 66. | Westport | 8.0% | 7.9%(+0.096)#66 | 10.0%(-1.91)#15,086 |
| 67. | West Hartford | 8.0% | 7.9%(+0.079)#67 | 10.0%(-1.93)#15,111 |
| 68. | Madison Center | 8.0% | 7.9%(+0.074)#68 | 10.0%(-1.93)#15,118 |
| 69. | Niantic | 7.8% | 7.9%(-0.140)#69 | 10.0%(-2.14)#15,432 |
| 70. | Kensington | 7.7% | 7.9%(-0.277)#70 | 10.0%(-2.28)#15,674 |
| 71. | Greens Farms | 7.5% | 7.9%(-0.442)#71 | 10.0%(-2.45)#15,890 |
| 72. | Somers | 7.5% | 7.9%(-0.480)#72 | 10.0%(-2.49)#15,940 |
| 73. | Willimantic | 7.4% | 7.9%(-0.499)#73 | 10.0%(-2.50)#15,965 |
| 74. | Naugatuck Borough | 7.3% | 7.9%(-0.630)#74 | 10.0%(-2.63)#16,131 |
| 75. | Southwood Acres | 7.3% | 7.9%(-0.640)#75 | 10.0%(-2.64)#16,154 |
| 76. | Moosup | 7.2% | 7.9%(-0.705)#76 | 10.0%(-2.71)#16,247 |
| 77. | Glastonbury Center | 7.2% | 7.9%(-0.705)#77 | 10.0%(-2.71)#16,249 |
| 78. | Staples | 7.2% | 7.9%(-0.779)#78 | 10.0%(-2.78)#16,322 |
| 79. | Bristol | 6.9% | 7.9%(-1.10)#79 | 10.0%(-3.10)#16,798 |
| 80. | Candlewood Orchards | 6.8% | 7.9%(-1.16)#80 | 10.0%(-3.16)#16,886 |
| 81. | Litchfield Borough | 6.8% | 7.9%(-1.16)#81 | 10.0%(-3.17)#16,893 |
| 82. | Sandy Hook | 6.7% | 7.9%(-1.28)#82 | 10.0%(-3.29)#17,126 |
| 83. | Heritage Village | 6.4% | 7.9%(-1.55)#83 | 10.0%(-3.55)#17,483 |
| 84. | Shelton | 6.3% | 7.9%(-1.63)#84 | 10.0%(-3.63)#17,584 |
| 85. | Guilford Center | 6.3% | 7.9%(-1.63)#85 | 10.0%(-3.63)#17,586 |
| 86. | Lakeville | 6.2% | 7.9%(-1.70)#86 | 10.0%(-3.70)#17,680 |
| 87. | Newtown Borough | 6.2% | 7.9%(-1.76)#87 | 10.0%(-3.77)#17,795 |
| 88. | Lordship | 6.2% | 7.9%(-1.78)#88 | 10.0%(-3.78)#17,816 |
| 89. | Baltic | 6.1% | 7.9%(-1.80)#89 | 10.0%(-3.81)#17,857 |
| 90. | West Haven | 6.1% | 7.9%(-1.81)#90 | 10.0%(-3.81)#17,865 |
| 91. | Groton | 5.7% | 7.9%(-2.20)#91 | 10.0%(-4.21)#18,529 |
| 92. | Milford City Balance | 5.7% | 7.9%(-2.28)#92 | 10.0%(-4.28)#18,640 |
| 93. | Lake Bungee | 5.6% | 7.9%(-2.31)#93 | 10.0%(-4.32)#18,695 |
| 94. | Clinton | 5.5% | 7.9%(-2.42)#94 | 10.0%(-4.43)#18,889 |
| 95. | Westbrook Center | 5.5% | 7.9%(-2.45)#95 | 10.0%(-4.45)#18,939 |
| 96. | Oakville | 5.5% | 7.9%(-2.45)#96 | 10.0%(-4.46)#18,942 |
| 97. | Newington | 5.5% | 7.9%(-2.48)#97 | 10.0%(-4.48)#18,982 |
| 98. | South Coventry | 5.4% | 7.9%(-2.52)#98 | 10.0%(-4.53)#19,053 |
| 99. | Ridgefield | 5.4% | 7.9%(-2.57)#99 | 10.0%(-4.58)#19,141 |
| 100. | Coleytown | 5.3% | 7.9%(-2.64)#100 | 10.0%(-4.64)#19,240 |
1
2Common Questions
What are the Top 10 Cities with the Highest Poverty Level Among Seniors Over the Age of 65 in Connecticut?
Top 10 Cities with the Highest Poverty Level Among Seniors Over the Age of 65 in Connecticut are:
#1
27.8%
#2
27.2%
#3
26.6%
#4
25.4%
#5
21.5%
#6
20.0%
#7
19.7%
#8
19.0%
#9
18.2%
#10
16.9%
What city has the Highest Poverty Level Among Seniors Over the Age of 65 in Connecticut?
Putnam has the Highest Poverty Level Among Seniors Over the Age of 65 in Connecticut with 27.8%.
What is the Poverty Level Among Seniors Over the Age of 65 in the State of Connecticut?
Poverty Level Among Seniors Over the Age of 65 in Connecticut is 7.9%.
What is the Poverty Level Among Seniors Over the Age of 65 in the United States?
Poverty Level Among Seniors Over the Age of 65 in the United States is 10.0%.