Cities with the Highest Poverty Level Among Seniors Over the Age of 65 in Iowa
RELATED REPORTS & OPTIONS
Highest Poverty | Seniors 65+
Iowa
Compare Cities
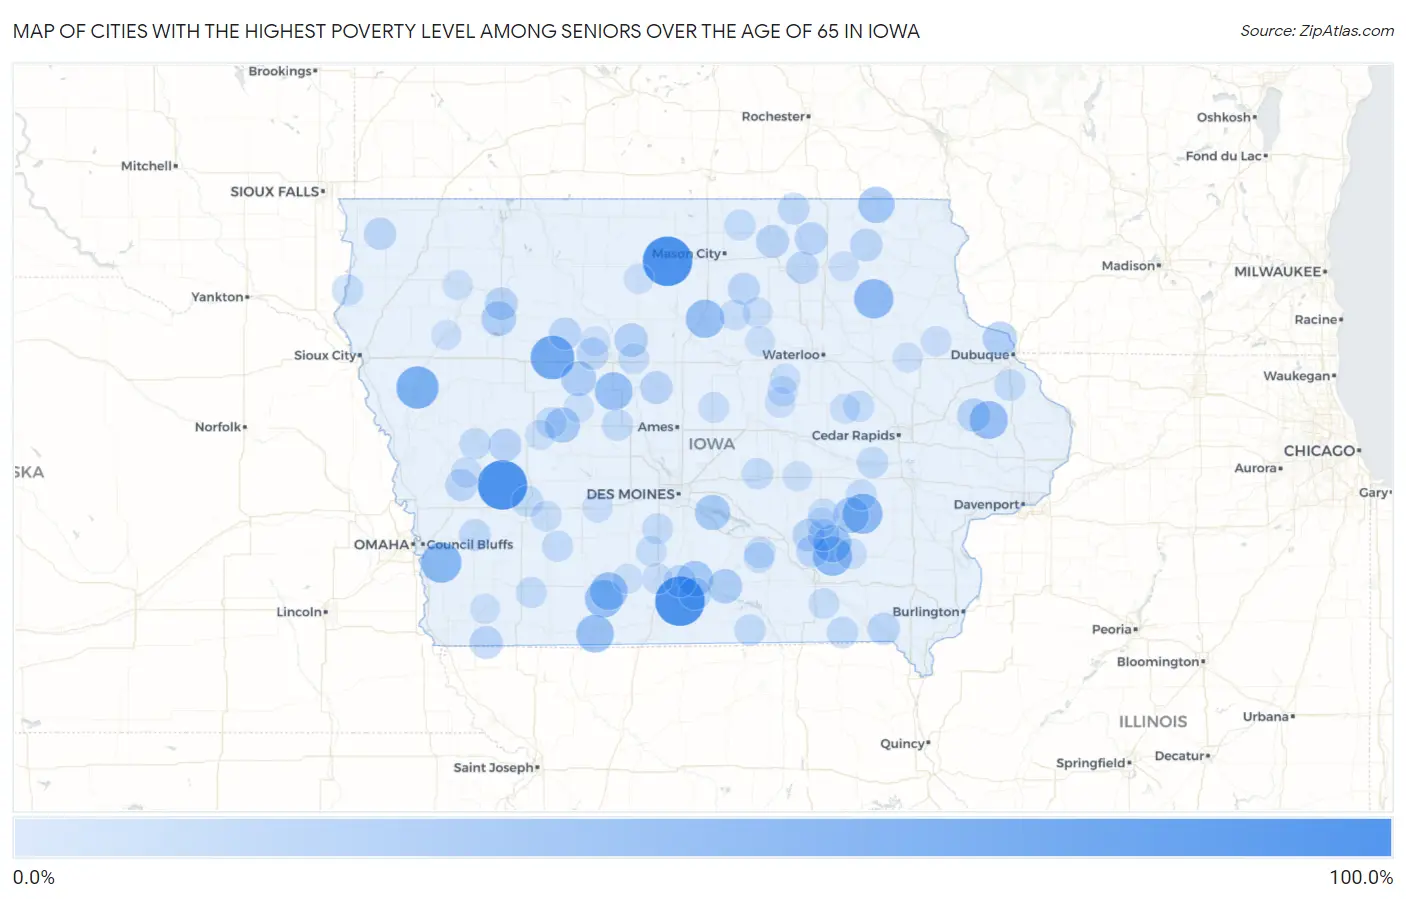
Map of Cities with the Highest Poverty Level Among Seniors Over the Age of 65 in Iowa
0.0%
100.0%
Cities with the Highest Poverty Level Among Seniors Over the Age of 65 in Iowa
| City | Senior Poverty | vs State | vs National | |
| 1. | Duncan | 100.0% | 7.7%(+92.3)#1 | 10.0%(+90.0)#127 |
| 2. | Le Roy | 100.0% | 7.7%(+92.3)#2 | 10.0%(+90.0)#208 |
| 3. | Jacksonville | 100.0% | 7.7%(+92.3)#3 | 10.0%(+90.0)#221 |
| 4. | Jolley | 75.0% | 7.7%(+67.3)#4 | 10.0%(+65.0)#318 |
| 5. | Fairport | 69.6% | 7.7%(+61.9)#5 | 10.0%(+59.6)#370 |
| 6. | Oto | 69.2% | 7.7%(+61.5)#6 | 10.0%(+59.3)#377 |
| 7. | Argyle | 66.7% | 7.7%(+59.0)#7 | 10.0%(+56.7)#417 |
| 8. | Mineola | 61.1% | 7.7%(+53.4)#8 | 10.0%(+51.2)#488 |
| 9. | Kinross | 59.1% | 7.7%(+51.4)#9 | 10.0%(+49.1)#527 |
| 10. | Randalia | 57.1% | 7.7%(+49.4)#10 | 10.0%(+47.2)#555 |
| 11. | Martinsburg | 56.0% | 7.7%(+48.3)#11 | 10.0%(+46.0)#590 |
| 12. | Coulter | 52.4% | 7.7%(+44.7)#12 | 10.0%(+42.4)#682 |
| 13. | Monmouth | 51.5% | 7.7%(+43.8)#13 | 10.0%(+41.6)#709 |
| 14. | Harcourt | 51.0% | 7.7%(+43.3)#14 | 10.0%(+41.0)#725 |
| 15. | Sperry | 50.0% | 7.7%(+42.3)#15 | 10.0%(+40.0)#779 |
| 16. | Shannon City | 50.0% | 7.7%(+42.3)#16 | 10.0%(+40.0)#783 |
| 17. | Arispe | 50.0% | 7.7%(+42.3)#17 | 10.0%(+40.0)#788 |
| 18. | Delphos | 50.0% | 7.7%(+42.3)#18 | 10.0%(+40.0)#802 |
| 19. | Hayesville | 48.6% | 7.7%(+40.9)#19 | 10.0%(+38.6)#841 |
| 20. | Burr Oak | 44.2% | 7.7%(+36.5)#20 | 10.0%(+34.2)#1,015 |
| 21. | Oak Hills | 43.5% | 7.7%(+35.8)#21 | 10.0%(+33.5)#1,054 |
| 22. | Lucas | 41.9% | 7.7%(+34.2)#22 | 10.0%(+32.0)#1,130 |
| 23. | South English | 41.3% | 7.7%(+33.6)#23 | 10.0%(+31.4)#1,160 |
| 24. | Ralston | 40.0% | 7.7%(+32.3)#24 | 10.0%(+30.0)#1,252 |
| 25. | Swan | 40.0% | 7.7%(+32.3)#25 | 10.0%(+30.0)#1,253 |
| 26. | Rinard | 38.9% | 7.7%(+31.2)#26 | 10.0%(+28.9)#1,327 |
| 27. | Truesdale | 37.5% | 7.7%(+29.8)#27 | 10.0%(+27.5)#1,415 |
| 28. | Russell | 36.5% | 7.7%(+28.8)#28 | 10.0%(+26.5)#1,501 |
| 29. | Sherrill | 35.9% | 7.7%(+28.2)#29 | 10.0%(+25.9)#1,553 |
| 30. | Vincent | 33.3% | 7.7%(+25.6)#30 | 10.0%(+23.4)#1,804 |
| 31. | Onslow | 32.0% | 7.7%(+24.3)#31 | 10.0%(+22.0)#1,935 |
| 32. | Orchard | 31.2% | 7.7%(+23.5)#32 | 10.0%(+21.3)#2,048 |
| 33. | Northboro | 30.8% | 7.7%(+23.1)#33 | 10.0%(+20.8)#2,101 |
| 34. | Aspinwall | 30.8% | 7.7%(+23.1)#34 | 10.0%(+20.8)#2,104 |
| 35. | Elma | 30.7% | 7.7%(+23.0)#35 | 10.0%(+20.8)#2,112 |
| 36. | Stanhope | 30.6% | 7.7%(+22.9)#36 | 10.0%(+20.7)#2,119 |
| 37. | Rembrandt | 30.6% | 7.7%(+22.9)#37 | 10.0%(+20.7)#2,124 |
| 38. | Rose Hill | 29.7% | 7.7%(+22.0)#38 | 10.0%(+19.8)#2,251 |
| 39. | Spillville | 29.5% | 7.7%(+21.8)#39 | 10.0%(+19.6)#2,281 |
| 40. | Fremont | 29.3% | 7.7%(+21.6)#40 | 10.0%(+19.4)#2,306 |
| 41. | Palmer | 28.6% | 7.7%(+20.9)#41 | 10.0%(+18.6)#2,448 |
| 42. | Derby | 28.6% | 7.7%(+20.9)#42 | 10.0%(+18.6)#2,450 |
| 43. | Doon | 28.3% | 7.7%(+20.6)#43 | 10.0%(+18.3)#2,495 |
| 44. | Bonaparte | 28.2% | 7.7%(+20.5)#44 | 10.0%(+18.2)#2,514 |
| 45. | Woodburn | 28.1% | 7.7%(+20.4)#45 | 10.0%(+18.2)#2,525 |
| 46. | Bassett | 28.1% | 7.7%(+20.4)#46 | 10.0%(+18.2)#2,526 |
| 47. | Barnum | 27.8% | 7.7%(+20.1)#47 | 10.0%(+17.8)#2,580 |
| 48. | Portsmouth | 27.8% | 7.7%(+20.1)#48 | 10.0%(+17.8)#2,582 |
| 49. | Dougherty | 27.8% | 7.7%(+20.1)#49 | 10.0%(+17.8)#2,591 |
| 50. | Delta | 27.5% | 7.7%(+19.7)#50 | 10.0%(+17.5)#2,652 |
| 51. | Oakland | 26.3% | 7.7%(+18.6)#51 | 10.0%(+16.4)#2,851 |
| 52. | Mcintire | 25.9% | 7.7%(+18.2)#52 | 10.0%(+16.0)#2,927 |
| 53. | Milton | 25.6% | 7.7%(+17.8)#53 | 10.0%(+15.6)#3,022 |
| 54. | Middle Amana | 25.4% | 7.7%(+17.7)#54 | 10.0%(+15.5)#3,058 |
| 55. | Brayton | 25.0% | 7.7%(+17.3)#55 | 10.0%(+15.0)#3,199 |
| 56. | Chatsworth | 25.0% | 7.7%(+17.3)#56 | 10.0%(+15.0)#3,212 |
| 57. | Zwingle | 25.0% | 7.7%(+17.3)#57 | 10.0%(+15.0)#3,214 |
| 58. | Beaver | 25.0% | 7.7%(+17.3)#58 | 10.0%(+15.0)#3,220 |
| 59. | Numa | 25.0% | 7.7%(+17.3)#59 | 10.0%(+15.0)#3,221 |
| 60. | Buck Grove | 25.0% | 7.7%(+17.3)#60 | 10.0%(+15.0)#3,228 |
| 61. | Kellogg | 24.3% | 7.7%(+16.6)#61 | 10.0%(+14.4)#3,350 |
| 62. | Grafton | 24.0% | 7.7%(+16.3)#62 | 10.0%(+14.0)#3,448 |
| 63. | Nodaway | 24.0% | 7.7%(+16.3)#63 | 10.0%(+14.0)#3,452 |
| 64. | Bussey | 23.9% | 7.7%(+16.2)#64 | 10.0%(+13.9)#3,477 |
| 65. | Vinton | 23.8% | 7.7%(+16.1)#65 | 10.0%(+13.9)#3,480 |
| 66. | Bridgewater | 23.8% | 7.7%(+16.1)#66 | 10.0%(+13.9)#3,495 |
| 67. | Glidden | 23.7% | 7.7%(+16.0)#67 | 10.0%(+13.8)#3,510 |
| 68. | Parnell | 23.3% | 7.7%(+15.6)#68 | 10.0%(+13.4)#3,621 |
| 69. | Bevington | 23.1% | 7.7%(+15.4)#69 | 10.0%(+13.1)#3,720 |
| 70. | Zearing | 22.9% | 7.7%(+15.2)#70 | 10.0%(+12.9)#3,758 |
| 71. | Anita | 22.8% | 7.7%(+15.1)#71 | 10.0%(+12.9)#3,784 |
| 72. | Ollie | 22.7% | 7.7%(+15.0)#72 | 10.0%(+12.8)#3,812 |
| 73. | Hansell | 22.7% | 7.7%(+15.0)#73 | 10.0%(+12.8)#3,814 |
| 74. | Osceola | 22.5% | 7.7%(+14.8)#74 | 10.0%(+12.6)#3,864 |
| 75. | Floris | 22.2% | 7.7%(+14.5)#75 | 10.0%(+12.3)#3,948 |
| 76. | Hamilton | 22.2% | 7.7%(+14.5)#76 | 10.0%(+12.3)#3,961 |
| 77. | Duncombe | 22.0% | 7.7%(+14.2)#77 | 10.0%(+12.0)#4,033 |
| 78. | Panama | 22.0% | 7.7%(+14.2)#78 | 10.0%(+12.0)#4,036 |
| 79. | Truro | 21.7% | 7.7%(+14.0)#79 | 10.0%(+11.8)#4,090 |
| 80. | Thornburg | 21.7% | 7.7%(+14.0)#80 | 10.0%(+11.8)#4,097 |
| 81. | Lawler | 21.2% | 7.7%(+13.5)#81 | 10.0%(+11.3)#4,257 |
| 82. | Gladbrook | 21.2% | 7.7%(+13.5)#82 | 10.0%(+11.2)#4,272 |
| 83. | Stuart | 21.1% | 7.7%(+13.4)#83 | 10.0%(+11.2)#4,287 |
| 84. | Morrison | 21.1% | 7.7%(+13.3)#84 | 10.0%(+11.1)#4,321 |
| 85. | Lincoln | 20.8% | 7.7%(+13.1)#85 | 10.0%(+10.9)#4,397 |
| 86. | Greeley | 20.7% | 7.7%(+13.0)#86 | 10.0%(+10.7)#4,451 |
| 87. | Bristow | 20.7% | 7.7%(+13.0)#87 | 10.0%(+10.7)#4,455 |
| 88. | Churdan | 20.3% | 7.7%(+12.6)#88 | 10.0%(+10.3)#4,613 |
| 89. | Garrison | 20.3% | 7.7%(+12.6)#89 | 10.0%(+10.3)#4,614 |
| 90. | Quimby | 20.2% | 7.7%(+12.5)#90 | 10.0%(+10.3)#4,634 |
| 91. | Malcom | 20.0% | 7.7%(+12.3)#91 | 10.0%(+10.0)#4,736 |
| 92. | Corwith | 20.0% | 7.7%(+12.3)#92 | 10.0%(+10.0)#4,740 |
| 93. | Calumet | 20.0% | 7.7%(+12.3)#93 | 10.0%(+10.0)#4,749 |
| 94. | Clare | 20.0% | 7.7%(+12.3)#94 | 10.0%(+10.0)#4,752 |
| 95. | Willey | 20.0% | 7.7%(+12.3)#95 | 10.0%(+10.0)#4,759 |
| 96. | Masonville | 20.0% | 7.7%(+12.3)#96 | 10.0%(+10.0)#4,778 |
| 97. | Thayer | 20.0% | 7.7%(+12.3)#97 | 10.0%(+10.0)#4,786 |
| 98. | What Cheer | 19.8% | 7.7%(+12.1)#98 | 10.0%(+9.88)#4,846 |
| 99. | Essex | 19.8% | 7.7%(+12.1)#99 | 10.0%(+9.87)#4,850 |
| 100. | Aplington | 19.6% | 7.7%(+11.9)#100 | 10.0%(+9.69)#4,929 |
Common Questions
What are the Top 10 Cities with the Highest Poverty Level Among Seniors Over the Age of 65 in Iowa?
Top 10 Cities with the Highest Poverty Level Among Seniors Over the Age of 65 in Iowa are:
#1
100.0%
#2
100.0%
#3
100.0%
#4
75.0%
#5
69.2%
#6
61.1%
#7
59.1%
#8
57.1%
#9
56.0%
#10
52.4%
What city has the Highest Poverty Level Among Seniors Over the Age of 65 in Iowa?
Duncan has the Highest Poverty Level Among Seniors Over the Age of 65 in Iowa with 100.0%.
What is the Poverty Level Among Seniors Over the Age of 65 in the State of Iowa?
Poverty Level Among Seniors Over the Age of 65 in Iowa is 7.7%.
What is the Poverty Level Among Seniors Over the Age of 65 in the United States?
Poverty Level Among Seniors Over the Age of 65 in the United States is 10.0%.