Cities with the Highest Poverty Level Among Seniors Over the Age of 65 in Ohio
RELATED REPORTS & OPTIONS
Highest Poverty | Seniors 65+
Ohio
Compare Cities
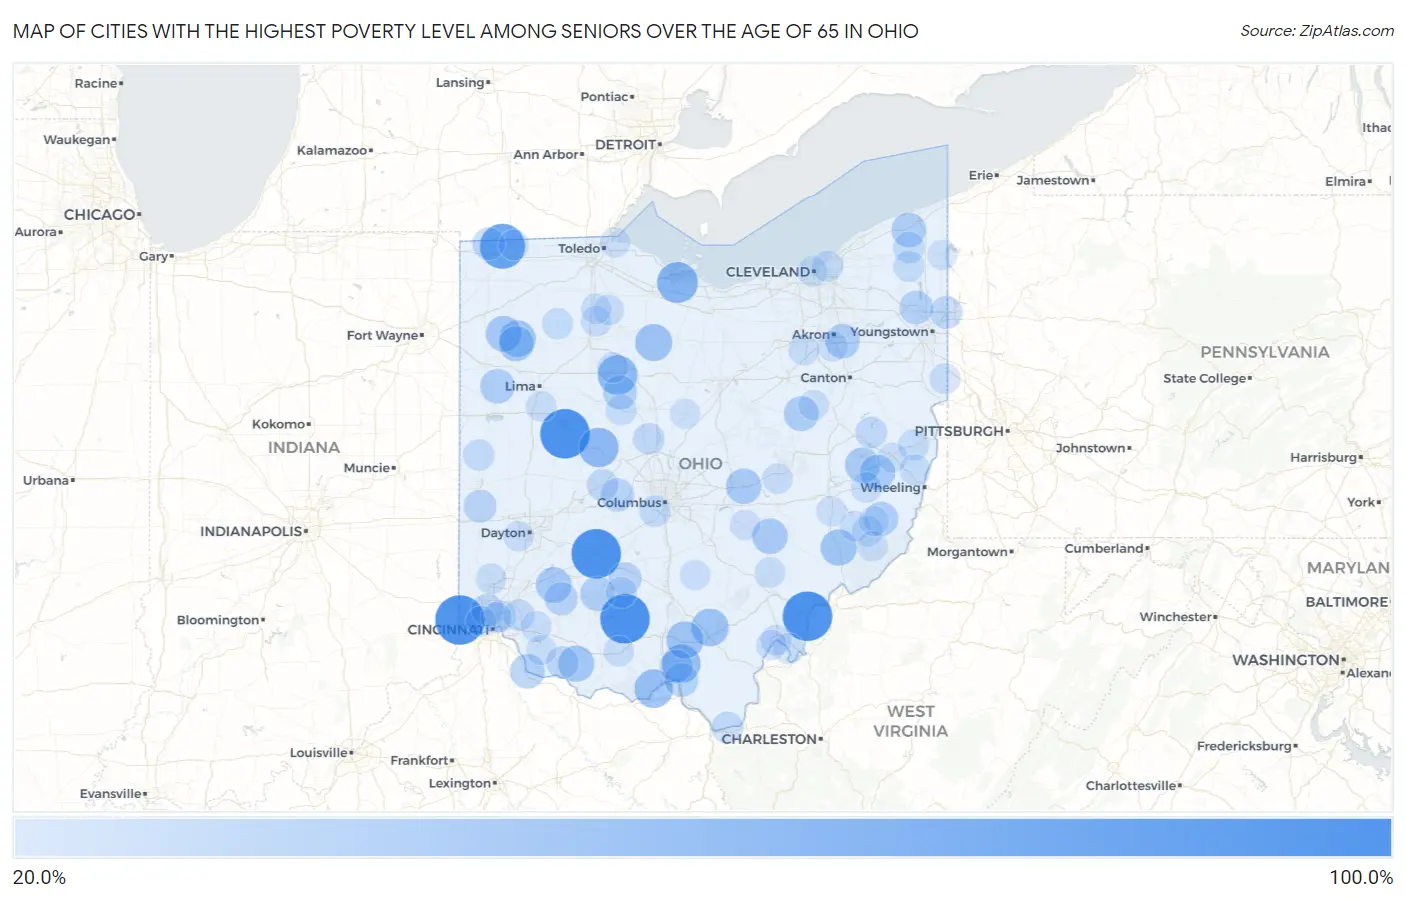
Map of Cities with the Highest Poverty Level Among Seniors Over the Age of 65 in Ohio
0.0%
100.0%
Cities with the Highest Poverty Level Among Seniors Over the Age of 65 in Ohio
| City | Senior Poverty | vs State | vs National | |
| 1. | Elizabethtown | 100.0% | 9.1%(+90.9)#1 | 10.0%(+90.0)#52 |
| 2. | Lewistown | 100.0% | 9.1%(+90.9)#2 | 10.0%(+90.0)#93 |
| 3. | East Alliance | 100.0% | 9.1%(+90.9)#3 | 10.0%(+90.0)#104 |
| 4. | Hockingport | 100.0% | 9.1%(+90.9)#4 | 10.0%(+90.0)#153 |
| 5. | Octa | 100.0% | 9.1%(+90.9)#5 | 10.0%(+90.0)#163 |
| 6. | Cynthiana | 100.0% | 9.1%(+90.9)#6 | 10.0%(+90.0)#192 |
| 7. | Alvordton | 82.1% | 9.1%(+73.0)#7 | 10.0%(+72.1)#269 |
| 8. | New Haven Cdp Huron County | 66.7% | 9.1%(+57.6)#8 | 10.0%(+56.7)#407 |
| 9. | Whites Landing | 64.6% | 9.1%(+55.5)#9 | 10.0%(+54.6)#448 |
| 10. | Kirby | 60.0% | 9.1%(+50.9)#10 | 10.0%(+50.0)#511 |
| 11. | East Liberty | 59.6% | 9.1%(+50.5)#11 | 10.0%(+49.6)#520 |
| 12. | Friendship | 55.6% | 9.1%(+46.5)#12 | 10.0%(+45.6)#598 |
| 13. | Minford | 55.1% | 9.1%(+46.1)#13 | 10.0%(+45.2)#610 |
| 14. | Coalton | 51.4% | 9.1%(+42.3)#14 | 10.0%(+41.4)#713 |
| 15. | Beaver | 50.0% | 9.1%(+40.9)#15 | 10.0%(+40.0)#745 |
| 16. | Melmore | 50.0% | 9.1%(+40.9)#16 | 10.0%(+40.0)#785 |
| 17. | Dupont | 47.9% | 9.1%(+38.8)#17 | 10.0%(+37.9)#862 |
| 18. | Bolton | 47.9% | 9.1%(+38.8)#18 | 10.0%(+37.9)#864 |
| 19. | Dexter City | 46.7% | 9.1%(+37.6)#19 | 10.0%(+36.7)#912 |
| 20. | Russellville | 46.0% | 9.1%(+37.0)#20 | 10.0%(+36.1)#935 |
| 21. | Melrose | 44.7% | 9.1%(+35.7)#21 | 10.0%(+34.8)#988 |
| 22. | South Mount Vernon | 44.6% | 9.1%(+35.6)#22 | 10.0%(+34.7)#991 |
| 23. | Clarksville | 43.9% | 9.1%(+34.8)#23 | 10.0%(+34.0)#1,027 |
| 24. | Rose Farm | 43.5% | 9.1%(+34.4)#24 | 10.0%(+33.5)#1,055 |
| 25. | Marne | 43.0% | 9.1%(+34.0)#25 | 10.0%(+33.1)#1,072 |
| 26. | Cloverdale | 42.3% | 9.1%(+33.2)#26 | 10.0%(+32.4)#1,106 |
| 27. | Freeport | 42.0% | 9.1%(+32.9)#27 | 10.0%(+32.0)#1,125 |
| 28. | Holloway | 41.9% | 9.1%(+32.9)#28 | 10.0%(+32.0)#1,129 |
| 29. | Berlin | 41.0% | 9.1%(+32.0)#29 | 10.0%(+31.1)#1,183 |
| 30. | Highland | 40.0% | 9.1%(+30.9)#30 | 10.0%(+30.0)#1,243 |
| 31. | Elgin | 40.0% | 9.1%(+30.9)#31 | 10.0%(+30.0)#1,247 |
| 32. | Neville | 40.0% | 9.1%(+30.9)#32 | 10.0%(+30.0)#1,251 |
| 33. | Austinburg | 39.9% | 9.1%(+30.8)#33 | 10.0%(+29.9)#1,268 |
| 34. | Sawyerwood | 39.7% | 9.1%(+30.7)#34 | 10.0%(+29.8)#1,275 |
| 35. | Jerusalem | 38.2% | 9.1%(+29.2)#35 | 10.0%(+28.3)#1,365 |
| 36. | Marseilles | 37.5% | 9.1%(+28.4)#36 | 10.0%(+27.5)#1,417 |
| 37. | Sciotodale | 36.7% | 9.1%(+27.6)#37 | 10.0%(+26.7)#1,491 |
| 38. | Morgandale | 36.4% | 9.1%(+27.3)#38 | 10.0%(+26.4)#1,506 |
| 39. | Midland | 34.6% | 9.1%(+25.6)#39 | 10.0%(+24.7)#1,662 |
| 40. | Plumwood | 34.6% | 9.1%(+25.6)#40 | 10.0%(+24.7)#1,663 |
| 41. | Clarktown | 34.1% | 9.1%(+25.1)#41 | 10.0%(+24.2)#1,709 |
| 42. | Good Hope | 33.8% | 9.1%(+24.8)#42 | 10.0%(+23.9)#1,722 |
| 43. | Castine | 33.3% | 9.1%(+24.3)#43 | 10.0%(+23.4)#1,802 |
| 44. | West Hill | 32.4% | 9.1%(+23.4)#44 | 10.0%(+22.5)#1,892 |
| 45. | Pioneer | 32.3% | 9.1%(+23.2)#45 | 10.0%(+22.3)#1,904 |
| 46. | Skyline Acres | 31.7% | 9.1%(+22.6)#46 | 10.0%(+21.7)#1,989 |
| 47. | Roachester | 31.6% | 9.1%(+22.5)#47 | 10.0%(+21.6)#1,999 |
| 48. | Georgetown | 30.9% | 9.1%(+21.8)#48 | 10.0%(+21.0)#2,085 |
| 49. | Mechanicsburg | 29.3% | 9.1%(+20.3)#49 | 10.0%(+19.4)#2,308 |
| 50. | Bowerston | 29.0% | 9.1%(+19.9)#50 | 10.0%(+19.0)#2,357 |
| 51. | Chesapeake | 28.9% | 9.1%(+19.8)#51 | 10.0%(+18.9)#2,371 |
| 52. | Radnor | 28.8% | 9.1%(+19.8)#52 | 10.0%(+18.9)#2,389 |
| 53. | Golf Manor | 28.6% | 9.1%(+19.6)#53 | 10.0%(+18.7)#2,415 |
| 54. | Rossburg | 28.6% | 9.1%(+19.5)#54 | 10.0%(+18.6)#2,438 |
| 55. | Camp Dennison | 28.2% | 9.1%(+19.1)#55 | 10.0%(+18.3)#2,507 |
| 56. | Rock Creek | 28.0% | 9.1%(+19.0)#56 | 10.0%(+18.1)#2,535 |
| 57. | Urbancrest | 28.0% | 9.1%(+18.9)#57 | 10.0%(+18.0)#2,541 |
| 58. | Greenfield | 27.0% | 9.1%(+18.0)#58 | 10.0%(+17.1)#2,725 |
| 59. | Bloomingdale | 26.7% | 9.1%(+17.6)#59 | 10.0%(+16.7)#2,786 |
| 60. | Belmore | 26.7% | 9.1%(+17.6)#60 | 10.0%(+16.7)#2,787 |
| 61. | Orwell | 26.5% | 9.1%(+17.5)#61 | 10.0%(+16.6)#2,813 |
| 62. | East Cleveland | 26.4% | 9.1%(+17.4)#62 | 10.0%(+16.5)#2,834 |
| 63. | Mount Pleasant | 26.2% | 9.1%(+17.1)#63 | 10.0%(+16.2)#2,890 |
| 64. | Rittman | 25.7% | 9.1%(+16.6)#64 | 10.0%(+15.7)#2,990 |
| 65. | Marathon | 25.5% | 9.1%(+16.5)#65 | 10.0%(+15.6)#3,033 |
| 66. | Williamsdale | 25.5% | 9.1%(+16.4)#66 | 10.0%(+15.5)#3,040 |
| 67. | Elmwood Place | 25.3% | 9.1%(+16.3)#67 | 10.0%(+15.4)#3,088 |
| 68. | La Rue | 25.3% | 9.1%(+16.3)#68 | 10.0%(+15.4)#3,089 |
| 69. | Racine | 25.3% | 9.1%(+16.2)#69 | 10.0%(+15.3)#3,102 |
| 70. | Peebles | 25.1% | 9.1%(+16.0)#70 | 10.0%(+15.2)#3,129 |
| 71. | Trimble | 25.0% | 9.1%(+15.9)#71 | 10.0%(+15.0)#3,159 |
| 72. | Wharton | 25.0% | 9.1%(+15.9)#72 | 10.0%(+15.0)#3,162 |
| 73. | Uniopolis | 25.0% | 9.1%(+15.9)#73 | 10.0%(+15.0)#3,168 |
| 74. | Negley | 25.0% | 9.1%(+15.9)#74 | 10.0%(+15.0)#3,170 |
| 75. | Lewisville | 25.0% | 9.1%(+15.9)#75 | 10.0%(+15.0)#3,184 |
| 76. | West Millgrove | 25.0% | 9.1%(+15.9)#76 | 10.0%(+15.0)#3,195 |
| 77. | Bairdstown | 25.0% | 9.1%(+15.9)#77 | 10.0%(+15.0)#3,196 |
| 78. | Fairview | 25.0% | 9.1%(+15.9)#78 | 10.0%(+15.0)#3,226 |
| 79. | Pomeroy | 24.9% | 9.1%(+15.8)#79 | 10.0%(+14.9)#3,240 |
| 80. | Dresden | 24.8% | 9.1%(+15.7)#80 | 10.0%(+14.8)#3,259 |
| 81. | Owensville | 24.7% | 9.1%(+15.6)#81 | 10.0%(+14.7)#3,270 |
| 82. | Fayette | 24.5% | 9.1%(+15.4)#82 | 10.0%(+14.5)#3,307 |
| 83. | Cheviot | 24.4% | 9.1%(+15.3)#83 | 10.0%(+14.5)#3,334 |
| 84. | Somerset | 24.2% | 9.1%(+15.2)#84 | 10.0%(+14.3)#3,387 |
| 85. | Drexel | 24.2% | 9.1%(+15.2)#85 | 10.0%(+14.3)#3,389 |
| 86. | Jerry City | 24.1% | 9.1%(+15.1)#86 | 10.0%(+14.2)#3,412 |
| 87. | Summerfield | 24.1% | 9.1%(+15.1)#87 | 10.0%(+14.2)#3,416 |
| 88. | Laurelville | 24.1% | 9.1%(+15.0)#88 | 10.0%(+14.2)#3,426 |
| 89. | Middleport | 24.0% | 9.1%(+14.9)#89 | 10.0%(+14.0)#3,461 |
| 90. | Winesburg | 23.9% | 9.1%(+14.8)#90 | 10.0%(+13.9)#3,475 |
| 91. | Portage Lakes | 23.9% | 9.1%(+14.8)#91 | 10.0%(+13.9)#3,478 |
| 92. | Graysville | 23.8% | 9.1%(+14.7)#92 | 10.0%(+13.9)#3,498 |
| 93. | Cleveland | 23.7% | 9.1%(+14.6)#93 | 10.0%(+13.7)#3,516 |
| 94. | Bethel | 23.5% | 9.1%(+14.5)#94 | 10.0%(+13.6)#3,560 |
| 95. | Pleasant City | 23.4% | 9.1%(+14.3)#95 | 10.0%(+13.5)#3,605 |
| 96. | Mount Gilead | 23.3% | 9.1%(+14.2)#96 | 10.0%(+13.3)#3,642 |
| 97. | Harbor View | 23.1% | 9.1%(+14.0)#97 | 10.0%(+13.1)#3,708 |
| 98. | Miltonsburg | 23.1% | 9.1%(+14.0)#98 | 10.0%(+13.1)#3,716 |
| 99. | Andover | 22.9% | 9.1%(+13.8)#99 | 10.0%(+12.9)#3,767 |
| 100. | Cadiz | 22.8% | 9.1%(+13.8)#100 | 10.0%(+12.9)#3,785 |
Common Questions
What are the Top 10 Cities with the Highest Poverty Level Among Seniors Over the Age of 65 in Ohio?
Top 10 Cities with the Highest Poverty Level Among Seniors Over the Age of 65 in Ohio are:
#1
100.0%
#2
100.0%
#3
100.0%
#4
100.0%
#5
100.0%
#6
82.1%
#7
64.6%
#8
60.0%
#9
59.6%
#10
55.6%
What city has the Highest Poverty Level Among Seniors Over the Age of 65 in Ohio?
Elizabethtown has the Highest Poverty Level Among Seniors Over the Age of 65 in Ohio with 100.0%.
What is the Poverty Level Among Seniors Over the Age of 65 in the State of Ohio?
Poverty Level Among Seniors Over the Age of 65 in Ohio is 9.1%.
What is the Poverty Level Among Seniors Over the Age of 65 in the United States?
Poverty Level Among Seniors Over the Age of 65 in the United States is 10.0%.