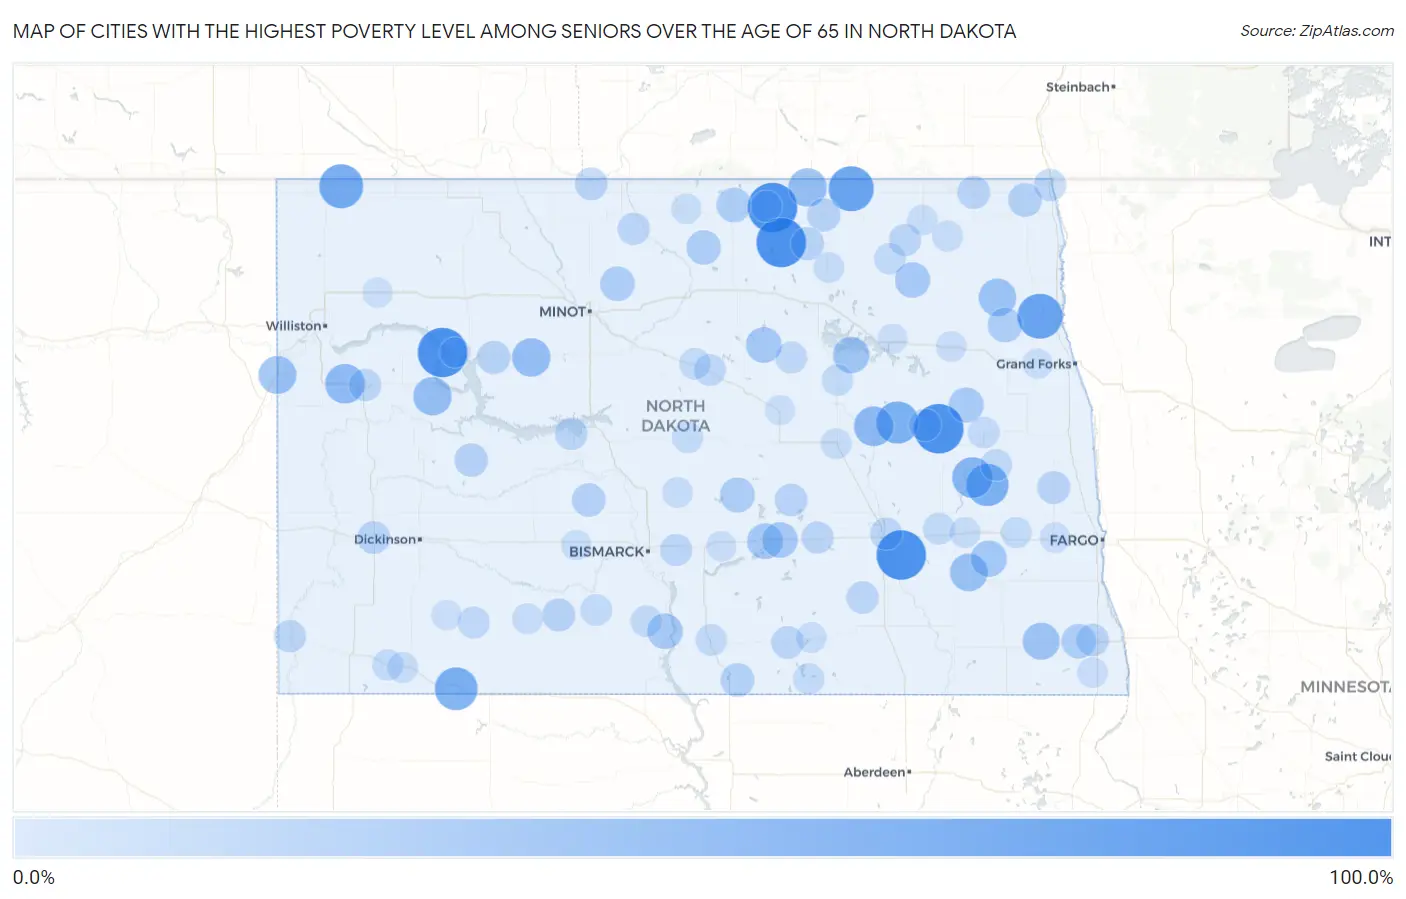
Cities with the Highest Poverty Level Among Seniors Over the Age of 65 in North Dakota
RELATED REPORTS & OPTIONS
Highest Poverty | Seniors 65+
North Dakota
Compare Cities
Map of Cities with the Highest Poverty Level Among Seniors Over the Age of 65 in North Dakota
0.0%
100.0%
Cities with the Highest Poverty Level Among Seniors Over the Age of 65 in North Dakota
| City | Senior Poverty | vs State | vs National | |
| 1. | Green Acres | 100.0% | 9.1%(+90.9)#1 | 10.0%(+90.0)#13 |
| 2. | Four Bears Village | 100.0% | 9.1%(+90.9)#2 | 10.0%(+90.0)#58 |
| 3. | Jessie | 100.0% | 9.1%(+90.9)#3 | 10.0%(+90.0)#158 |
| 4. | Mylo | 100.0% | 9.1%(+90.9)#4 | 10.0%(+90.0)#209 |
| 5. | Ypsilanti | 100.0% | 9.1%(+90.9)#5 | 10.0%(+90.0)#212 |
| 6. | Ardoch | 80.0% | 9.1%(+70.9)#6 | 10.0%(+70.0)#278 |
| 7. | Sarles | 80.0% | 9.1%(+70.9)#7 | 10.0%(+70.0)#279 |
| 8. | Ambrose | 75.0% | 9.1%(+65.9)#8 | 10.0%(+65.0)#317 |
| 9. | Haynes | 69.2% | 9.1%(+60.1)#9 | 10.0%(+59.3)#378 |
| 10. | Mchenry | 66.7% | 9.1%(+57.6)#10 | 10.0%(+56.7)#416 |
| 11. | Pillsbury | 66.7% | 9.1%(+57.6)#11 | 10.0%(+56.7)#420 |
| 12. | Luverne | 60.0% | 9.1%(+50.9)#12 | 10.0%(+50.0)#513 |
| 13. | Grace City | 55.6% | 9.1%(+46.4)#13 | 10.0%(+45.6)#605 |
| 14. | Arnegard | 55.0% | 9.1%(+45.9)#14 | 10.0%(+45.0)#613 |
| 15. | Mandaree | 50.0% | 9.1%(+40.9)#15 | 10.0%(+40.0)#738 |
| 16. | Makoti | 50.0% | 9.1%(+40.9)#16 | 10.0%(+40.0)#784 |
| 17. | Hansboro | 50.0% | 9.1%(+40.9)#17 | 10.0%(+40.0)#804 |
| 18. | East Fairview | 47.4% | 9.1%(+38.3)#18 | 10.0%(+37.5)#878 |
| 19. | Kathryn | 46.7% | 9.1%(+37.6)#19 | 10.0%(+36.7)#913 |
| 20. | Pisek | 45.9% | 9.1%(+36.8)#20 | 10.0%(+36.0)#941 |
| 21. | De Lamere | 43.8% | 9.1%(+34.6)#21 | 10.0%(+33.8)#1,041 |
| 22. | Fort Totten | 41.2% | 9.1%(+32.1)#22 | 10.0%(+31.2)#1,170 |
| 23. | Fingal | 40.0% | 9.1%(+30.9)#23 | 10.0%(+30.0)#1,242 |
| 24. | Dawson | 38.5% | 9.1%(+29.3)#24 | 10.0%(+28.5)#1,358 |
| 25. | Esmond | 38.2% | 9.1%(+29.1)#25 | 10.0%(+28.3)#1,366 |
| 26. | Tappen | 37.5% | 9.1%(+28.4)#26 | 10.0%(+27.5)#1,411 |
| 27. | Cannon Ball | 36.8% | 9.1%(+27.7)#27 | 10.0%(+26.9)#1,469 |
| 28. | Edmore | 36.7% | 9.1%(+27.6)#28 | 10.0%(+26.8)#1,484 |
| 29. | Aneta | 35.3% | 9.1%(+26.2)#29 | 10.0%(+25.3)#1,620 |
| 30. | Tuttle | 34.6% | 9.1%(+25.5)#30 | 10.0%(+24.7)#1,668 |
| 31. | East Dunseith | 33.3% | 9.1%(+24.2)#31 | 10.0%(+23.4)#1,764 |
| 32. | Deering | 33.3% | 9.1%(+24.2)#32 | 10.0%(+23.4)#1,807 |
| 33. | Barney | 33.3% | 9.1%(+24.2)#33 | 10.0%(+23.4)#1,823 |
| 34. | Inkster | 33.3% | 9.1%(+24.2)#34 | 10.0%(+23.4)#1,834 |
| 35. | Willow City | 32.4% | 9.1%(+23.2)#35 | 10.0%(+22.4)#1,902 |
| 36. | Hague | 30.0% | 9.1%(+20.9)#36 | 10.0%(+20.0)#2,205 |
| 37. | Bathgate | 29.4% | 9.1%(+20.3)#37 | 10.0%(+19.5)#2,300 |
| 38. | Center | 28.6% | 9.1%(+19.5)#38 | 10.0%(+18.6)#2,426 |
| 39. | Halliday | 27.9% | 9.1%(+18.8)#39 | 10.0%(+18.0)#2,560 |
| 40. | Parshall | 27.3% | 9.1%(+18.2)#40 | 10.0%(+17.3)#2,672 |
| 41. | Rocklake | 27.3% | 9.1%(+18.2)#41 | 10.0%(+17.3)#2,686 |
| 42. | Bisbee | 26.7% | 9.1%(+17.6)#42 | 10.0%(+16.7)#2,789 |
| 43. | Carson | 26.5% | 9.1%(+17.4)#43 | 10.0%(+16.5)#2,827 |
| 44. | Hunter | 26.1% | 9.1%(+17.0)#44 | 10.0%(+16.1)#2,906 |
| 45. | Walhalla | 25.7% | 9.1%(+16.6)#45 | 10.0%(+15.7)#2,984 |
| 46. | Belfield | 25.3% | 9.1%(+16.2)#46 | 10.0%(+15.4)#3,086 |
| 47. | Mooreton | 25.0% | 9.1%(+15.9)#47 | 10.0%(+15.0)#3,189 |
| 48. | Pettibone | 25.0% | 9.1%(+15.9)#48 | 10.0%(+15.0)#3,218 |
| 49. | Antler | 25.0% | 9.1%(+15.9)#49 | 10.0%(+15.0)#3,236 |
| 50. | Wishek | 24.8% | 9.1%(+15.7)#50 | 10.0%(+14.8)#3,260 |
| 51. | Watford City | 24.0% | 9.1%(+14.9)#51 | 10.0%(+14.1)#3,436 |
| 52. | Pick City | 23.8% | 9.1%(+14.7)#52 | 10.0%(+13.9)#3,496 |
| 53. | Jud | 23.5% | 9.1%(+14.4)#53 | 10.0%(+13.6)#3,578 |
| 54. | Binford | 23.4% | 9.1%(+14.3)#54 | 10.0%(+13.5)#3,608 |
| 55. | Medina | 23.1% | 9.1%(+14.0)#55 | 10.0%(+13.1)#3,703 |
| 56. | Marmarth | 23.1% | 9.1%(+14.0)#56 | 10.0%(+13.1)#3,711 |
| 57. | Newburg | 23.1% | 9.1%(+14.0)#57 | 10.0%(+13.1)#3,715 |
| 58. | Loma | 23.1% | 9.1%(+14.0)#58 | 10.0%(+13.1)#3,719 |
| 59. | Pembina | 22.9% | 9.1%(+13.8)#59 | 10.0%(+12.9)#3,762 |
| 60. | Jamestown | 22.8% | 9.1%(+13.7)#60 | 10.0%(+12.9)#3,782 |
| 61. | Menoken | 22.2% | 9.1%(+13.1)#61 | 10.0%(+12.3)#3,966 |
| 62. | Mott | 22.0% | 9.1%(+12.9)#62 | 10.0%(+12.1)#4,008 |
| 63. | Anamoose | 21.6% | 9.1%(+12.5)#63 | 10.0%(+11.6)#4,137 |
| 64. | Hope | 21.3% | 9.1%(+12.2)#64 | 10.0%(+11.4)#4,228 |
| 65. | Maddock | 21.1% | 9.1%(+12.0)#65 | 10.0%(+11.2)#4,285 |
| 66. | Sanborn | 20.7% | 9.1%(+11.6)#66 | 10.0%(+10.7)#4,457 |
| 67. | Drake | 20.6% | 9.1%(+11.5)#67 | 10.0%(+10.7)#4,475 |
| 68. | Finley | 20.6% | 9.1%(+11.5)#68 | 10.0%(+10.7)#4,479 |
| 69. | Flasher | 20.4% | 9.1%(+11.3)#69 | 10.0%(+10.4)#4,573 |
| 70. | Sheyenne | 20.3% | 9.1%(+11.2)#70 | 10.0%(+10.3)#4,615 |
| 71. | Solen | 20.0% | 9.1%(+10.9)#71 | 10.0%(+10.0)#4,777 |
| 72. | Hampden | 20.0% | 9.1%(+10.9)#72 | 10.0%(+10.0)#4,792 |
| 73. | Linton | 19.9% | 9.1%(+10.8)#73 | 10.0%(+9.98)#4,809 |
| 74. | Belcourt | 19.2% | 9.1%(+10.1)#74 | 10.0%(+9.28)#5,099 |
| 75. | Mcclusky | 18.9% | 9.1%(+9.75)#75 | 10.0%(+8.92)#5,261 |
| 76. | Ashley | 18.2% | 9.1%(+9.11)#76 | 10.0%(+8.27)#5,544 |
| 77. | Buffalo | 18.2% | 9.1%(+9.07)#77 | 10.0%(+8.23)#5,583 |
| 78. | Gascoyne | 18.2% | 9.1%(+9.07)#78 | 10.0%(+8.23)#5,598 |
| 79. | Trenton | 17.9% | 9.1%(+8.83)#79 | 10.0%(+8.00)#5,686 |
| 80. | Elgin | 17.5% | 9.1%(+8.35)#80 | 10.0%(+7.52)#5,952 |
| 81. | Osnabrock | 17.1% | 9.1%(+8.03)#81 | 10.0%(+7.19)#6,150 |
| 82. | Reeder | 17.1% | 9.1%(+7.96)#82 | 10.0%(+7.12)#6,186 |
| 83. | Carrington | 17.0% | 9.1%(+7.92)#83 | 10.0%(+7.08)#6,199 |
| 84. | Valley City | 16.9% | 9.1%(+7.75)#84 | 10.0%(+6.91)#6,303 |
| 85. | Cando | 16.8% | 9.1%(+7.73)#85 | 10.0%(+6.90)#6,312 |
| 86. | Regan | 16.7% | 9.1%(+7.55)#86 | 10.0%(+6.71)#6,447 |
| 87. | Lehr | 16.7% | 9.1%(+7.55)#87 | 10.0%(+6.71)#6,454 |
| 88. | Hankinson | 16.1% | 9.1%(+6.99)#88 | 10.0%(+6.16)#6,768 |
| 89. | Casselton | 15.9% | 9.1%(+6.78)#89 | 10.0%(+5.94)#6,910 |
| 90. | Langdon | 15.9% | 9.1%(+6.77)#90 | 10.0%(+5.94)#6,912 |
| 91. | Michigan City | 15.7% | 9.1%(+6.57)#91 | 10.0%(+5.73)#7,033 |
| 92. | Driscoll | 15.6% | 9.1%(+6.51)#92 | 10.0%(+5.67)#7,082 |
| 93. | New Town | 15.4% | 9.1%(+6.27)#93 | 10.0%(+5.43)#7,216 |
| 94. | Bottineau | 15.4% | 9.1%(+6.27)#94 | 10.0%(+5.43)#7,217 |
| 95. | New Salem | 15.4% | 9.1%(+6.27)#95 | 10.0%(+5.43)#7,223 |
| 96. | Emerado | 15.0% | 9.1%(+5.88)#96 | 10.0%(+5.05)#7,498 |
| 97. | Ray | 14.7% | 9.1%(+5.63)#97 | 10.0%(+4.79)#7,680 |
| 98. | Regent | 14.7% | 9.1%(+5.59)#98 | 10.0%(+4.75)#7,704 |
| 99. | Fessenden | 14.7% | 9.1%(+5.55)#99 | 10.0%(+4.71)#7,733 |
| 100. | Crary | 14.3% | 9.1%(+5.17)#100 | 10.0%(+4.33)#8,050 |
Common Questions
What are the Top 10 Cities with the Highest Poverty Level Among Seniors Over the Age of 65 in North Dakota?
Top 10 Cities with the Highest Poverty Level Among Seniors Over the Age of 65 in North Dakota are:
#1
100.0%
#2
100.0%
#3
100.0%
#4
100.0%
#5
100.0%
#6
80.0%
#7
80.0%
#8
75.0%
#9
69.2%
#10
66.7%
What city has the Highest Poverty Level Among Seniors Over the Age of 65 in North Dakota?
Green Acres has the Highest Poverty Level Among Seniors Over the Age of 65 in North Dakota with 100.0%.
What is the Poverty Level Among Seniors Over the Age of 65 in the State of North Dakota?
Poverty Level Among Seniors Over the Age of 65 in North Dakota is 9.1%.
What is the Poverty Level Among Seniors Over the Age of 65 in the United States?
Poverty Level Among Seniors Over the Age of 65 in the United States is 10.0%.