Cities with the Highest Poverty Level Among Seniors Over the Age of 65 in Colorado
RELATED REPORTS & OPTIONS
Highest Poverty | Seniors 65+
Colorado
Compare Cities
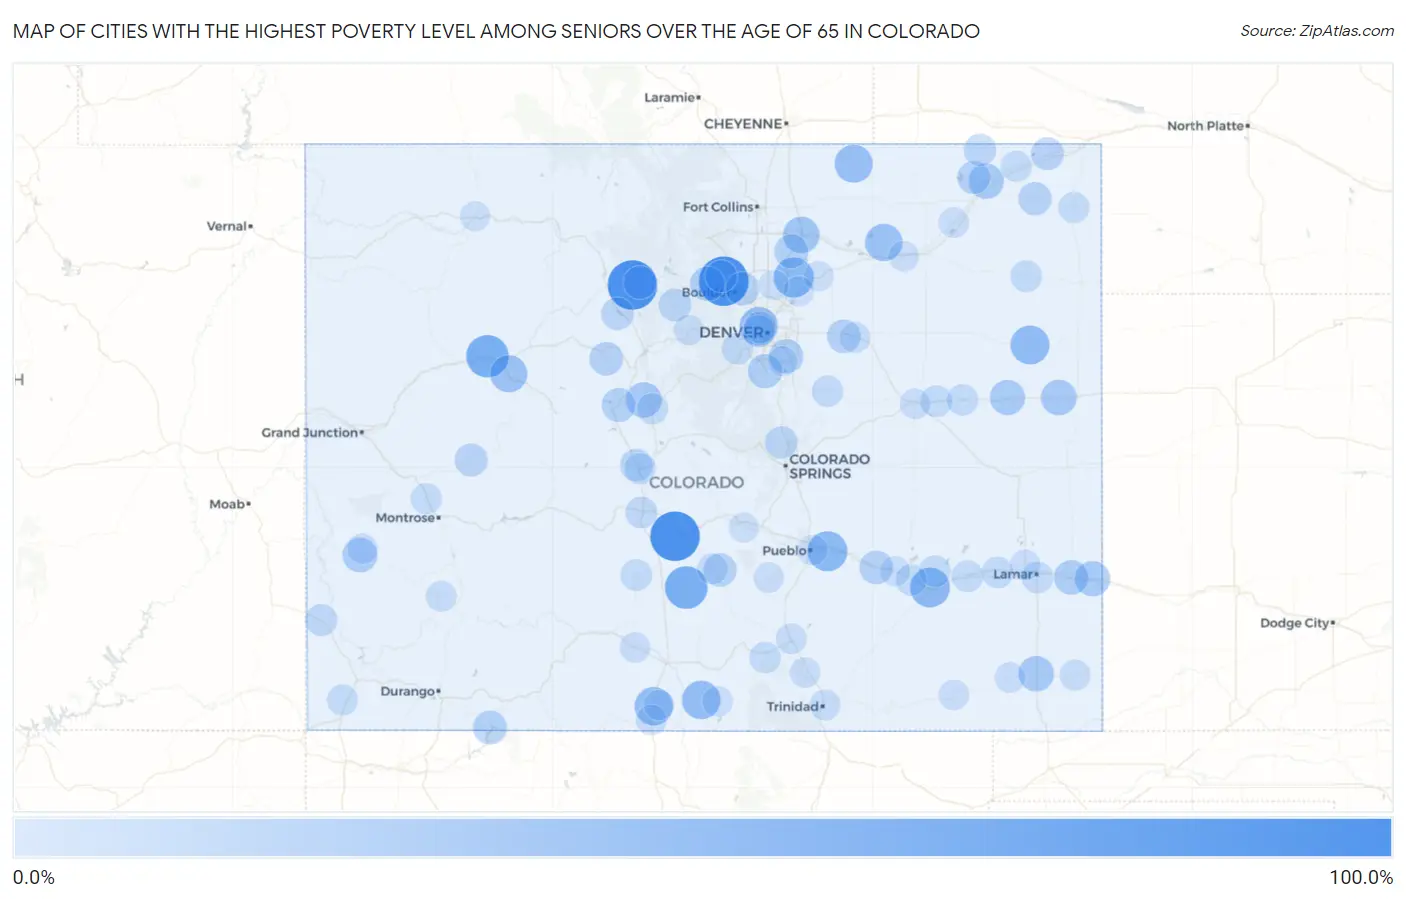
Map of Cities with the Highest Poverty Level Among Seniors Over the Age of 65 in Colorado
0.0%
100.0%
Cities with the Highest Poverty Level Among Seniors Over the Age of 65 in Colorado
| City | Senior Poverty | vs State | vs National | |
| 1. | Coaldale | 100.0% | 7.6%(+92.4)#1 | 10.0%(+90.0)#36 |
| 2. | Glendale | 100.0% | 7.6%(+92.4)#2 | 10.0%(+90.0)#138 |
| 3. | Parshall | 100.0% | 7.6%(+92.4)#3 | 10.0%(+90.0)#156 |
| 4. | Lazear | 94.7% | 7.6%(+87.2)#4 | 10.0%(+84.8)#223 |
| 5. | Crestone | 68.4% | 7.6%(+60.8)#5 | 10.0%(+58.5)#382 |
| 6. | Chacra | 68.0% | 7.6%(+60.4)#6 | 10.0%(+58.0)#389 |
| 7. | Somerset | 66.7% | 7.6%(+59.1)#7 | 10.0%(+56.7)#415 |
| 8. | Aristocrat Ranchettes | 57.1% | 7.6%(+49.6)#8 | 10.0%(+47.2)#551 |
| 9. | Vineland | 56.7% | 7.6%(+49.1)#9 | 10.0%(+46.7)#565 |
| 10. | La Junta Gardens | 55.6% | 7.6%(+48.0)#10 | 10.0%(+45.6)#600 |
| 11. | Joes | 52.4% | 7.6%(+44.8)#11 | 10.0%(+42.4)#683 |
| 12. | Romeo | 50.0% | 7.6%(+42.4)#12 | 10.0%(+40.0)#749 |
| 13. | San Acacio | 50.0% | 7.6%(+42.4)#13 | 10.0%(+40.0)#795 |
| 14. | Lakeside | 50.0% | 7.6%(+42.4)#14 | 10.0%(+40.0)#809 |
| 15. | Grover | 48.4% | 7.6%(+40.8)#15 | 10.0%(+38.4)#845 |
| 16. | Weldona | 45.5% | 7.6%(+37.9)#16 | 10.0%(+35.5)#960 |
| 17. | Cattle Creek | 44.4% | 7.6%(+36.9)#17 | 10.0%(+34.5)#998 |
| 18. | Garden City | 41.7% | 7.6%(+34.1)#18 | 10.0%(+31.7)#1,138 |
| 19. | Bethune | 37.8% | 7.6%(+30.2)#19 | 10.0%(+27.8)#1,394 |
| 20. | Springfield | 37.3% | 7.6%(+29.8)#20 | 10.0%(+27.4)#1,432 |
| 21. | Alma | 36.8% | 7.6%(+29.3)#21 | 10.0%(+26.9)#1,471 |
| 22. | Iliff | 36.4% | 7.6%(+28.8)#22 | 10.0%(+26.4)#1,510 |
| 23. | Holly | 36.2% | 7.6%(+28.6)#23 | 10.0%(+26.3)#1,524 |
| 24. | Seibert | 35.8% | 7.6%(+28.3)#24 | 10.0%(+25.9)#1,561 |
| 25. | Naturita | 34.4% | 7.6%(+26.9)#25 | 10.0%(+24.5)#1,682 |
| 26. | Granada | 33.3% | 7.6%(+25.8)#26 | 10.0%(+23.4)#1,761 |
| 27. | Ward | 33.3% | 7.6%(+25.8)#27 | 10.0%(+23.4)#1,825 |
| 28. | Dove Valley | 32.0% | 7.6%(+24.5)#28 | 10.0%(+22.1)#1,930 |
| 29. | Louviers | 31.8% | 7.6%(+24.2)#29 | 10.0%(+21.9)#1,968 |
| 30. | Arboles | 30.4% | 7.6%(+22.8)#30 | 10.0%(+20.4)#2,150 |
| 31. | Leadville | 30.3% | 7.6%(+22.7)#31 | 10.0%(+20.4)#2,160 |
| 32. | Gilcrest | 30.3% | 7.6%(+22.7)#32 | 10.0%(+20.4)#2,163 |
| 33. | Fowler | 29.4% | 7.6%(+21.8)#33 | 10.0%(+19.5)#2,293 |
| 34. | Strasburg | 28.9% | 7.6%(+21.3)#34 | 10.0%(+18.9)#2,379 |
| 35. | Minturn | 28.8% | 7.6%(+21.2)#35 | 10.0%(+18.8)#2,399 |
| 36. | Valmont | 28.6% | 7.6%(+21.0)#36 | 10.0%(+18.6)#2,455 |
| 37. | Silver Cliff | 28.4% | 7.6%(+20.8)#37 | 10.0%(+18.4)#2,481 |
| 38. | Cope | 27.8% | 7.6%(+20.2)#38 | 10.0%(+17.8)#2,593 |
| 39. | Haxtun | 27.7% | 7.6%(+20.1)#39 | 10.0%(+17.7)#2,611 |
| 40. | Padroni | 26.7% | 7.6%(+19.1)#40 | 10.0%(+16.7)#2,791 |
| 41. | Paonia | 26.5% | 7.6%(+18.9)#41 | 10.0%(+16.5)#2,825 |
| 42. | Hot Sulphur Springs | 26.3% | 7.6%(+18.7)#42 | 10.0%(+16.4)#2,853 |
| 43. | Sedgwick | 25.8% | 7.6%(+18.2)#43 | 10.0%(+15.9)#2,962 |
| 44. | Fraser | 25.0% | 7.6%(+17.4)#44 | 10.0%(+15.0)#3,140 |
| 45. | Heeney | 25.0% | 7.6%(+17.4)#45 | 10.0%(+15.0)#3,217 |
| 46. | Buena Vista | 24.5% | 7.6%(+16.9)#46 | 10.0%(+14.5)#3,317 |
| 47. | Air Force Academy | 24.1% | 7.6%(+16.6)#47 | 10.0%(+14.2)#3,405 |
| 48. | Peetz | 23.5% | 7.6%(+16.0)#48 | 10.0%(+13.6)#3,575 |
| 49. | Edgewater | 23.1% | 7.6%(+15.5)#49 | 10.0%(+13.2)#3,689 |
| 50. | Mountain View | 22.0% | 7.6%(+14.4)#50 | 10.0%(+12.0)#4,018 |
| 51. | Dove Creek | 21.9% | 7.6%(+14.3)#51 | 10.0%(+12.0)#4,047 |
| 52. | Jamestown | 21.6% | 7.6%(+14.0)#52 | 10.0%(+11.7)#4,123 |
| 53. | Twin Lakes Cdp Lake County | 21.4% | 7.6%(+13.9)#53 | 10.0%(+11.5)#4,179 |
| 54. | Poncha Springs | 21.1% | 7.6%(+13.6)#54 | 10.0%(+11.2)#4,280 |
| 55. | Saguache | 20.9% | 7.6%(+13.3)#55 | 10.0%(+10.9)#4,373 |
| 56. | Las Animas | 20.9% | 7.6%(+13.3)#56 | 10.0%(+10.9)#4,378 |
| 57. | Genoa | 20.7% | 7.6%(+13.1)#57 | 10.0%(+10.7)#4,458 |
| 58. | Indian Hills | 20.6% | 7.6%(+13.0)#58 | 10.0%(+10.6)#4,498 |
| 59. | Hasty | 20.5% | 7.6%(+12.9)#59 | 10.0%(+10.6)#4,520 |
| 60. | Lamar | 20.4% | 7.6%(+12.8)#60 | 10.0%(+10.5)#4,552 |
| 61. | Johnson Village | 20.1% | 7.6%(+12.6)#61 | 10.0%(+10.2)#4,654 |
| 62. | Yuma | 20.1% | 7.6%(+12.6)#62 | 10.0%(+10.2)#4,664 |
| 63. | Cheraw | 20.0% | 7.6%(+12.4)#63 | 10.0%(+10.0)#4,744 |
| 64. | Kiowa | 19.8% | 7.6%(+12.2)#64 | 10.0%(+9.80)#4,883 |
| 65. | Rocky Ford | 19.7% | 7.6%(+12.1)#65 | 10.0%(+9.74)#4,906 |
| 66. | Arriba | 19.5% | 7.6%(+11.9)#66 | 10.0%(+9.56)#4,982 |
| 67. | Fairplay | 19.5% | 7.6%(+11.9)#67 | 10.0%(+9.53)#4,994 |
| 68. | La Veta | 19.4% | 7.6%(+11.9)#68 | 10.0%(+9.49)#5,020 |
| 69. | Holyoke | 18.6% | 7.6%(+11.0)#69 | 10.0%(+8.61)#5,388 |
| 70. | Olathe | 18.4% | 7.6%(+10.8)#70 | 10.0%(+8.41)#5,489 |
| 71. | Towaoc | 18.2% | 7.6%(+10.6)#71 | 10.0%(+8.23)#5,558 |
| 72. | Crook | 18.2% | 7.6%(+10.6)#72 | 10.0%(+8.23)#5,592 |
| 73. | Walsh | 17.8% | 7.6%(+10.2)#73 | 10.0%(+7.84)#5,767 |
| 74. | Byers | 17.4% | 7.6%(+9.82)#74 | 10.0%(+7.44)#5,989 |
| 75. | Mountain Village | 17.2% | 7.6%(+9.67)#75 | 10.0%(+7.29)#6,075 |
| 76. | Walsenburg | 17.2% | 7.6%(+9.62)#76 | 10.0%(+7.25)#6,109 |
| 77. | Trinidad | 17.1% | 7.6%(+9.54)#77 | 10.0%(+7.16)#6,166 |
| 78. | Westcliffe | 17.0% | 7.6%(+9.47)#78 | 10.0%(+7.09)#6,193 |
| 79. | Antonito | 16.5% | 7.6%(+8.90)#79 | 10.0%(+6.52)#6,558 |
| 80. | Aguilar | 16.4% | 7.6%(+8.87)#80 | 10.0%(+6.50)#6,572 |
| 81. | San Luis | 16.4% | 7.6%(+8.82)#81 | 10.0%(+6.44)#6,602 |
| 82. | Empire | 16.3% | 7.6%(+8.75)#82 | 10.0%(+6.37)#6,642 |
| 83. | Wiley | 16.3% | 7.6%(+8.75)#83 | 10.0%(+6.37)#6,643 |
| 84. | Limon | 16.2% | 7.6%(+8.60)#84 | 10.0%(+6.22)#6,725 |
| 85. | Fort Morgan | 16.1% | 7.6%(+8.51)#85 | 10.0%(+6.13)#6,785 |
| 86. | Nucla | 16.1% | 7.6%(+8.50)#86 | 10.0%(+6.13)#6,789 |
| 87. | Kim | 16.0% | 7.6%(+8.42)#87 | 10.0%(+6.05)#6,856 |
| 88. | Monte Vista | 16.0% | 7.6%(+8.42)#88 | 10.0%(+6.04)#6,858 |
| 89. | Beulah Valley | 15.8% | 7.6%(+8.24)#89 | 10.0%(+5.87)#6,949 |
| 90. | Merino | 15.8% | 7.6%(+8.21)#90 | 10.0%(+5.84)#6,972 |
| 91. | Pritchett | 15.8% | 7.6%(+8.21)#91 | 10.0%(+5.84)#6,979 |
| 92. | Pueblo | 15.3% | 7.6%(+7.74)#92 | 10.0%(+5.36)#7,281 |
| 93. | Lochbuie | 15.2% | 7.6%(+7.61)#93 | 10.0%(+5.24)#7,358 |
| 94. | Manassa | 15.0% | 7.6%(+7.42)#94 | 10.0%(+5.05)#7,489 |
| 95. | Dacono | 14.8% | 7.6%(+7.20)#95 | 10.0%(+4.83)#7,662 |
| 96. | Manzanola | 14.7% | 7.6%(+7.10)#96 | 10.0%(+4.73)#7,725 |
| 97. | Craig | 14.7% | 7.6%(+7.08)#97 | 10.0%(+4.70)#7,739 |
| 98. | Keenesburg | 14.5% | 7.6%(+6.97)#98 | 10.0%(+4.59)#7,812 |
| 99. | Brookside | 14.5% | 7.6%(+6.94)#99 | 10.0%(+4.56)#7,840 |
| 100. | Meridian | 14.5% | 7.6%(+6.93)#100 | 10.0%(+4.55)#7,848 |
Common Questions
What are the Top 10 Cities with the Highest Poverty Level Among Seniors Over the Age of 65 in Colorado?
Top 10 Cities with the Highest Poverty Level Among Seniors Over the Age of 65 in Colorado are:
#1
100.0%
#2
100.0%
#3
100.0%
#4
68.4%
#5
68.0%
#6
57.1%
#7
56.7%
#8
55.6%
#9
52.4%
#10
50.0%
What city has the Highest Poverty Level Among Seniors Over the Age of 65 in Colorado?
Coaldale has the Highest Poverty Level Among Seniors Over the Age of 65 in Colorado with 100.0%.
What is the Poverty Level Among Seniors Over the Age of 65 in the State of Colorado?
Poverty Level Among Seniors Over the Age of 65 in Colorado is 7.6%.
What is the Poverty Level Among Seniors Over the Age of 65 in the United States?
Poverty Level Among Seniors Over the Age of 65 in the United States is 10.0%.