Cities with the Highest Poverty Level Among Seniors Over the Age of 65 in Louisiana
RELATED REPORTS & OPTIONS
Highest Poverty | Seniors 65+
Louisiana
Compare Cities
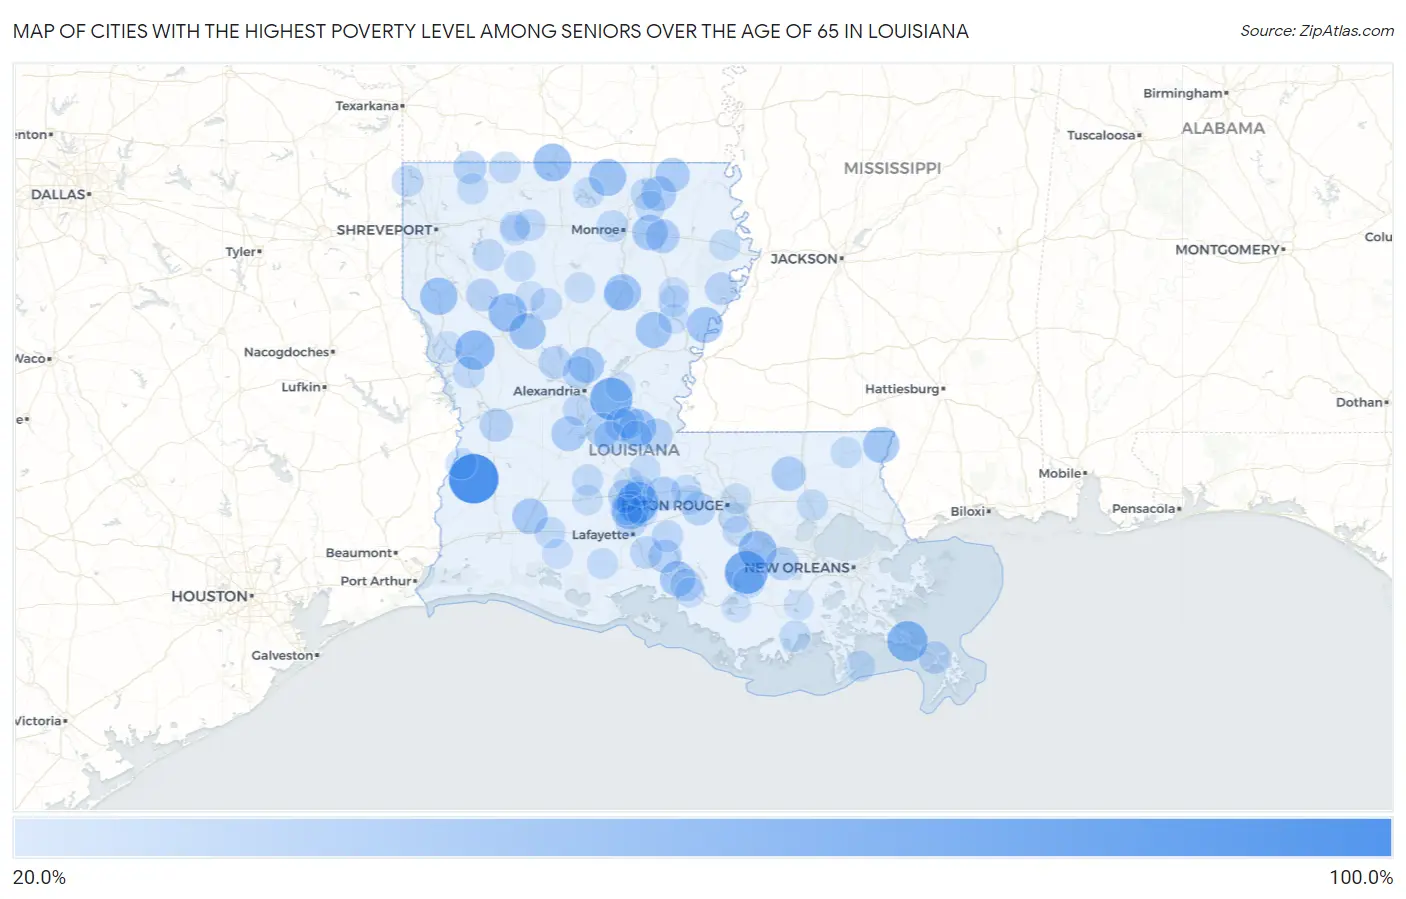
Map of Cities with the Highest Poverty Level Among Seniors Over the Age of 65 in Louisiana
0.0%
100.0%
Cities with the Highest Poverty Level Among Seniors Over the Age of 65 in Louisiana
| City | Senior Poverty | vs State | vs National | |
| 1. | Singer | 100.0% | 13.6%(+86.4)#1 | 10.0%(+90.0)#41 |
| 2. | Echo | 100.0% | 13.6%(+86.4)#2 | 10.0%(+90.0)#50 |
| 3. | Napoleonville | 74.2% | 13.6%(+60.6)#3 | 10.0%(+64.2)#324 |
| 4. | Center Point | 71.1% | 13.6%(+57.5)#4 | 10.0%(+61.1)#350 |
| 5. | Centerville | 67.8% | 13.6%(+54.3)#5 | 10.0%(+57.9)#394 |
| 6. | Leonville | 67.7% | 13.6%(+54.1)#6 | 10.0%(+57.8)#395 |
| 7. | Empire | 64.6% | 13.6%(+51.0)#7 | 10.0%(+54.6)#447 |
| 8. | Fort Jesup | 60.2% | 13.6%(+46.6)#8 | 10.0%(+50.2)#503 |
| 9. | Good Pine | 58.4% | 13.6%(+44.8)#9 | 10.0%(+48.4)#535 |
| 10. | Grand Coteau | 56.3% | 13.6%(+42.7)#10 | 10.0%(+46.3)#580 |
| 11. | Lemannville | 56.0% | 13.6%(+42.4)#11 | 10.0%(+46.0)#589 |
| 12. | Campti | 55.9% | 13.6%(+42.3)#12 | 10.0%(+45.9)#594 |
| 13. | Junction City | 53.7% | 13.6%(+40.1)#13 | 10.0%(+43.8)#647 |
| 14. | South Mansfield | 52.4% | 13.6%(+38.8)#14 | 10.0%(+42.4)#681 |
| 15. | Moreauville | 52.3% | 13.6%(+38.8)#15 | 10.0%(+42.4)#686 |
| 16. | Marion | 51.1% | 13.6%(+37.6)#16 | 10.0%(+41.2)#723 |
| 17. | Grayson | 50.0% | 13.6%(+36.4)#17 | 10.0%(+40.0)#740 |
| 18. | St Maurice | 49.1% | 13.6%(+35.5)#18 | 10.0%(+39.1)#824 |
| 19. | Varnado | 48.3% | 13.6%(+34.8)#19 | 10.0%(+38.4)#850 |
| 20. | Waterproof | 48.1% | 13.6%(+34.5)#20 | 10.0%(+38.1)#856 |
| 21. | Harrisonburg | 47.9% | 13.6%(+34.3)#21 | 10.0%(+37.9)#863 |
| 22. | Pollock | 46.7% | 13.6%(+33.1)#22 | 10.0%(+36.7)#909 |
| 23. | Fenton | 46.2% | 13.6%(+32.6)#23 | 10.0%(+36.2)#930 |
| 24. | Start | 45.7% | 13.6%(+32.1)#24 | 10.0%(+35.8)#948 |
| 25. | Sorrel | 45.4% | 13.6%(+31.8)#25 | 10.0%(+35.4)#968 |
| 26. | Mcnary | 43.6% | 13.6%(+30.0)#26 | 10.0%(+33.6)#1,046 |
| 27. | Mer Rouge | 43.1% | 13.6%(+29.6)#27 | 10.0%(+33.2)#1,069 |
| 28. | Montpelier | 41.9% | 13.6%(+28.4)#28 | 10.0%(+32.0)#1,128 |
| 29. | Bonita | 41.7% | 13.6%(+28.1)#29 | 10.0%(+31.7)#1,136 |
| 30. | Cheneyville | 41.4% | 13.6%(+27.8)#30 | 10.0%(+31.4)#1,157 |
| 31. | Krotz Springs | 40.7% | 13.6%(+27.1)#31 | 10.0%(+30.8)#1,201 |
| 32. | Rayville | 40.2% | 13.6%(+26.6)#32 | 10.0%(+30.3)#1,228 |
| 33. | Fort Polk South | 37.9% | 13.6%(+24.4)#33 | 10.0%(+28.0)#1,379 |
| 34. | Opelousas | 37.9% | 13.6%(+24.3)#34 | 10.0%(+27.9)#1,385 |
| 35. | North Vacherie | 37.3% | 13.6%(+23.7)#35 | 10.0%(+27.4)#1,433 |
| 36. | Grosse Tete | 37.3% | 13.6%(+23.7)#36 | 10.0%(+27.4)#1,435 |
| 37. | Loreauville | 37.0% | 13.6%(+23.4)#37 | 10.0%(+27.0)#1,458 |
| 38. | Hessmer | 37.0% | 13.6%(+23.4)#38 | 10.0%(+27.0)#1,461 |
| 39. | Simmesport | 36.4% | 13.6%(+22.9)#39 | 10.0%(+26.5)#1,504 |
| 40. | Cullen | 36.4% | 13.6%(+22.8)#40 | 10.0%(+26.4)#1,507 |
| 41. | Coushatta | 36.1% | 13.6%(+22.5)#41 | 10.0%(+26.1)#1,538 |
| 42. | Colfax | 36.0% | 13.6%(+22.4)#42 | 10.0%(+26.0)#1,547 |
| 43. | Newellton | 35.1% | 13.6%(+21.5)#43 | 10.0%(+25.1)#1,632 |
| 44. | Baldwin | 34.7% | 13.6%(+21.2)#44 | 10.0%(+24.8)#1,654 |
| 45. | Bunkie | 34.7% | 13.6%(+21.1)#45 | 10.0%(+24.7)#1,657 |
| 46. | Cade | 34.4% | 13.6%(+20.8)#46 | 10.0%(+24.5)#1,679 |
| 47. | Venice | 34.3% | 13.6%(+20.7)#47 | 10.0%(+24.3)#1,693 |
| 48. | Prospect | 34.0% | 13.6%(+20.4)#48 | 10.0%(+24.0)#1,712 |
| 49. | Carencro | 33.3% | 13.6%(+19.8)#49 | 10.0%(+23.4)#1,748 |
| 50. | Mansura | 32.6% | 13.6%(+19.0)#50 | 10.0%(+22.6)#1,879 |
| 51. | Woodworth | 32.5% | 13.6%(+18.9)#51 | 10.0%(+22.6)#1,888 |
| 52. | Ringgold | 32.4% | 13.6%(+18.8)#52 | 10.0%(+22.4)#1,898 |
| 53. | Claiborne | 32.1% | 13.6%(+18.6)#53 | 10.0%(+22.2)#1,921 |
| 54. | Catahoula | 32.0% | 13.6%(+18.4)#54 | 10.0%(+22.0)#1,943 |
| 55. | Florien | 31.9% | 13.6%(+18.3)#55 | 10.0%(+21.9)#1,956 |
| 56. | Bastrop | 31.9% | 13.6%(+18.3)#56 | 10.0%(+21.9)#1,962 |
| 57. | Haynesville | 31.9% | 13.6%(+18.3)#57 | 10.0%(+21.9)#1,963 |
| 58. | Vivian | 31.7% | 13.6%(+18.1)#58 | 10.0%(+21.7)#1,985 |
| 59. | Calvin | 31.4% | 13.6%(+17.9)#59 | 10.0%(+21.5)#2,024 |
| 60. | Arcadia | 31.4% | 13.6%(+17.8)#60 | 10.0%(+21.5)#2,025 |
| 61. | Roanoke | 31.0% | 13.6%(+17.4)#61 | 10.0%(+21.0)#2,073 |
| 62. | Chauvin | 30.6% | 13.6%(+17.1)#62 | 10.0%(+20.7)#2,122 |
| 63. | Ponchatoula | 30.6% | 13.6%(+17.0)#63 | 10.0%(+20.6)#2,126 |
| 64. | Merryville | 30.5% | 13.6%(+17.0)#64 | 10.0%(+20.6)#2,133 |
| 65. | Supreme | 30.4% | 13.6%(+16.8)#65 | 10.0%(+20.5)#2,148 |
| 66. | Mamou | 30.4% | 13.6%(+16.8)#66 | 10.0%(+20.4)#2,153 |
| 67. | Plaucheville | 30.2% | 13.6%(+16.7)#67 | 10.0%(+20.3)#2,174 |
| 68. | Tallulah | 30.1% | 13.6%(+16.5)#68 | 10.0%(+20.1)#2,187 |
| 69. | Franklinton | 30.0% | 13.6%(+16.4)#69 | 10.0%(+20.0)#2,215 |
| 70. | Wisner | 29.8% | 13.6%(+16.3)#70 | 10.0%(+19.9)#2,224 |
| 71. | Cotton Valley | 29.8% | 13.6%(+16.2)#71 | 10.0%(+19.9)#2,232 |
| 72. | Farmerville | 29.7% | 13.6%(+16.1)#72 | 10.0%(+19.7)#2,260 |
| 73. | Palmetto | 29.6% | 13.6%(+16.1)#73 | 10.0%(+19.7)#2,272 |
| 74. | Kaplan | 29.5% | 13.6%(+15.9)#74 | 10.0%(+19.5)#2,286 |
| 75. | Arnaudville | 29.1% | 13.6%(+15.5)#75 | 10.0%(+19.1)#2,341 |
| 76. | Lucky | 28.9% | 13.6%(+15.4)#76 | 10.0%(+19.0)#2,362 |
| 77. | Grand Isle | 28.9% | 13.6%(+15.3)#77 | 10.0%(+19.0)#2,367 |
| 78. | Port Barre | 28.6% | 13.6%(+15.0)#78 | 10.0%(+18.6)#2,420 |
| 79. | Sikes | 28.6% | 13.6%(+15.0)#79 | 10.0%(+18.6)#2,436 |
| 80. | Gardere | 28.4% | 13.6%(+14.8)#80 | 10.0%(+18.4)#2,480 |
| 81. | St Gabriel | 28.2% | 13.6%(+14.6)#81 | 10.0%(+18.3)#2,503 |
| 82. | Collinston | 28.2% | 13.6%(+14.6)#82 | 10.0%(+18.3)#2,508 |
| 83. | Livonia | 28.1% | 13.6%(+14.6)#83 | 10.0%(+18.2)#2,520 |
| 84. | Eunice | 28.0% | 13.6%(+14.4)#84 | 10.0%(+18.1)#2,539 |
| 85. | Mount Lebanon | 28.0% | 13.6%(+14.4)#85 | 10.0%(+18.0)#2,545 |
| 86. | Merrydale | 27.6% | 13.6%(+14.1)#86 | 10.0%(+17.7)#2,615 |
| 87. | Zwolle | 27.6% | 13.6%(+14.0)#87 | 10.0%(+17.6)#2,622 |
| 88. | Gibsland | 27.6% | 13.6%(+14.0)#88 | 10.0%(+17.6)#2,625 |
| 89. | Gilbert | 27.5% | 13.6%(+13.9)#89 | 10.0%(+17.5)#2,643 |
| 90. | Sunset | 27.0% | 13.6%(+13.4)#90 | 10.0%(+17.0)#2,739 |
| 91. | Sicily Island | 26.9% | 13.6%(+13.3)#91 | 10.0%(+16.9)#2,751 |
| 92. | Lake Arthur | 26.8% | 13.6%(+13.2)#92 | 10.0%(+16.8)#2,769 |
| 93. | Clarks | 26.4% | 13.6%(+12.8)#93 | 10.0%(+16.5)#2,841 |
| 94. | Maringouin | 26.2% | 13.6%(+12.6)#94 | 10.0%(+16.2)#2,895 |
| 95. | Amelia | 26.0% | 13.6%(+12.4)#95 | 10.0%(+16.0)#2,918 |
| 96. | Mathews | 25.9% | 13.6%(+12.3)#96 | 10.0%(+16.0)#2,921 |
| 97. | Goldonna | 25.9% | 13.6%(+12.3)#97 | 10.0%(+16.0)#2,925 |
| 98. | Washington | 25.9% | 13.6%(+12.3)#98 | 10.0%(+15.9)#2,944 |
| 99. | Franklin | 25.8% | 13.6%(+12.2)#99 | 10.0%(+15.8)#2,966 |
| 100. | Deville | 25.8% | 13.6%(+12.2)#100 | 10.0%(+15.8)#2,969 |
Common Questions
What are the Top 10 Cities with the Highest Poverty Level Among Seniors Over the Age of 65 in Louisiana?
Top 10 Cities with the Highest Poverty Level Among Seniors Over the Age of 65 in Louisiana are:
#1
100.0%
#2
74.2%
#3
71.1%
#4
67.7%
#5
64.6%
#6
60.2%
#7
56.3%
#8
56.0%
#9
55.9%
#10
53.7%
What city has the Highest Poverty Level Among Seniors Over the Age of 65 in Louisiana?
Singer has the Highest Poverty Level Among Seniors Over the Age of 65 in Louisiana with 100.0%.
What is the Poverty Level Among Seniors Over the Age of 65 in the State of Louisiana?
Poverty Level Among Seniors Over the Age of 65 in Louisiana is 13.6%.
What is the Poverty Level Among Seniors Over the Age of 65 in the United States?
Poverty Level Among Seniors Over the Age of 65 in the United States is 10.0%.