Cities with the Highest Poverty Level Among Seniors Over the Age of 65 in Pennsylvania
RELATED REPORTS & OPTIONS
Highest Poverty | Seniors 65+
Pennsylvania
Compare Cities
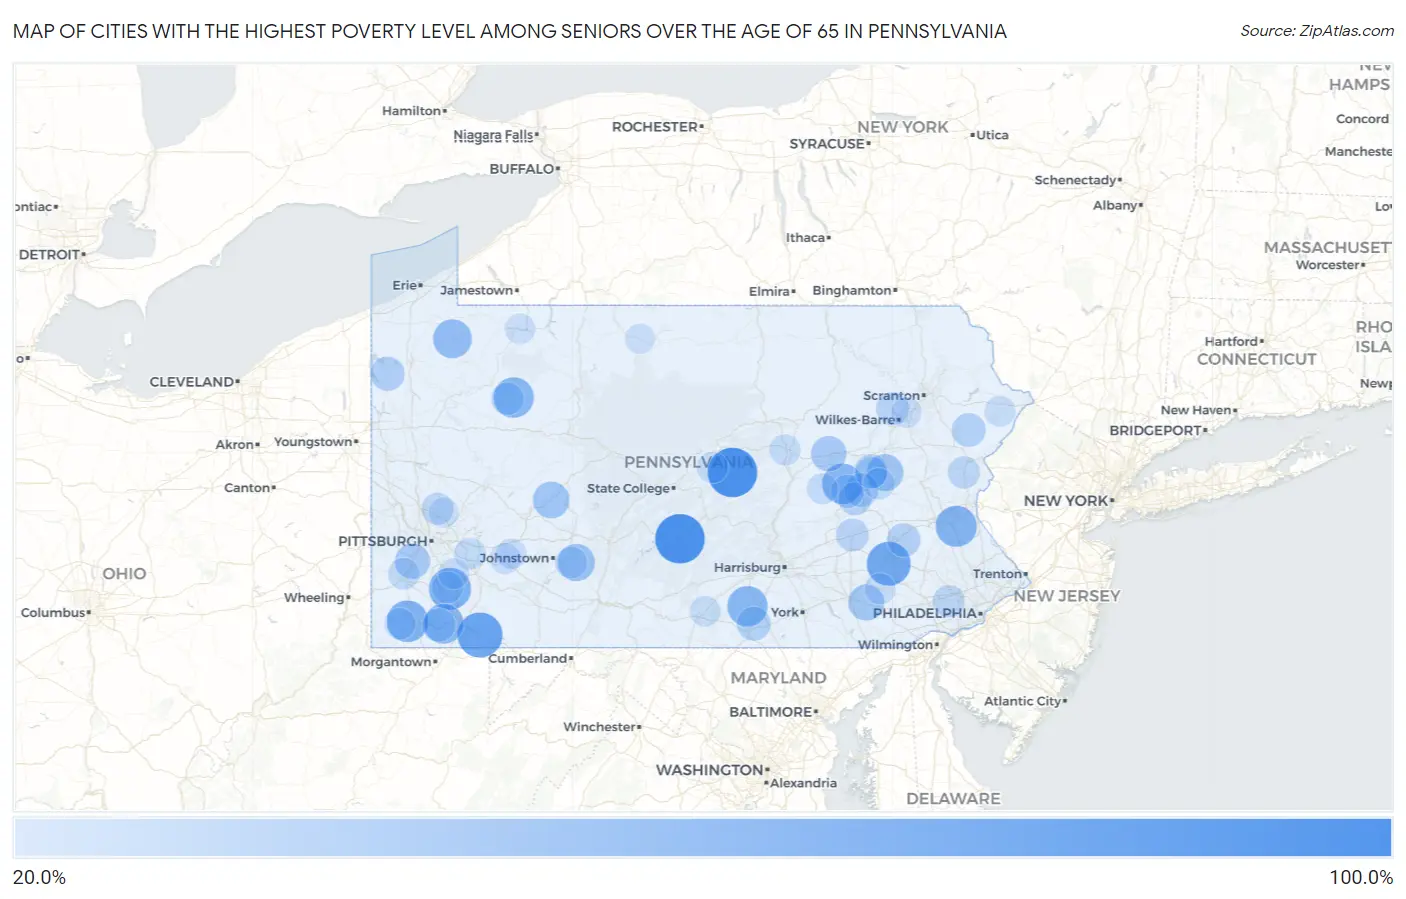
Map of Cities with the Highest Poverty Level Among Seniors Over the Age of 65 in Pennsylvania
0.0%
100.0%
Cities with the Highest Poverty Level Among Seniors Over the Age of 65 in Pennsylvania
| City | Senior Poverty | vs State | vs National | |
| 1. | Sproul | 100.0% | 8.9%(+91.1)#1 | 10.0%(+90.0)#69 |
| 2. | Atkinson Mills | 100.0% | 8.9%(+91.1)#2 | 10.0%(+90.0)#100 |
| 3. | Gray | 100.0% | 8.9%(+91.1)#3 | 10.0%(+90.0)#112 |
| 4. | Woodward | 100.0% | 8.9%(+91.1)#4 | 10.0%(+90.0)#126 |
| 5. | Farmington | 82.2% | 8.9%(+73.3)#5 | 10.0%(+72.2)#268 |
| 6. | Pennwyn | 77.7% | 8.9%(+68.8)#6 | 10.0%(+67.7)#292 |
| 7. | Landingville Borough | 70.7% | 8.9%(+61.8)#7 | 10.0%(+60.8)#351 |
| 8. | Arnold City | 70.4% | 8.9%(+61.5)#8 | 10.0%(+60.5)#359 |
| 9. | West Waynesburg | 68.3% | 8.9%(+59.4)#9 | 10.0%(+58.3)#384 |
| 10. | Desales University | 66.7% | 8.9%(+57.8)#10 | 10.0%(+56.7)#405 |
| 11. | Hazen | 65.2% | 8.9%(+56.3)#11 | 10.0%(+55.3)#440 |
| 12. | Wilburton Number Two | 64.7% | 8.9%(+55.8)#12 | 10.0%(+54.8)#446 |
| 13. | Crown | 63.6% | 8.9%(+54.7)#13 | 10.0%(+53.7)#455 |
| 14. | Gardners | 63.2% | 8.9%(+54.3)#14 | 10.0%(+53.2)#466 |
| 15. | Polk Borough | 62.8% | 8.9%(+53.9)#15 | 10.0%(+52.9)#469 |
| 16. | Edenborn | 61.5% | 8.9%(+52.6)#16 | 10.0%(+51.6)#482 |
| 17. | Carson Valley | 60.9% | 8.9%(+52.0)#17 | 10.0%(+50.9)#494 |
| 18. | Riceville | 57.1% | 8.9%(+48.3)#18 | 10.0%(+47.2)#557 |
| 19. | Aaronsburg Cdp Washington County | 56.7% | 8.9%(+47.8)#19 | 10.0%(+46.7)#566 |
| 20. | Centerport Borough | 52.9% | 8.9%(+44.1)#20 | 10.0%(+43.0)#668 |
| 21. | Dunlo | 51.5% | 8.9%(+42.6)#21 | 10.0%(+41.6)#707 |
| 22. | Kelayres | 50.0% | 8.9%(+41.1)#22 | 10.0%(+40.0)#744 |
| 23. | New Morgan Borough | 50.0% | 8.9%(+41.1)#23 | 10.0%(+40.0)#793 |
| 24. | Commodore | 49.3% | 8.9%(+40.4)#24 | 10.0%(+39.3)#817 |
| 25. | Ronks | 46.9% | 8.9%(+38.0)#25 | 10.0%(+36.9)#903 |
| 26. | Marcus Hook Borough | 45.2% | 8.9%(+36.3)#26 | 10.0%(+35.2)#974 |
| 27. | Buckhorn | 44.4% | 8.9%(+35.6)#27 | 10.0%(+34.5)#999 |
| 28. | Hendersonville | 44.2% | 8.9%(+35.3)#28 | 10.0%(+34.2)#1,016 |
| 29. | Elco Borough | 44.1% | 8.9%(+35.2)#29 | 10.0%(+34.1)#1,020 |
| 30. | Benton Borough | 42.2% | 8.9%(+33.3)#30 | 10.0%(+32.2)#1,114 |
| 31. | New Columbus Borough | 40.3% | 8.9%(+31.4)#31 | 10.0%(+30.3)#1,223 |
| 32. | Hartstown | 40.0% | 8.9%(+31.1)#32 | 10.0%(+30.0)#1,239 |
| 33. | Briar Creek Borough | 38.9% | 8.9%(+30.0)#33 | 10.0%(+29.0)#1,318 |
| 34. | Hunterstown | 38.9% | 8.9%(+30.0)#34 | 10.0%(+28.9)#1,322 |
| 35. | Oneida | 38.5% | 8.9%(+29.6)#35 | 10.0%(+28.5)#1,351 |
| 36. | Mountainhome | 38.2% | 8.9%(+29.3)#36 | 10.0%(+28.3)#1,362 |
| 37. | Altamont | 38.1% | 8.9%(+29.2)#37 | 10.0%(+28.1)#1,374 |
| 38. | Homestead Borough | 37.5% | 8.9%(+28.7)#38 | 10.0%(+27.6)#1,403 |
| 39. | Walnuttown | 37.5% | 8.9%(+28.6)#39 | 10.0%(+27.5)#1,408 |
| 40. | Nemacolin | 36.7% | 8.9%(+27.8)#40 | 10.0%(+26.8)#1,489 |
| 41. | Heckscherville | 35.7% | 8.9%(+26.8)#41 | 10.0%(+25.8)#1,576 |
| 42. | Fountain Springs | 35.7% | 8.9%(+26.8)#42 | 10.0%(+25.8)#1,577 |
| 43. | Shavertown | 35.2% | 8.9%(+26.4)#43 | 10.0%(+25.3)#1,621 |
| 44. | Bethel | 35.0% | 8.9%(+26.1)#44 | 10.0%(+25.0)#1,639 |
| 45. | Washingtonville Borough | 33.3% | 8.9%(+24.4)#45 | 10.0%(+23.4)#1,782 |
| 46. | Potters Mills | 33.3% | 8.9%(+24.4)#46 | 10.0%(+23.4)#1,789 |
| 47. | Tylersburg | 33.3% | 8.9%(+24.4)#47 | 10.0%(+23.4)#1,809 |
| 48. | Saylorsburg | 32.3% | 8.9%(+23.4)#48 | 10.0%(+22.3)#1,905 |
| 49. | Forksville Borough | 32.1% | 8.9%(+23.3)#49 | 10.0%(+22.2)#1,923 |
| 50. | Cotton | 32.1% | 8.9%(+23.3)#50 | 10.0%(+22.2)#1,924 |
| 51. | Berwyn | 31.9% | 8.9%(+23.0)#51 | 10.0%(+22.0)#1,950 |
| 52. | Mount Oliver Borough | 31.8% | 8.9%(+22.9)#52 | 10.0%(+21.9)#1,965 |
| 53. | Bakerstown | 31.7% | 8.9%(+22.8)#53 | 10.0%(+21.7)#1,987 |
| 54. | Mckees Rocks Borough | 30.9% | 8.9%(+22.0)#54 | 10.0%(+21.0)#2,081 |
| 55. | Sheppton | 30.7% | 8.9%(+21.8)#55 | 10.0%(+20.7)#2,115 |
| 56. | Salix | 30.6% | 8.9%(+21.7)#56 | 10.0%(+20.7)#2,121 |
| 57. | Atglen Borough | 30.3% | 8.9%(+21.4)#57 | 10.0%(+20.3)#2,168 |
| 58. | Lynnwood Pricedale | 30.1% | 8.9%(+21.2)#58 | 10.0%(+20.2)#2,180 |
| 59. | Meadowlands | 29.9% | 8.9%(+21.0)#59 | 10.0%(+19.9)#2,223 |
| 60. | Townville Borough | 29.8% | 8.9%(+20.9)#60 | 10.0%(+19.8)#2,236 |
| 61. | Harrison City | 29.7% | 8.9%(+20.8)#61 | 10.0%(+19.8)#2,254 |
| 62. | West Reading Borough | 29.7% | 8.9%(+20.8)#62 | 10.0%(+19.8)#2,256 |
| 63. | Loretto Borough | 29.4% | 8.9%(+20.5)#63 | 10.0%(+19.5)#2,292 |
| 64. | Robeson Extension | 29.4% | 8.9%(+20.5)#64 | 10.0%(+19.5)#2,298 |
| 65. | Park Crest | 29.3% | 8.9%(+20.4)#65 | 10.0%(+19.4)#2,309 |
| 66. | Dauphin Borough | 29.3% | 8.9%(+20.4)#66 | 10.0%(+19.3)#2,316 |
| 67. | Rogersville | 29.2% | 8.9%(+20.3)#67 | 10.0%(+19.2)#2,332 |
| 68. | Troy Borough | 29.1% | 8.9%(+20.2)#68 | 10.0%(+19.1)#2,338 |
| 69. | Juniata Terrace Borough | 28.8% | 8.9%(+19.9)#69 | 10.0%(+18.8)#2,393 |
| 70. | Madisonburg | 28.6% | 8.9%(+19.7)#70 | 10.0%(+18.6)#2,446 |
| 71. | Mahanoy City Borough | 28.4% | 8.9%(+19.5)#71 | 10.0%(+18.5)#2,476 |
| 72. | West York Borough | 28.4% | 8.9%(+19.5)#72 | 10.0%(+18.4)#2,484 |
| 73. | New Columbia | 28.3% | 8.9%(+19.4)#73 | 10.0%(+18.3)#2,494 |
| 74. | Shamokin | 28.1% | 8.9%(+19.3)#74 | 10.0%(+18.2)#2,518 |
| 75. | Fountain Hill Borough | 28.0% | 8.9%(+19.1)#75 | 10.0%(+18.0)#2,549 |
| 76. | Coal Center Borough | 27.8% | 8.9%(+18.9)#76 | 10.0%(+17.8)#2,583 |
| 77. | Orrstown Borough | 27.7% | 8.9%(+18.8)#77 | 10.0%(+17.7)#2,605 |
| 78. | Conashaugh Lakes | 27.6% | 8.9%(+18.7)#78 | 10.0%(+17.7)#2,619 |
| 79. | Millbourne Borough | 27.6% | 8.9%(+18.7)#79 | 10.0%(+17.6)#2,623 |
| 80. | Blue Ball | 27.4% | 8.9%(+18.5)#80 | 10.0%(+17.5)#2,655 |
| 81. | Bradenville | 27.3% | 8.9%(+18.4)#81 | 10.0%(+17.3)#2,677 |
| 82. | Collinsburg | 27.2% | 8.9%(+18.3)#82 | 10.0%(+17.2)#2,707 |
| 83. | Scotland | 27.0% | 8.9%(+18.1)#83 | 10.0%(+17.0)#2,738 |
| 84. | Pleasantville Borough Bedford County | 26.9% | 8.9%(+18.0)#84 | 10.0%(+17.0)#2,744 |
| 85. | North Charleroi Borough | 26.8% | 8.9%(+17.9)#85 | 10.0%(+16.8)#2,763 |
| 86. | Thompsontown Borough | 26.4% | 8.9%(+17.5)#86 | 10.0%(+16.4)#2,845 |
| 87. | Inkerman | 26.0% | 8.9%(+17.1)#87 | 10.0%(+16.0)#2,915 |
| 88. | Millwood | 25.9% | 8.9%(+17.0)#88 | 10.0%(+15.9)#2,937 |
| 89. | Jenkintown Borough | 25.9% | 8.9%(+17.0)#89 | 10.0%(+15.9)#2,940 |
| 90. | Renovo Borough | 25.7% | 8.9%(+16.8)#90 | 10.0%(+15.7)#2,991 |
| 91. | Starbrick | 25.6% | 8.9%(+16.8)#91 | 10.0%(+15.7)#2,992 |
| 92. | Mill Creek Borough | 25.5% | 8.9%(+16.6)#92 | 10.0%(+15.6)#3,031 |
| 93. | Moosic Borough | 25.2% | 8.9%(+16.3)#93 | 10.0%(+15.3)#3,112 |
| 94. | Bentleyville Borough | 25.1% | 8.9%(+16.2)#94 | 10.0%(+15.1)#3,133 |
| 95. | Coaldale Borough Bedford County | 25.0% | 8.9%(+16.1)#95 | 10.0%(+15.0)#3,206 |
| 96. | Clappertown | 25.0% | 8.9%(+16.1)#96 | 10.0%(+15.0)#3,209 |
| 97. | Roulette | 24.8% | 8.9%(+15.9)#97 | 10.0%(+14.8)#3,257 |
| 98. | Bairdford | 24.7% | 8.9%(+15.8)#98 | 10.0%(+14.8)#3,265 |
| 99. | Pitcairn Borough | 24.6% | 8.9%(+15.7)#99 | 10.0%(+14.6)#3,289 |
| 100. | Delmont Borough | 24.6% | 8.9%(+15.7)#100 | 10.0%(+14.6)#3,290 |
Common Questions
What are the Top 10 Cities with the Highest Poverty Level Among Seniors Over the Age of 65 in Pennsylvania?
Top 10 Cities with the Highest Poverty Level Among Seniors Over the Age of 65 in Pennsylvania are:
#1
100.0%
#2
100.0%
#3
82.2%
#4
77.7%
#5
70.4%
#6
68.3%
#7
66.7%
#8
64.7%
#9
63.6%
#10
63.2%
What city has the Highest Poverty Level Among Seniors Over the Age of 65 in Pennsylvania?
Atkinson Mills has the Highest Poverty Level Among Seniors Over the Age of 65 in Pennsylvania with 100.0%.
What is the Poverty Level Among Seniors Over the Age of 65 in the State of Pennsylvania?
Poverty Level Among Seniors Over the Age of 65 in Pennsylvania is 8.9%.
What is the Poverty Level Among Seniors Over the Age of 65 in the United States?
Poverty Level Among Seniors Over the Age of 65 in the United States is 10.0%.