Cities with the Highest Poverty Level Among Seniors Over the Age of 65 in Virginia
RELATED REPORTS & OPTIONS
Highest Poverty | Seniors 65+
Virginia
Compare Cities
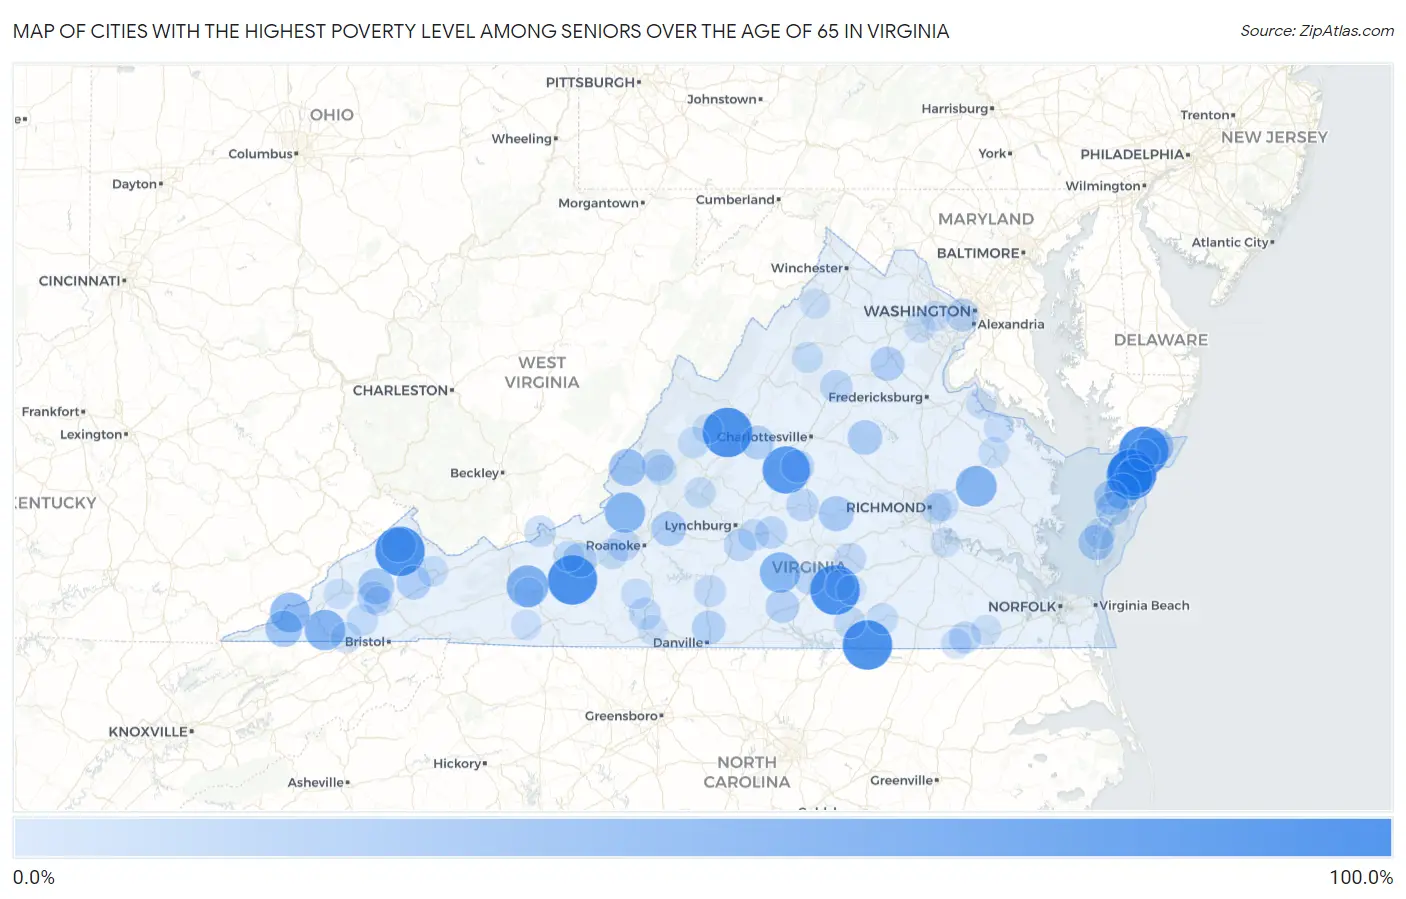
Map of Cities with the Highest Poverty Level Among Seniors Over the Age of 65 in Virginia
0.0%
100.0%
Cities with the Highest Poverty Level Among Seniors Over the Age of 65 in Virginia
| City | Senior Poverty | vs State | vs National | |
| 1. | Innovation | 100.0% | 8.0%(+92.0)#1 | 10.0%(+90.0)#6 |
| 2. | Chase Crossing | 100.0% | 8.0%(+92.0)#2 | 10.0%(+90.0)#28 |
| 3. | Vansant | 100.0% | 8.0%(+92.0)#3 | 10.0%(+90.0)#61 |
| 4. | Lunenburg | 100.0% | 8.0%(+92.0)#4 | 10.0%(+90.0)#65 |
| 5. | Ebony | 100.0% | 8.0%(+92.0)#5 | 10.0%(+90.0)#101 |
| 6. | Willis Wharf | 100.0% | 8.0%(+92.0)#6 | 10.0%(+90.0)#124 |
| 7. | Snowville | 100.0% | 8.0%(+92.0)#7 | 10.0%(+90.0)#128 |
| 8. | Rectortown | 100.0% | 8.0%(+92.0)#8 | 10.0%(+90.0)#146 |
| 9. | Middlebrook | 100.0% | 8.0%(+92.0)#10 | 10.0%(+90.0)#169 |
| 10. | Oak Hall | 100.0% | 8.0%(+92.0)#11 | 10.0%(+90.0)#170 |
| 11. | Schuyler | 90.8% | 8.0%(+82.8)#12 | 10.0%(+80.8)#230 |
| 12. | Whitesville | 89.4% | 8.0%(+81.4)#13 | 10.0%(+79.4)#234 |
| 13. | Dunbar | 74.2% | 8.0%(+66.2)#14 | 10.0%(+64.2)#326 |
| 14. | Max Meadows | 66.7% | 8.0%(+58.7)#15 | 10.0%(+56.7)#406 |
| 15. | Falls Mills | 65.6% | 8.0%(+57.6)#16 | 10.0%(+55.7)#430 |
| 16. | Barboursville | 63.3% | 8.0%(+55.3)#17 | 10.0%(+53.4)#462 |
| 17. | King William | 62.5% | 8.0%(+54.5)#18 | 10.0%(+52.5)#471 |
| 18. | Clinchport | 61.5% | 8.0%(+53.5)#19 | 10.0%(+51.6)#484 |
| 19. | New Castle | 60.9% | 8.0%(+52.9)#20 | 10.0%(+50.9)#493 |
| 20. | Phenix | 60.8% | 8.0%(+52.8)#21 | 10.0%(+50.8)#497 |
| 21. | St Charles | 58.3% | 8.0%(+50.3)#22 | 10.0%(+48.4)#539 |
| 22. | Metompkin | 53.3% | 8.0%(+45.3)#23 | 10.0%(+43.4)#655 |
| 23. | Pastoria | 49.0% | 8.0%(+41.0)#24 | 10.0%(+39.0)#827 |
| 24. | Horntown | 47.3% | 8.0%(+39.3)#25 | 10.0%(+37.4)#887 |
| 25. | Callaghan | 46.5% | 8.0%(+38.5)#26 | 10.0%(+36.6)#918 |
| 26. | Jonesville | 44.8% | 8.0%(+36.8)#27 | 10.0%(+34.9)#985 |
| 27. | Melfa | 41.6% | 8.0%(+33.6)#28 | 10.0%(+31.6)#1,147 |
| 28. | Dante | 41.5% | 8.0%(+33.5)#29 | 10.0%(+31.5)#1,156 |
| 29. | Cheriton | 39.3% | 8.0%(+31.3)#30 | 10.0%(+29.3)#1,299 |
| 30. | Cumberland | 39.1% | 8.0%(+31.1)#31 | 10.0%(+29.1)#1,307 |
| 31. | Montvale | 37.2% | 8.0%(+29.2)#32 | 10.0%(+27.2)#1,442 |
| 32. | Grundy | 37.1% | 8.0%(+29.1)#33 | 10.0%(+27.1)#1,446 |
| 33. | Boston | 37.0% | 8.0%(+29.0)#34 | 10.0%(+27.1)#1,453 |
| 34. | Louisa | 37.0% | 8.0%(+29.0)#35 | 10.0%(+27.0)#1,462 |
| 35. | Brandy Station | 36.5% | 8.0%(+28.5)#36 | 10.0%(+26.5)#1,502 |
| 36. | Belview | 35.6% | 8.0%(+27.6)#37 | 10.0%(+25.7)#1,588 |
| 37. | Remington | 35.1% | 8.0%(+27.1)#38 | 10.0%(+25.1)#1,633 |
| 38. | Honaker | 34.9% | 8.0%(+26.9)#39 | 10.0%(+24.9)#1,646 |
| 39. | Tacoma | 34.8% | 8.0%(+26.8)#40 | 10.0%(+24.8)#1,651 |
| 40. | Exmore | 33.9% | 8.0%(+25.8)#41 | 10.0%(+23.9)#1,720 |
| 41. | Sherando | 33.6% | 8.0%(+25.6)#42 | 10.0%(+23.7)#1,736 |
| 42. | Blairs | 33.3% | 8.0%(+25.3)#43 | 10.0%(+23.4)#1,751 |
| 43. | Disputanta | 33.3% | 8.0%(+25.3)#44 | 10.0%(+23.4)#1,752 |
| 44. | Clover | 32.7% | 8.0%(+24.7)#45 | 10.0%(+22.8)#1,865 |
| 45. | Seven Corners | 30.8% | 8.0%(+22.8)#46 | 10.0%(+20.9)#2,090 |
| 46. | Esmont | 30.5% | 8.0%(+22.5)#47 | 10.0%(+20.6)#2,135 |
| 47. | St Paul | 29.6% | 8.0%(+21.6)#48 | 10.0%(+19.7)#2,266 |
| 48. | Great Falls Crossing | 29.2% | 8.0%(+21.2)#49 | 10.0%(+19.3)#2,323 |
| 49. | Buckingham Courthouse | 28.7% | 8.0%(+20.7)#50 | 10.0%(+18.8)#2,406 |
| 50. | Stevens Creek | 28.6% | 8.0%(+20.6)#51 | 10.0%(+18.6)#2,452 |
| 51. | Madison | 27.8% | 8.0%(+19.8)#52 | 10.0%(+17.9)#2,567 |
| 52. | Baywood | 27.6% | 8.0%(+19.6)#53 | 10.0%(+17.7)#2,617 |
| 53. | Rustburg | 27.5% | 8.0%(+19.5)#54 | 10.0%(+17.5)#2,641 |
| 54. | Appomattox | 27.0% | 8.0%(+19.0)#55 | 10.0%(+17.1)#2,727 |
| 55. | Fairfield | 26.9% | 8.0%(+18.9)#56 | 10.0%(+16.9)#2,749 |
| 56. | Keysville | 26.5% | 8.0%(+18.5)#57 | 10.0%(+16.6)#2,810 |
| 57. | Glenvar | 26.5% | 8.0%(+18.5)#58 | 10.0%(+16.5)#2,822 |
| 58. | Clifton Forge | 26.3% | 8.0%(+18.3)#59 | 10.0%(+16.3)#2,877 |
| 59. | Newsoms | 26.2% | 8.0%(+18.2)#60 | 10.0%(+16.3)#2,880 |
| 60. | Crewe | 25.9% | 8.0%(+17.9)#61 | 10.0%(+15.9)#2,951 |
| 61. | Oak Level | 25.7% | 8.0%(+17.7)#62 | 10.0%(+15.8)#2,976 |
| 62. | Gretna | 25.6% | 8.0%(+17.6)#63 | 10.0%(+15.6)#3,021 |
| 63. | Highland Springs | 25.5% | 8.0%(+17.5)#64 | 10.0%(+15.6)#3,025 |
| 64. | Temperanceville | 25.5% | 8.0%(+17.5)#65 | 10.0%(+15.5)#3,043 |
| 65. | Glen Lyn | 25.0% | 8.0%(+17.0)#66 | 10.0%(+15.0)#3,211 |
| 66. | South Hill | 24.8% | 8.0%(+16.8)#67 | 10.0%(+14.9)#3,253 |
| 67. | Goshen | 24.2% | 8.0%(+16.2)#68 | 10.0%(+14.2)#3,396 |
| 68. | Nickelsville | 24.1% | 8.0%(+16.1)#69 | 10.0%(+14.2)#3,414 |
| 69. | Concord | 24.0% | 8.0%(+16.0)#70 | 10.0%(+14.0)#3,459 |
| 70. | Osaka | 23.7% | 8.0%(+15.7)#71 | 10.0%(+13.7)#3,527 |
| 71. | Lawrenceville | 23.2% | 8.0%(+15.2)#72 | 10.0%(+13.2)#3,670 |
| 72. | Iron Gate | 22.7% | 8.0%(+14.7)#73 | 10.0%(+12.8)#3,803 |
| 73. | Eastville | 22.7% | 8.0%(+14.7)#74 | 10.0%(+12.8)#3,806 |
| 74. | Stanley | 22.5% | 8.0%(+14.5)#75 | 10.0%(+12.5)#3,876 |
| 75. | Glasgow | 22.5% | 8.0%(+14.5)#76 | 10.0%(+12.5)#3,882 |
| 76. | Richlands | 22.4% | 8.0%(+14.4)#77 | 10.0%(+12.4)#3,898 |
| 77. | Weber City | 22.3% | 8.0%(+14.3)#78 | 10.0%(+12.3)#3,914 |
| 78. | Montrose | 22.3% | 8.0%(+14.3)#79 | 10.0%(+12.3)#3,916 |
| 79. | Elliston | 22.2% | 8.0%(+14.2)#80 | 10.0%(+12.3)#3,927 |
| 80. | Belspring | 22.0% | 8.0%(+14.0)#81 | 10.0%(+12.0)#4,020 |
| 81. | Tappahannock | 21.7% | 8.0%(+13.7)#82 | 10.0%(+11.7)#4,107 |
| 82. | Pounding Mill | 21.0% | 8.0%(+13.0)#83 | 10.0%(+11.0)#4,334 |
| 83. | Ferrum | 20.8% | 8.0%(+12.8)#84 | 10.0%(+10.8)#4,410 |
| 84. | Bull Run | 20.7% | 8.0%(+12.7)#85 | 10.0%(+10.8)#4,438 |
| 85. | Boykins | 20.7% | 8.0%(+12.7)#86 | 10.0%(+10.7)#4,446 |
| 86. | Fries | 20.4% | 8.0%(+12.4)#87 | 10.0%(+10.4)#4,562 |
| 87. | Colonial Beach | 20.1% | 8.0%(+12.1)#88 | 10.0%(+10.1)#4,673 |
| 88. | Fair Lakes | 20.1% | 8.0%(+12.1)#89 | 10.0%(+10.1)#4,681 |
| 89. | Craigsville | 19.8% | 8.0%(+11.8)#90 | 10.0%(+9.89)#4,844 |
| 90. | Toms Brook | 19.6% | 8.0%(+11.6)#91 | 10.0%(+9.66)#4,938 |
| 91. | Franklin | 19.6% | 8.0%(+11.5)#92 | 10.0%(+9.60)#4,956 |
| 92. | Victoria | 19.5% | 8.0%(+11.5)#93 | 10.0%(+9.58)#4,967 |
| 93. | Norton | 19.4% | 8.0%(+11.4)#94 | 10.0%(+9.46)#5,036 |
| 94. | Montross | 19.4% | 8.0%(+11.4)#95 | 10.0%(+9.40)#5,057 |
| 95. | Fort Chiswell | 19.1% | 8.0%(+11.1)#96 | 10.0%(+9.12)#5,185 |
| 96. | Castlewood | 18.9% | 8.0%(+10.9)#97 | 10.0%(+8.91)#5,264 |
| 97. | Allison Gap | 18.8% | 8.0%(+10.7)#98 | 10.0%(+8.80)#5,301 |
| 98. | Martinsville | 18.6% | 8.0%(+10.6)#99 | 10.0%(+8.63)#5,375 |
| 99. | Kenbridge | 18.6% | 8.0%(+10.5)#100 | 10.0%(+8.60)#5,392 |
| 100. | Hopewell | 18.5% | 8.0%(+10.5)#101 | 10.0%(+8.59)#5,400 |
Common Questions
What are the Top 10 Cities with the Highest Poverty Level Among Seniors Over the Age of 65 in Virginia?
Top 10 Cities with the Highest Poverty Level Among Seniors Over the Age of 65 in Virginia are:
#1
100.0%
#2
100.0%
#3
100.0%
#4
100.0%
#5
100.0%
#6
100.0%
#7
100.0%
#8
90.8%
#9
89.4%
#10
66.7%
What city has the Highest Poverty Level Among Seniors Over the Age of 65 in Virginia?
Chase Crossing has the Highest Poverty Level Among Seniors Over the Age of 65 in Virginia with 100.0%.
What is the Poverty Level Among Seniors Over the Age of 65 in the State of Virginia?
Poverty Level Among Seniors Over the Age of 65 in Virginia is 8.0%.
What is the Poverty Level Among Seniors Over the Age of 65 in the United States?
Poverty Level Among Seniors Over the Age of 65 in the United States is 10.0%.